
Illinois homeowners may be sitting on a ticking time bomb. Using the Zillow Home Values Index, analysts have pinpointed 15 towns where property prices look increasingly unstable. These communities show multiple crash risk signals: prices stretched beyond long-term averages, severe affordability issues, rising foreclosures, and echoes of past market downturns. With Illinois ranking among the top states for housing market vulnerability, buyers in these towns could face steep losses if the market corrects.
15. Phoenix – Crash Risk Percentage: 84.85%
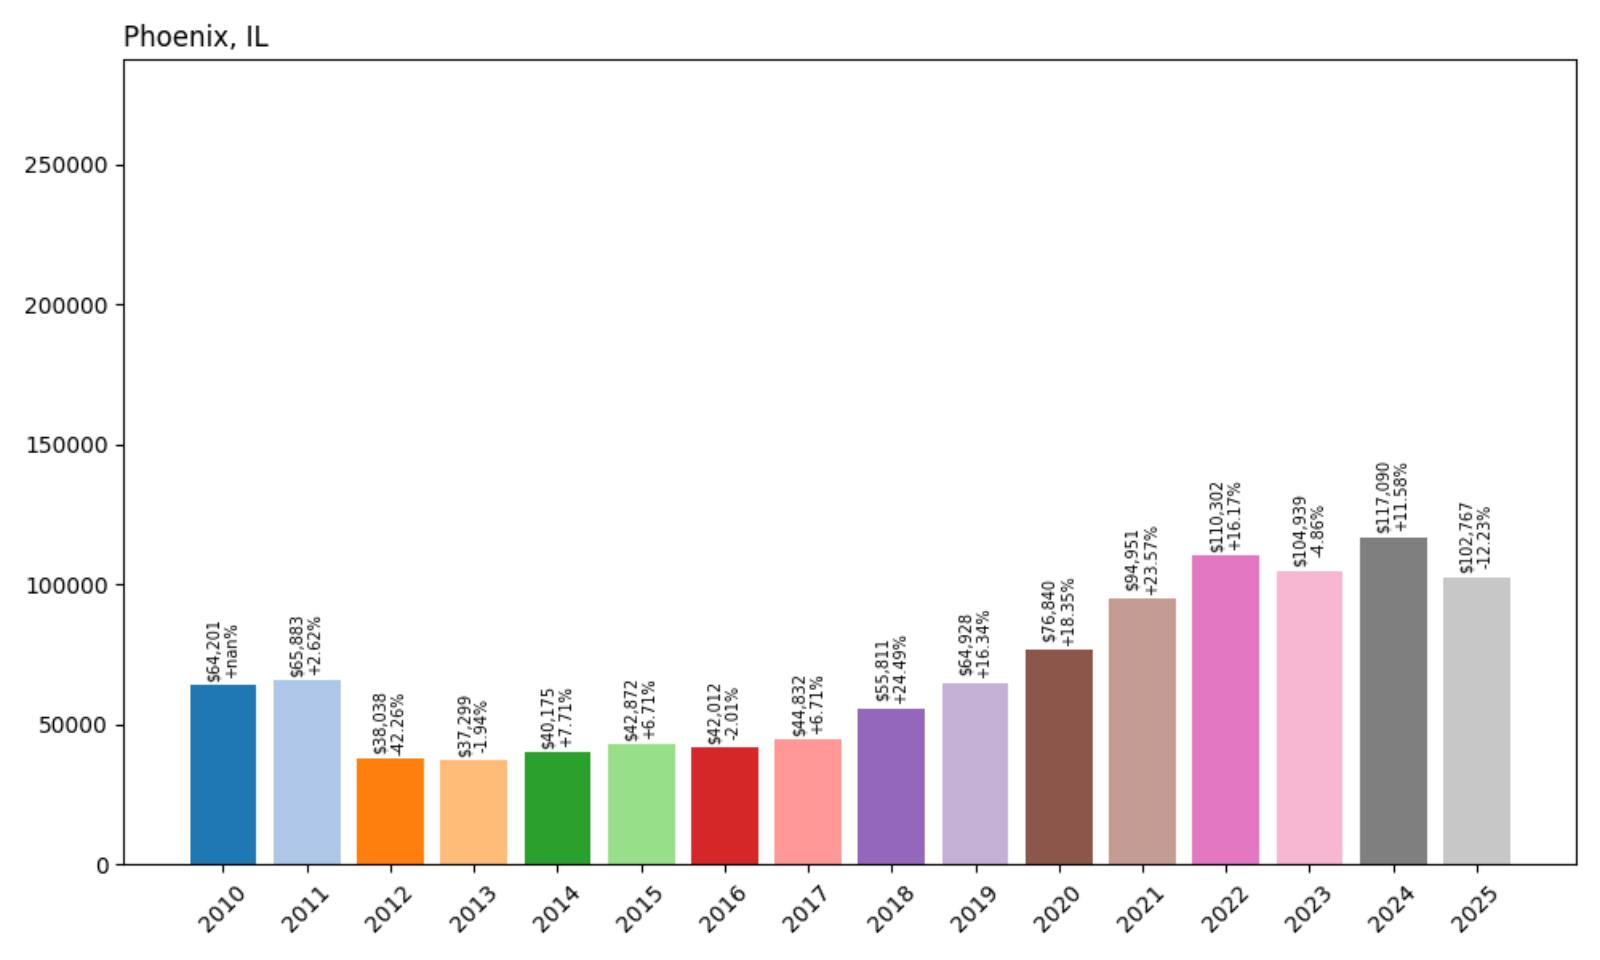
- Crash Risk Percentage: 84.85%
- Historical crashes (8%+ drops): 2
- Worst historical crash: 42.3% (2012)
- Total price increase since 2010: 60.1%
- Overextended above long-term average: 49.1%
- Price volatility (annual swings): 16.8%
- Current 2025 price: $102,767
Phoenix shows significant vulnerability with its 84.85% crash risk score, driven by a history of major market corrections and current overextension. The town experienced a devastating 42.3% crash in 2012, demonstrating its susceptibility to severe market downturns. Despite recovering with a 60.1% price increase since 2010, Phoenix remains 49.1% overextended above its long-term average, creating mathematical unsustainability in the current market conditions.
Phoenix – Dangerous Overextension After Historic Volatility
Phoenix, Illinois represents a small community that has experienced the full spectrum of housing market volatility over the past 15 years. Currently priced at $102,767, the town sits nearly 50% above its historical pricing trends, a level that housing economists consider unsustainable. The 16.8% annual price volatility indicates an unstable market where values can shift dramatically from year to year, making it particularly vulnerable to external economic pressures.
The town’s 2012 crash serves as a stark reminder of what can happen when overextended markets face economic headwinds. That 42.3% decline wiped out years of home equity gains and left many homeowners underwater on their mortgages. With Phoenix currently showing similar warning signs of overextension and the broader Illinois housing market facing affordability challenges, the conditions are aligning for another potential correction that could rival the severity of the 2012 crash.
14. Chicago Heights – Crash Risk Percentage: 86.20%

- Crash Risk Percentage: 86.20%
- Historical crashes (8%+ drops): 2
- Worst historical crash: 19.0% (2011)
- Total price increase since 2010: 137.6%
- Overextended above long-term average: 75.2%
- Price volatility (annual swings): 12.5%
- Current 2025 price: $171,716
Chicago Heights exhibits extreme overextension with prices 75.2% above long-term averages, representing one of the most mathematically unsustainable housing markets in Illinois. The 137.6% price increase since 2010 has created a bubble-like condition where current valuations bear little resemblance to historical norms. This south suburban community has previously experienced two significant crashes, including a 19% decline in 2011, proving its vulnerability to market corrections.
Chicago Heights – Suburban Bubble Ready to Burst
Chicago Heights, located about 30 miles south of downtown Chicago in Cook County, has become a poster child for unsustainable housing market inflation. With a current median price of $171,716, the community has seen values more than double since 2010, far outpacing local income growth and economic fundamentals. This working-class suburb, historically known for its manufacturing base and diverse population, now faces the reality that its housing prices have disconnected from local economic conditions.
The town’s proximity to Chicago initially drove demand as buyers sought more affordable alternatives to city living. However, the 75.2% overextension above long-term averages suggests that this premium has reached unsustainable levels. With the broader Chicago metropolitan area identified by ATTOM Data as one of the most vulnerable housing markets in the nation, Chicago Heights faces multiple pressure points that could trigger a significant price correction, potentially matching or exceeding the 19% decline experienced in 2011.
13. Chatsworth – Crash Risk Percentage: 86.95%
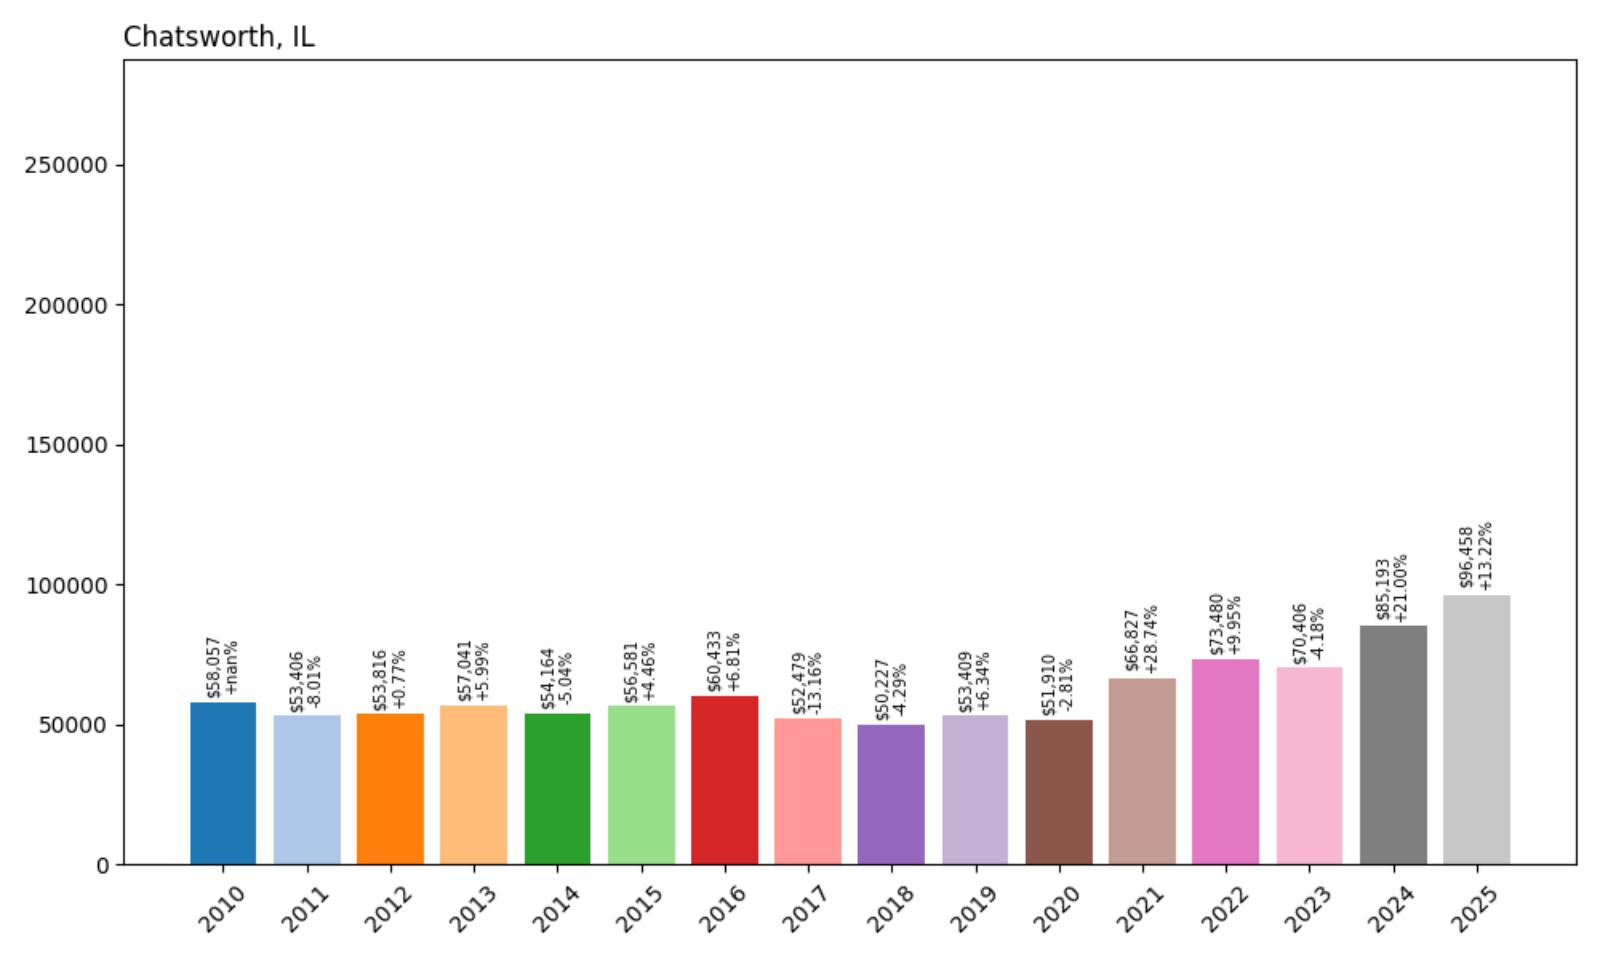
- Crash Risk Percentage: 86.95%
- Historical crashes (8%+ drops): 2
- Worst historical crash: 13.2% (2017)
- Total price increase since 2010: 66.1%
- Overextended above long-term average: 55.3%
- Price volatility (annual swings): 11.2%
- Current 2025 price: $96,458
Chatsworth demonstrates concerning vulnerability with an 86.95% crash risk score, elevated by its pattern of repeated market corrections and current overextension. The town has experienced two historical crashes, most recently a 13.2% decline in 2017, indicating ongoing market instability. With prices 55.3% above long-term averages and a 66.1% increase since 2010, Chatsworth shows classic signs of an overheated market primed for correction.
Chatsworth – Rural Community Facing Urban Market Pressures

Chatsworth, a small rural community in central Illinois, has experienced an unexpected housing boom that has pushed values far beyond sustainable levels. The town’s current median price of $96,458 represents a 66.1% increase since 2010, a dramatic appreciation for a community that lacks the economic drivers typically associated with such growth. This agricultural region has historically maintained stable, affordable housing that reflected local economic conditions and employment opportunities.
The recent overextension has created a dangerous disconnect between home values and local economic fundamentals. With limited job growth and an economy still largely dependent on agriculture, the 55.3% overextension above long-term averages appears mathematically unsustainable. The 2017 crash that resulted in a 13.2% decline serves as a recent reminder of how quickly rural Illinois markets can correct when speculative pressures subside. Current conditions suggest another correction may be imminent.
12. Du Quoin – Crash Risk Percentage: 88.05%
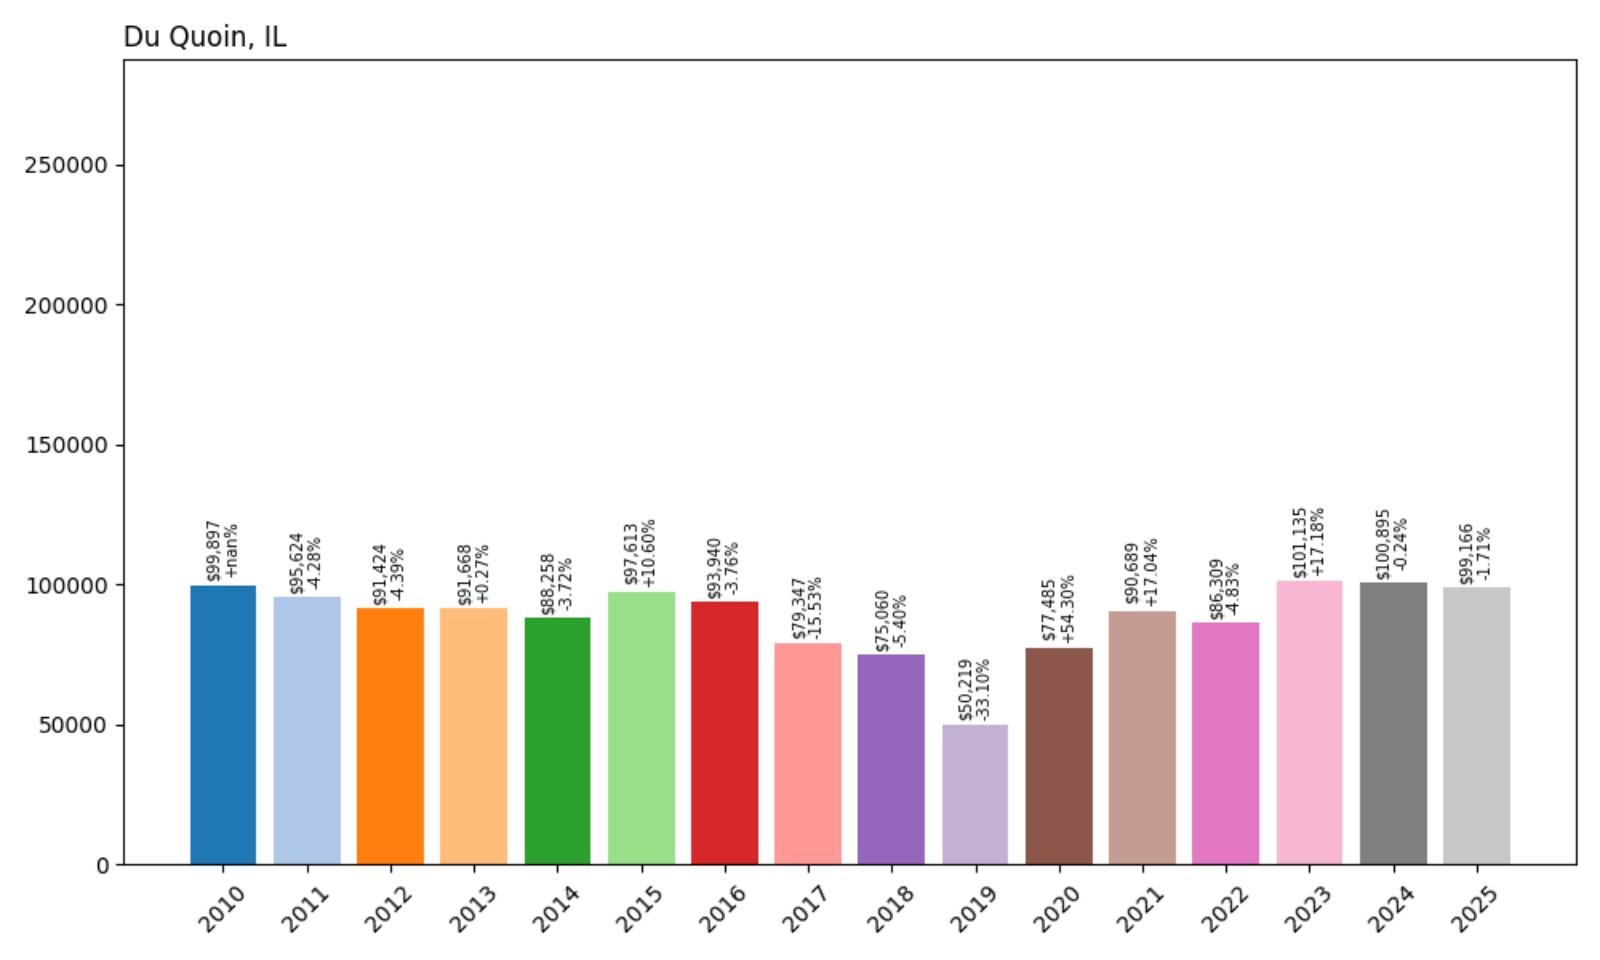
- Crash Risk Percentage: 88.05%
- Historical crashes (8%+ drops): 2
- Worst historical crash: 33.1% (2019)
- Total price increase since 2010: -0.7%
- Overextended above long-term average: 11.8%
- Price volatility (annual swings): 19.0%
- Current 2025 price: $99,166
Du Quoin presents a unique risk profile with the highest price volatility on our list at 19.0% annual swings, indicating an extremely unstable housing market. The town suffered a devastating 33.1% crash in 2019, one of the most severe declines in our analysis. Despite minimal long-term price appreciation (-0.7% since 2010), the extreme volatility and recent crash history create an 88.05% risk score that suggests ongoing market instability.
Du Quoin – Extreme Volatility Signals Market Instability
Du Quoin, located in southern Illinois, exemplifies a housing market characterized by extreme instability and unpredictable price swings. With a current median price of $99,166, the town has experienced virtually no net price appreciation since 2010, yet the 19.0% annual volatility indicates a market that lacks fundamental stability. This rural community, known for its annual state fair and agricultural heritage, has struggled to maintain consistent housing values in an increasingly challenging economic environment.
The catastrophic 33.1% crash in 2019 represents one of the most severe housing market corrections in recent Illinois history, wiping out years of home equity and creating lasting economic trauma for the community. The fact that Du Quoin has experienced two separate crashes despite minimal overall price appreciation suggests underlying structural problems in the local economy and housing market. The continued high volatility indicates that another significant correction could occur with little warning, making this market extremely risky for current homeowners and potential buyers.
11. Enfield – Crash Risk Percentage: 88.40%
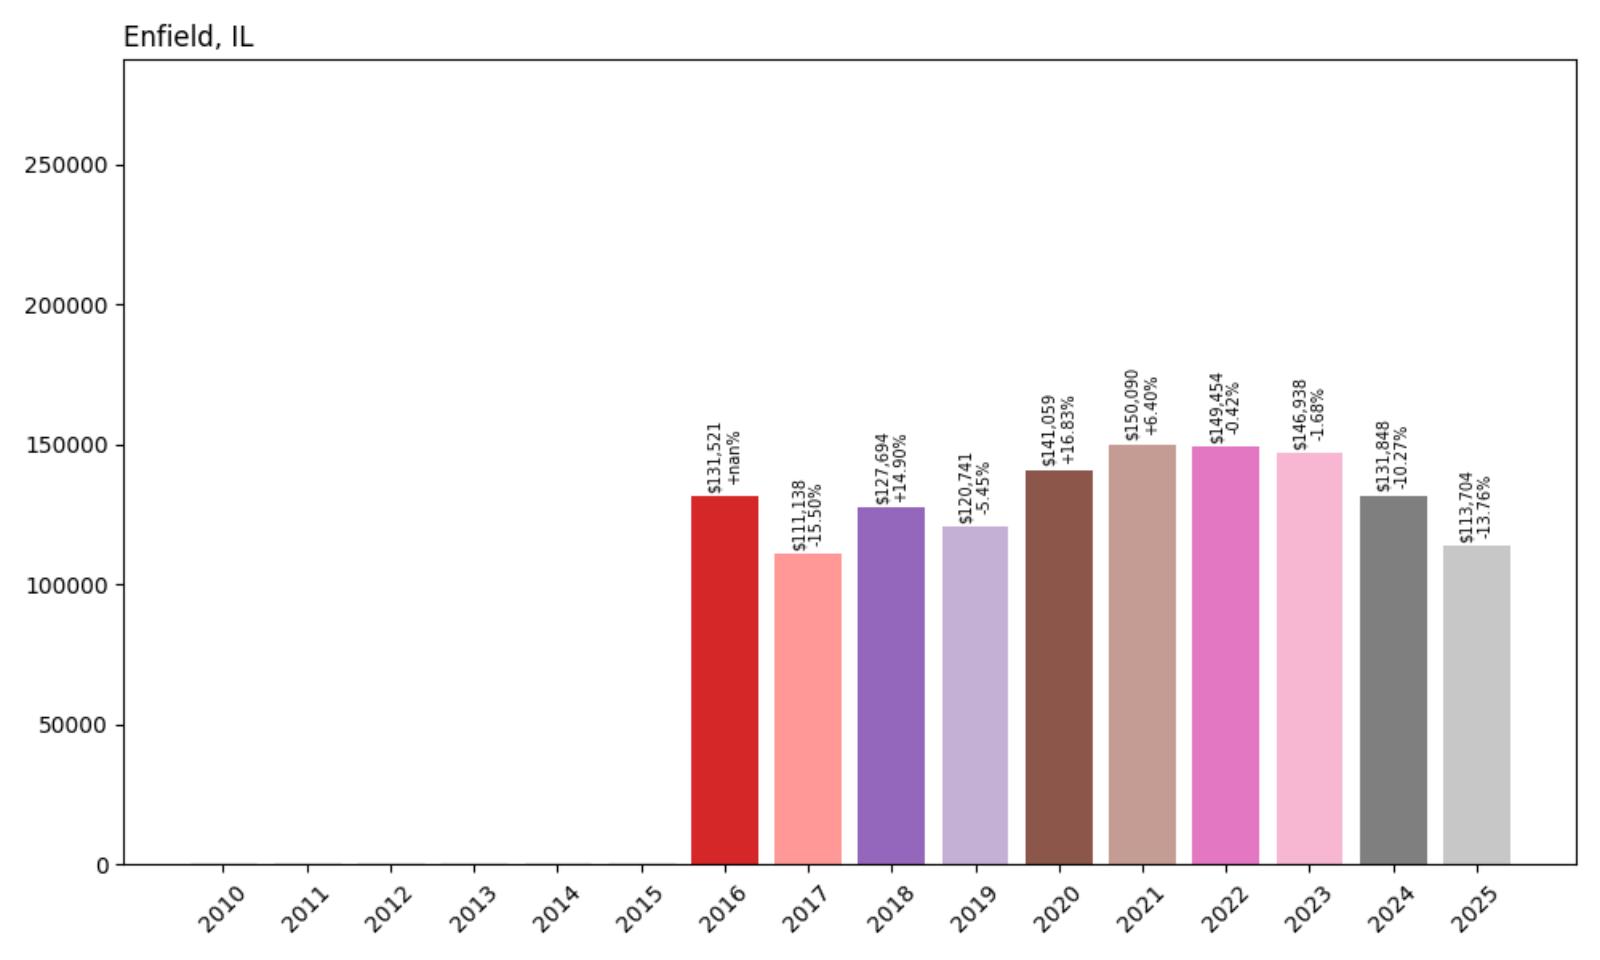
- Crash Risk Percentage: 88.40%
- Historical crashes (8%+ drops): 3
- Worst historical crash: 15.5% (2017)
- Total price increase since 2016: -13.5%
- Overextended above long-term average: -14.1%
- Price volatility (annual swings): 11.8%
- Current 2025 price: $113,704
Enfield stands out with three historical crashes, making it one of the most crash-prone communities in Illinois. The town has experienced a 13.5% decline since 2016, indicating ongoing market weakness rather than overextension. Currently trading 14.1% below long-term averages, Enfield’s 88.40% crash risk stems from its pattern of repeated market failures and continued volatility rather than overvaluation.
Enfield – Chronic Market Weakness Signals Systemic Problems
Enfield, a small community in southeastern Illinois, represents a housing market trapped in a cycle of chronic weakness and repeated corrections. With a current median price of $113,704, the town has experienced three separate crashes over the past 15 years, including a 15.5% decline in 2017. This pattern of repeated market failures suggests deep-rooted economic challenges that make sustainable housing appreciation nearly impossible.
Unlike many communities on our list that face crash risk due to overextension, Enfield’s vulnerability stems from ongoing economic decline and population loss. The 13.5% price decline since 2016 reflects a market that continues to weaken, making it susceptible to additional corrections even though values are currently 14.1% below long-term averages. This rural community faces the dual challenge of limited economic opportunities and an aging population, creating conditions where another housing market crash could push values to historic lows.
10. Thornton – Crash Risk Percentage: 88.60%
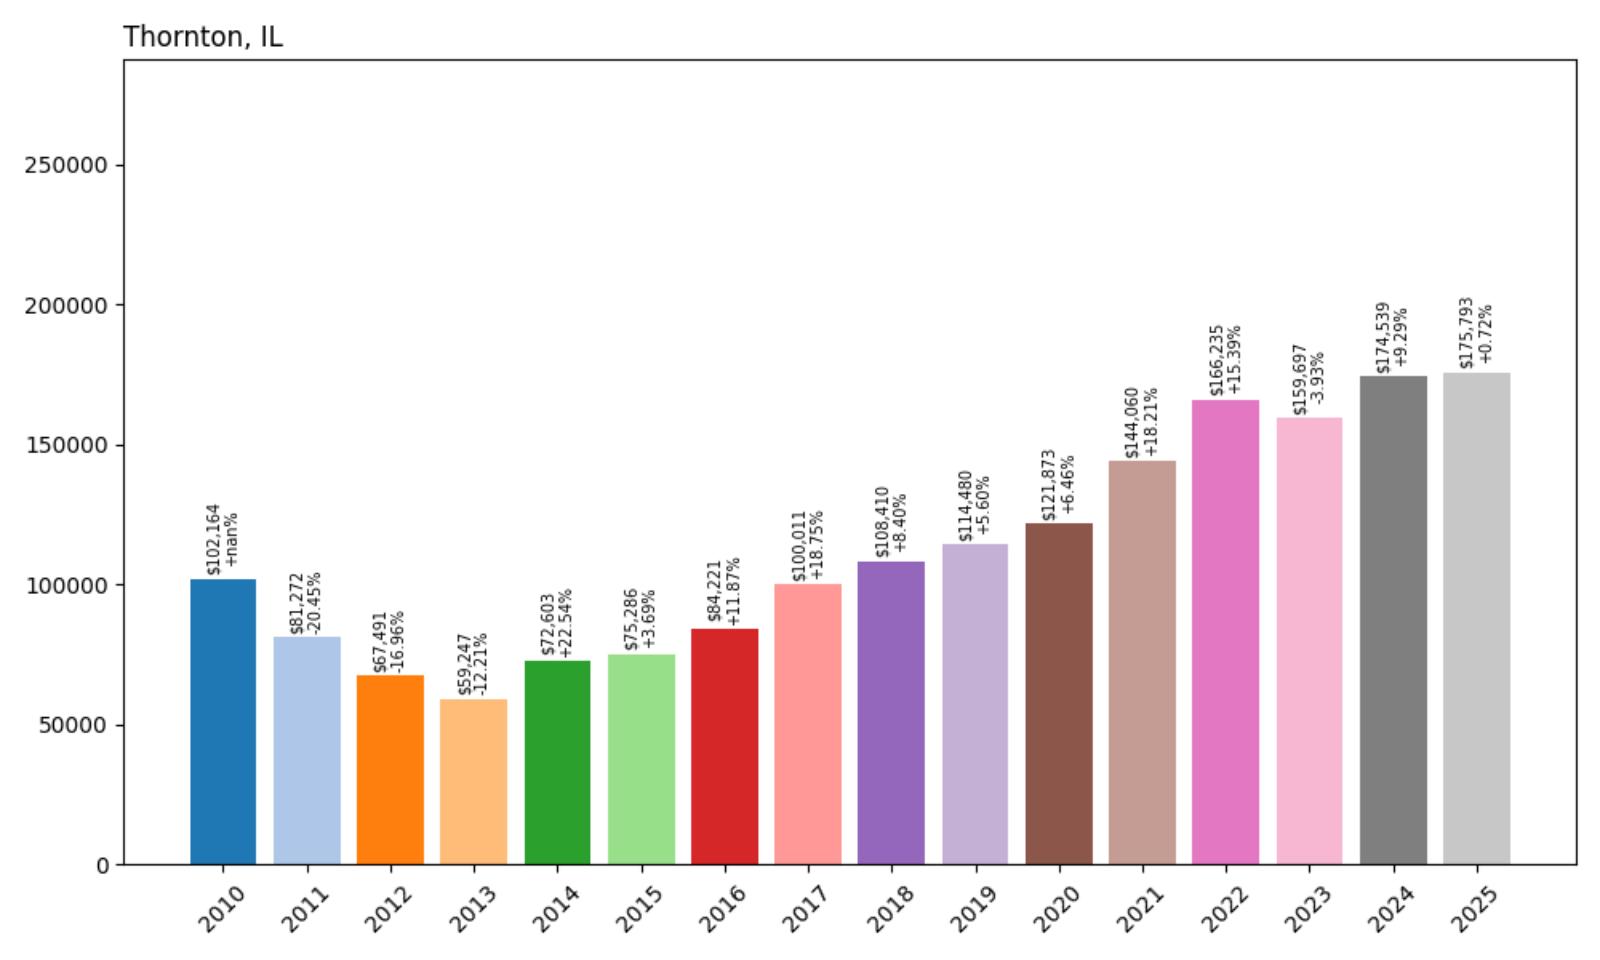
- Crash Risk Percentage: 88.60%
- Historical crashes (8%+ drops): 3
- Worst historical crash: 20.4% (2011)
- Total price increase since 2010: 72.1%
- Overextended above long-term average: 55.6%
- Price volatility (annual swings): 13.0%
- Current 2025 price: $175,793
Thornton combines multiple risk factors with three historical crashes and significant current overextension. The south suburban Chicago community experienced a severe 20.4% crash in 2011, demonstrating its vulnerability to market corrections. With prices 55.6% above long-term averages and a 72.1% increase since 2010, Thornton shows dangerous overextension that historically precedes major market corrections.
Thornton – South Suburban Overextension Mirrors Regional Risks
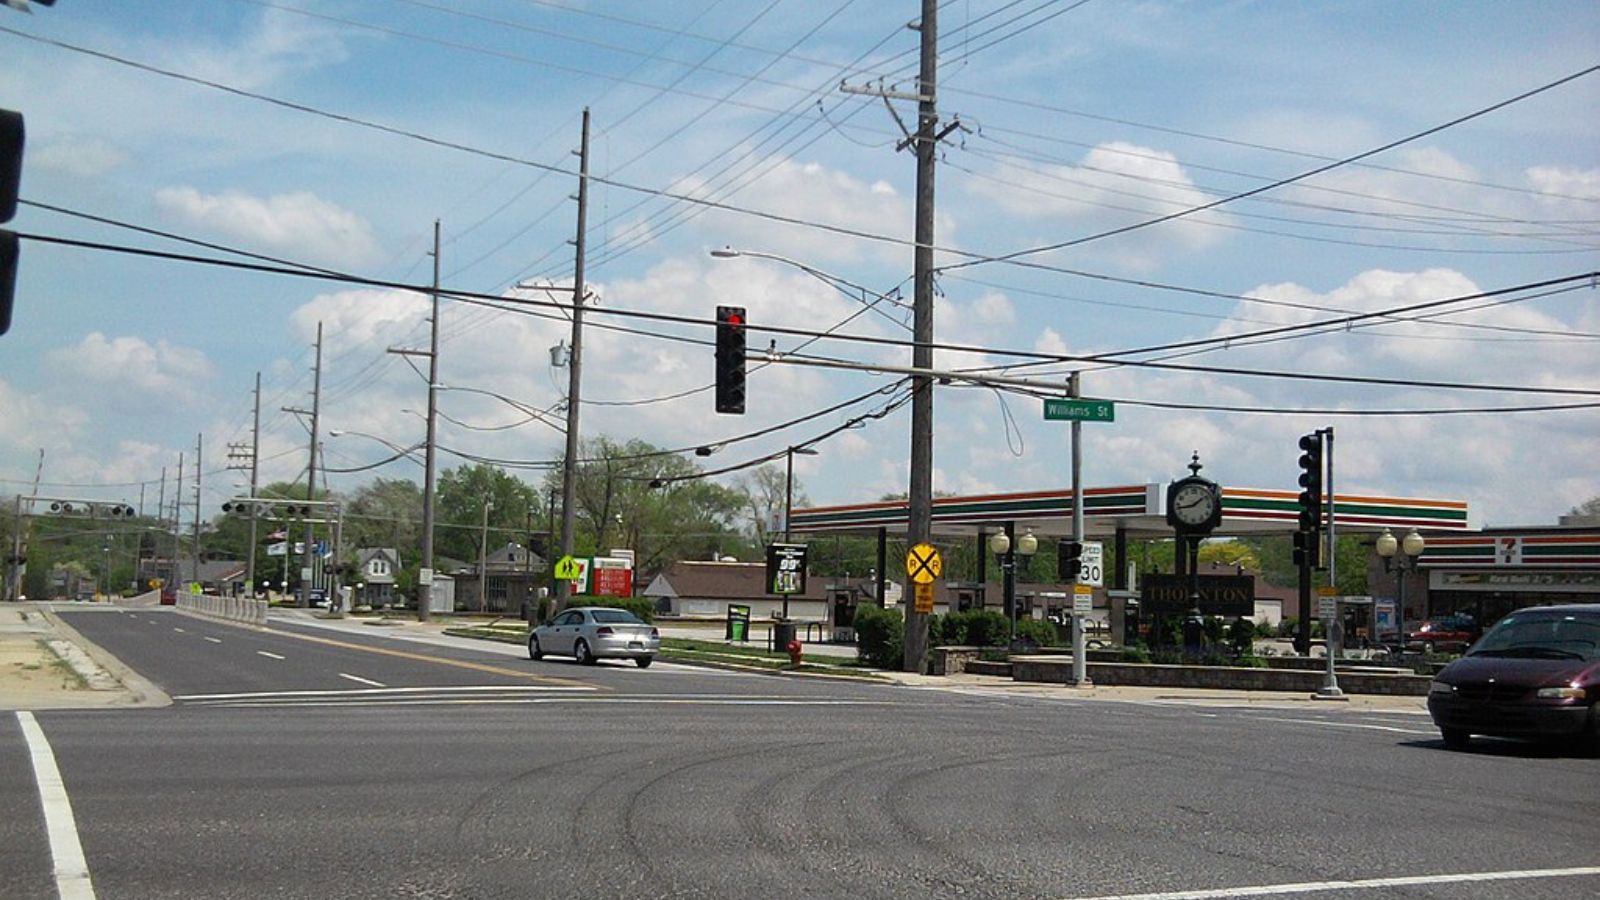
Thornton, located in Cook County approximately 25 miles south of downtown Chicago, exemplifies the dangerous overextension affecting many south suburban communities. With a current median price of $175,793, the town has experienced a 72.1% price increase since 2010, pushing values 55.6% above sustainable long-term averages. This predominantly African American community has struggled with the classic suburban challenges of aging infrastructure, population decline, and limited economic development.
The town’s three historical crashes, including a devastating 20.4% decline in 2011, demonstrate how quickly suburban Chicago markets can correct when economic pressures mount. Thornton’s vulnerability is amplified by its location within Cook County, which has been consistently identified as one of the most at-risk housing markets in the nation. The combination of local overextension and regional economic challenges creates conditions where another significant correction appears mathematically inevitable.
9. Dolton – Crash Risk Percentage: 89.35%

- Crash Risk Percentage: 89.35%
- Historical crashes (8%+ drops): 2
- Worst historical crash: 29.3% (2012)
- Total price increase since 2010: 94.8%
- Overextended above long-term average: 64.2%
- Price volatility (annual swings): 17.8%
- Current 2025 price: $156,055
Dolton exhibits extreme overextension with a 94.8% price increase since 2010, creating a 64.2% gap above long-term averages. The community suffered a catastrophic 29.3% crash in 2012, proving its susceptibility to severe corrections. High volatility of 17.8% annual swings indicates an unstable market where dramatic price movements are common, contributing to the 89.35% crash risk score.
Dolton – Historic Crash Warns of Repeat Performance
Dolton, another south suburban Chicago community in Cook County, has experienced a dramatic housing market bubble that mirrors the conditions preceding its devastating 2012 crash. With a current median price of $156,055, the town has seen values nearly double since 2010, creating a 64.2% overextension above long-term averages. This working-class community, historically known for affordable housing options for Chicago commuters, now faces pricing levels that have disconnected from local economic realities.
The 29.3% crash in 2012 serves as a stark reminder of how quickly overextended markets can collapse when economic pressures intensify. That correction wiped out nearly a third of home values, creating widespread negative equity and economic hardship. With current conditions showing similar overextension patterns and the broader Chicago area facing renewed economic challenges, Dolton appears positioned for another significant correction that could match or exceed the severity of the 2012 crash.
8. Calumet Park – Crash Risk Percentage: 89.37%
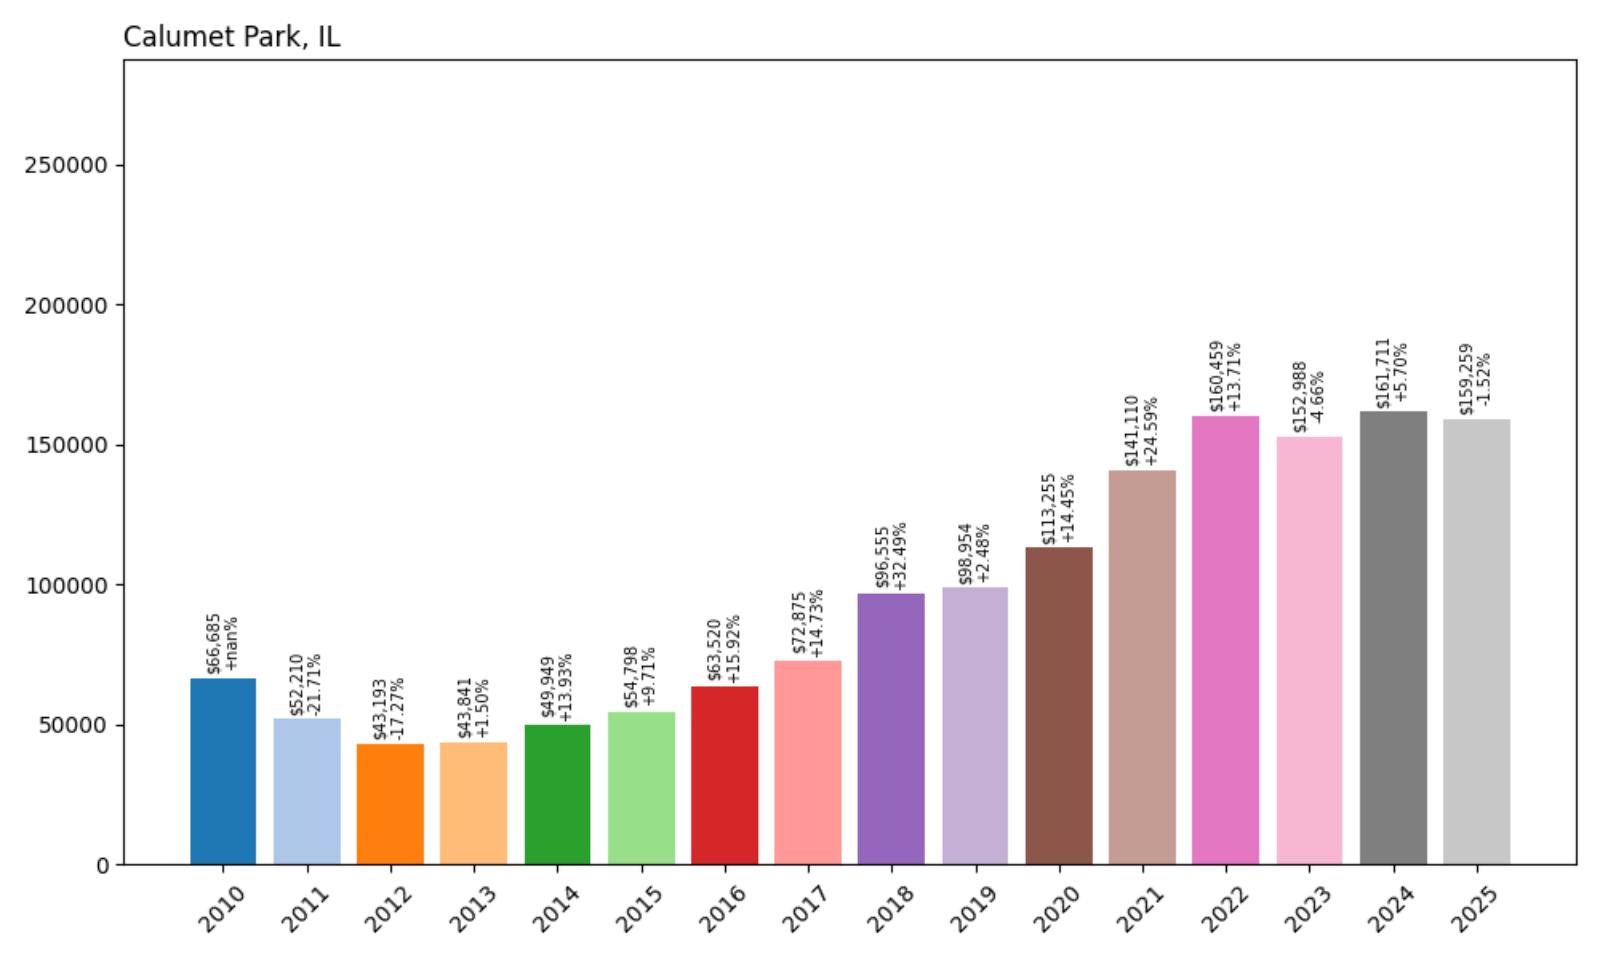
- Crash Risk Percentage: 89.37%
- Historical crashes (8%+ drops): 2
- Worst historical crash: 21.7% (2011)
- Total price increase since 2010: 138.8%
- Overextended above long-term average: 66.4%
- Price volatility (annual swings): 14.5%
- Current 2025 price: $159,259
Calumet Park demonstrates extreme bubble conditions with a 138.8% price increase since 2010, creating a dangerous 66.4% overextension above long-term averages. The community has experienced two historical crashes, including a 21.7% decline in 2011, establishing a pattern of market instability. The current overextension represents one of the most mathematically unsustainable housing markets in the Chicago area.
Calumet Park – Bubble Conditions Exceed Sustainable Limits
Calumet Park, a small community in Cook County, has experienced one of the most dramatic housing bubbles in the Chicago metropolitan area. With a current median price of $159,259, the town has seen values more than double since 2010, creating a 66.4% overextension above long-term averages that appears mathematically unsustainable. This historically affordable community has transformed into a market where prices bear little resemblance to local economic fundamentals.
The 21.7% crash in 2011 provides a preview of what can happen when bubble conditions meet economic reality. That correction occurred when the market was far less overextended than current conditions, suggesting that another crash could be even more severe. With limited local economic drivers and dependence on proximity to Chicago for employment, Calumet Park faces the risk of a correction that could push values below historical norms, creating long-term economic challenges for the community.
7. Burnham – Crash Risk Percentage: 91.80%
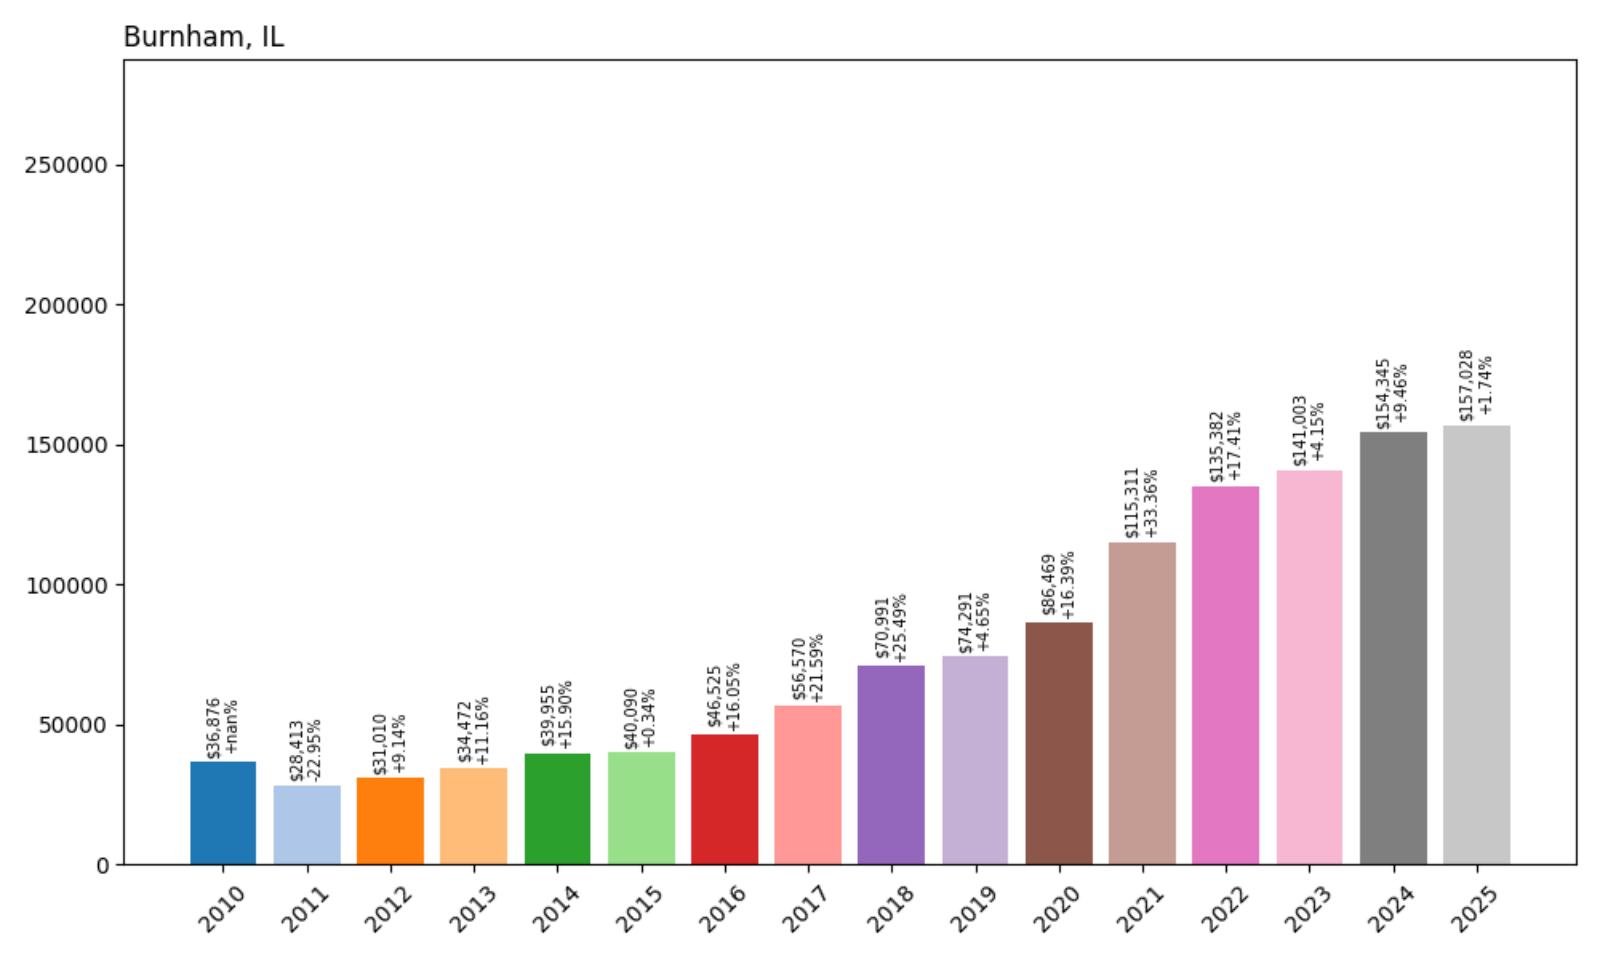
- Crash Risk Percentage: 91.80%
- Historical crashes (8%+ drops): 1
- Worst historical crash: 23.0% (2011)
- Total price increase since 2010: 325.8%
- Overextended above long-term average: 101.2%
- Price volatility (annual swings): 13.1%
- Current 2025 price: $157,028
Burnham exhibits the most extreme overextension on our list with a staggering 325.8% price increase since 2010, creating a 101.2% gap above long-term averages. This represents a doubling of sustainable price levels, making Burnham’s housing market mathematically unsustainable. Despite experiencing only one historical crash (23.0% in 2011), the current extreme overextension drives the 91.80% crash risk score.
Burnham – Extreme Bubble Defies Economic Logic
Burnham, a small industrial community in Cook County, has experienced the most dramatic housing bubble in our analysis, with values increasing an unprecedented 325.8% since 2010. This tiny south suburban town, with a current median price of $157,028, now trades at more than double its sustainable long-term price level. Such extreme overextension defies economic logic and creates conditions where a severe correction appears mathematically inevitable.
The community’s industrial heritage and blue-collar workforce make the current pricing levels particularly unsustainable when compared to local income levels and economic opportunities. The 23.0% crash in 2011 occurred when the market was far less overextended, suggesting that a correction from current levels could be catastrophic. With prices now 101.2% above long-term averages, Burnham faces the risk of a crash that could cut home values in half, returning them to more sustainable levels aligned with local economic fundamentals.
6. Markham – Crash Risk Percentage: 92.60%
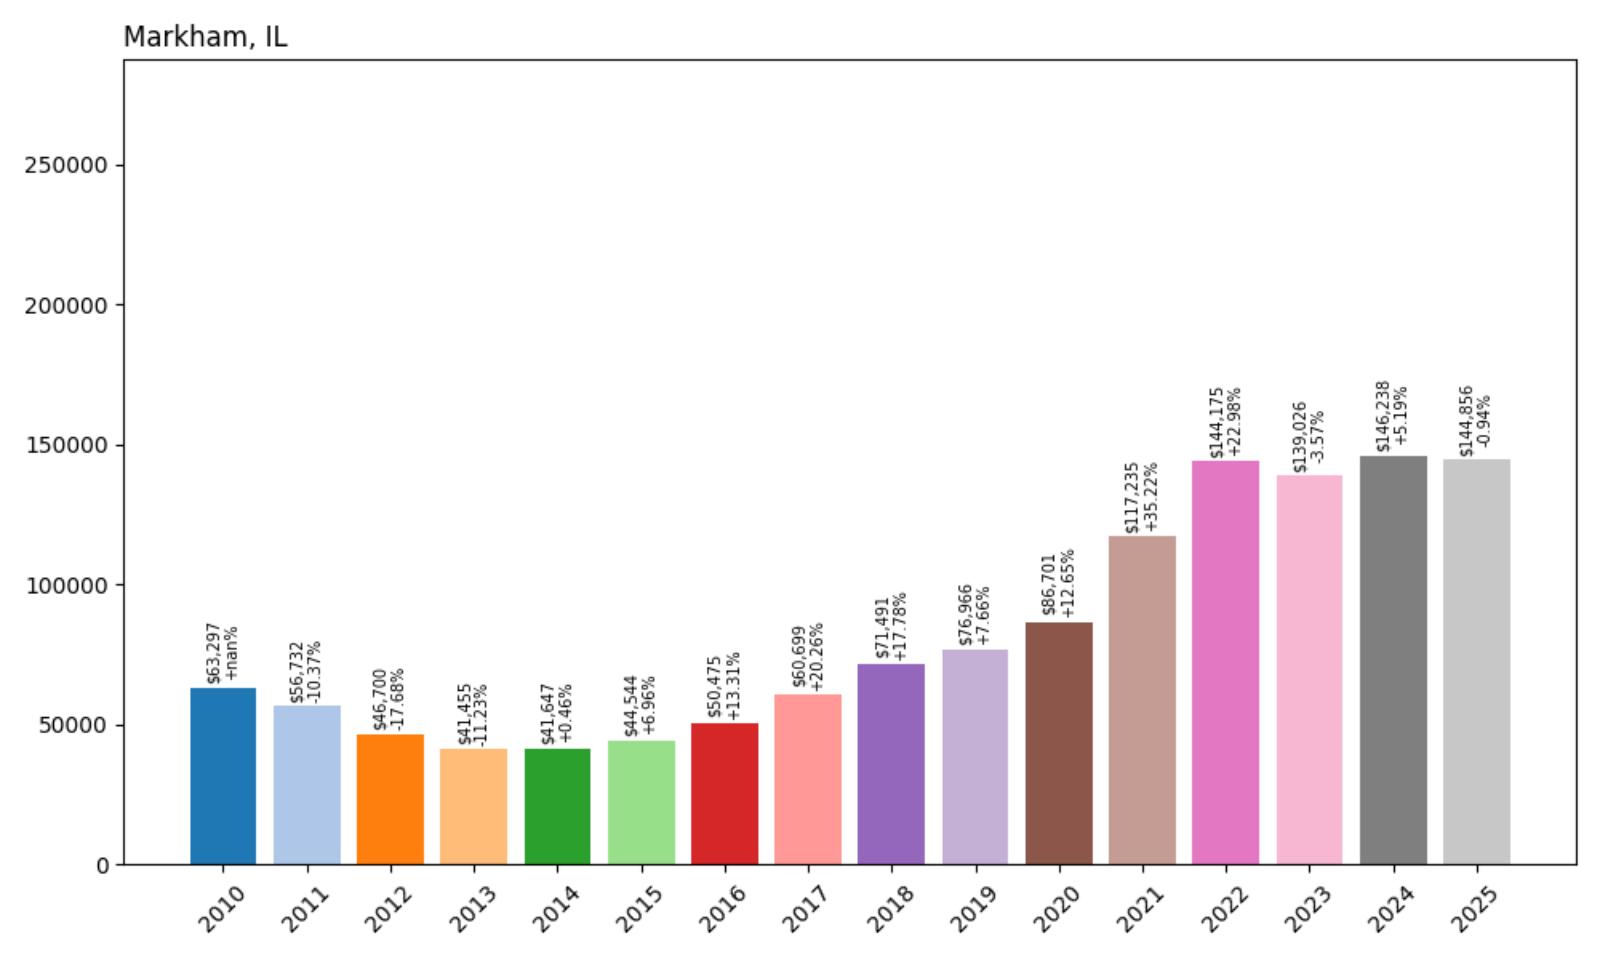
- Crash Risk Percentage: 92.60%
- Historical crashes (8%+ drops): 3
- Worst historical crash: 17.7% (2012)
- Total price increase since 2010: 128.9%
- Overextended above long-term average: 74.0%
- Price volatility (annual swings): 14.3%
- Current 2025 price: $144,856
Markham combines multiple risk factors with three historical crashes and severe current overextension. The south suburban community has experienced a 128.9% price increase since 2010, pushing values 74.0% above long-term averages. This pattern of repeated crashes combined with extreme overextension creates the sixth-highest crash risk score in Illinois at 92.60%.
Markham – Repeat Crash Offender Signals Systemic Instability
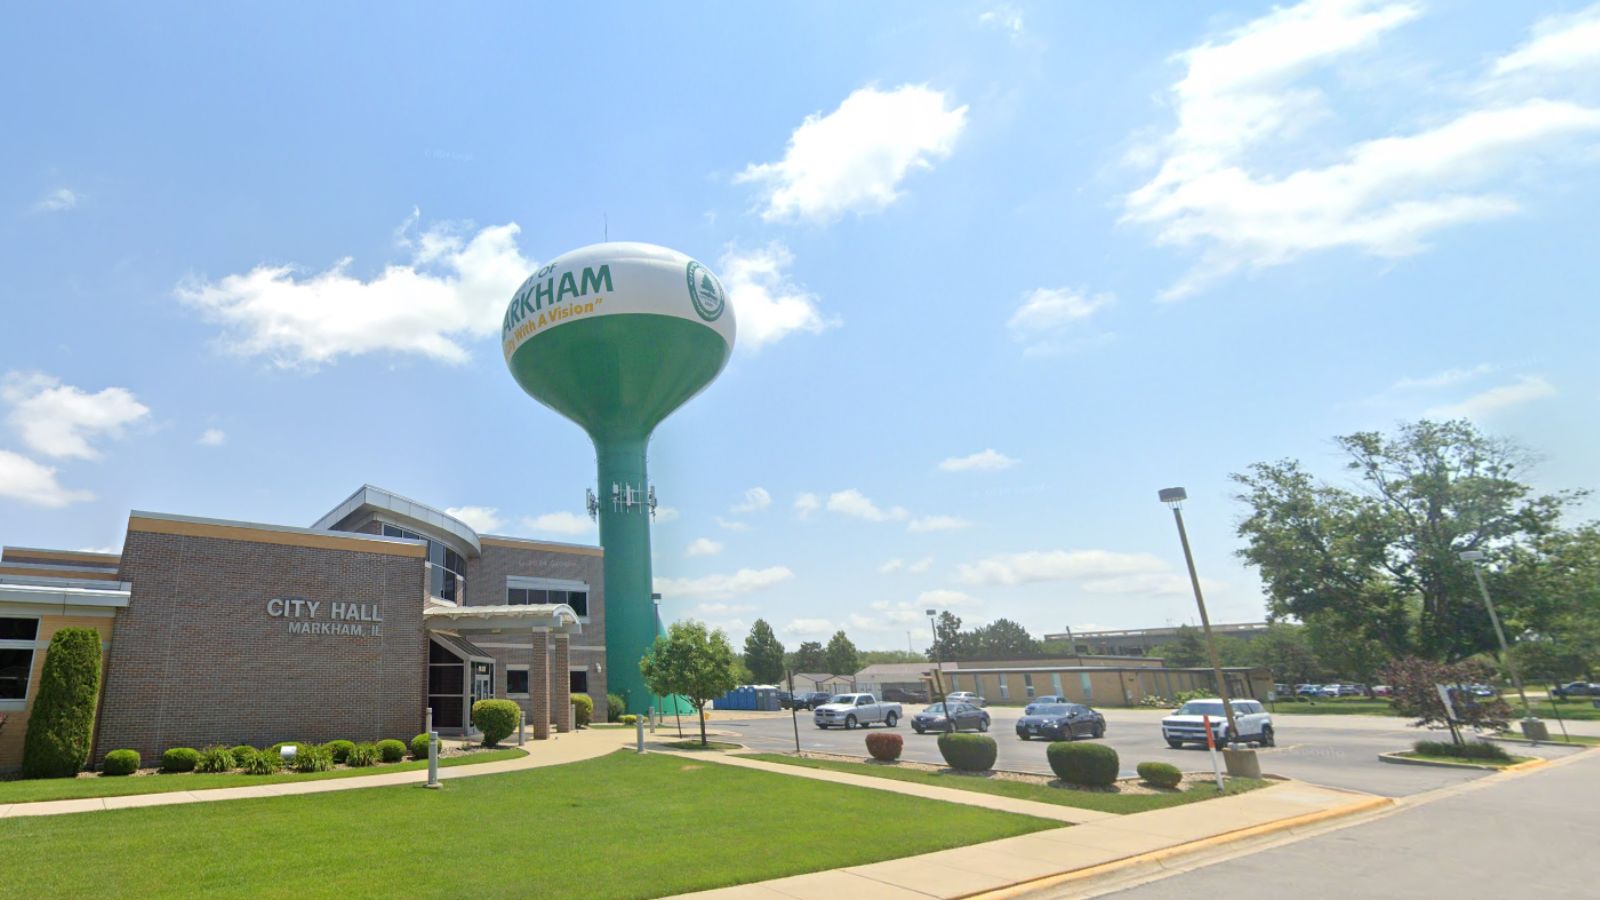
Markham, located in Cook County south of Chicago, represents a housing market characterized by chronic instability and repeated corrections. With a current median price of $144,856, the community has experienced three separate crashes over the past 15 years, including a 17.7% decline in 2012. This pattern of repeated market failures suggests underlying economic challenges that make sustainable housing appreciation difficult to achieve.
The town’s 128.9% price increase since 2010 has created a 74.0% overextension above long-term averages, levels that historically precede major corrections. Markham’s vulnerability is compounded by its location within Cook County’s challenging economic environment, where population decline, high taxes, and limited job growth create ongoing pressure on housing values. The combination of historical crash patterns and current overextension makes another significant correction appear highly probable.
5. South Chicago Heights – Crash Risk Percentage: 93.95%
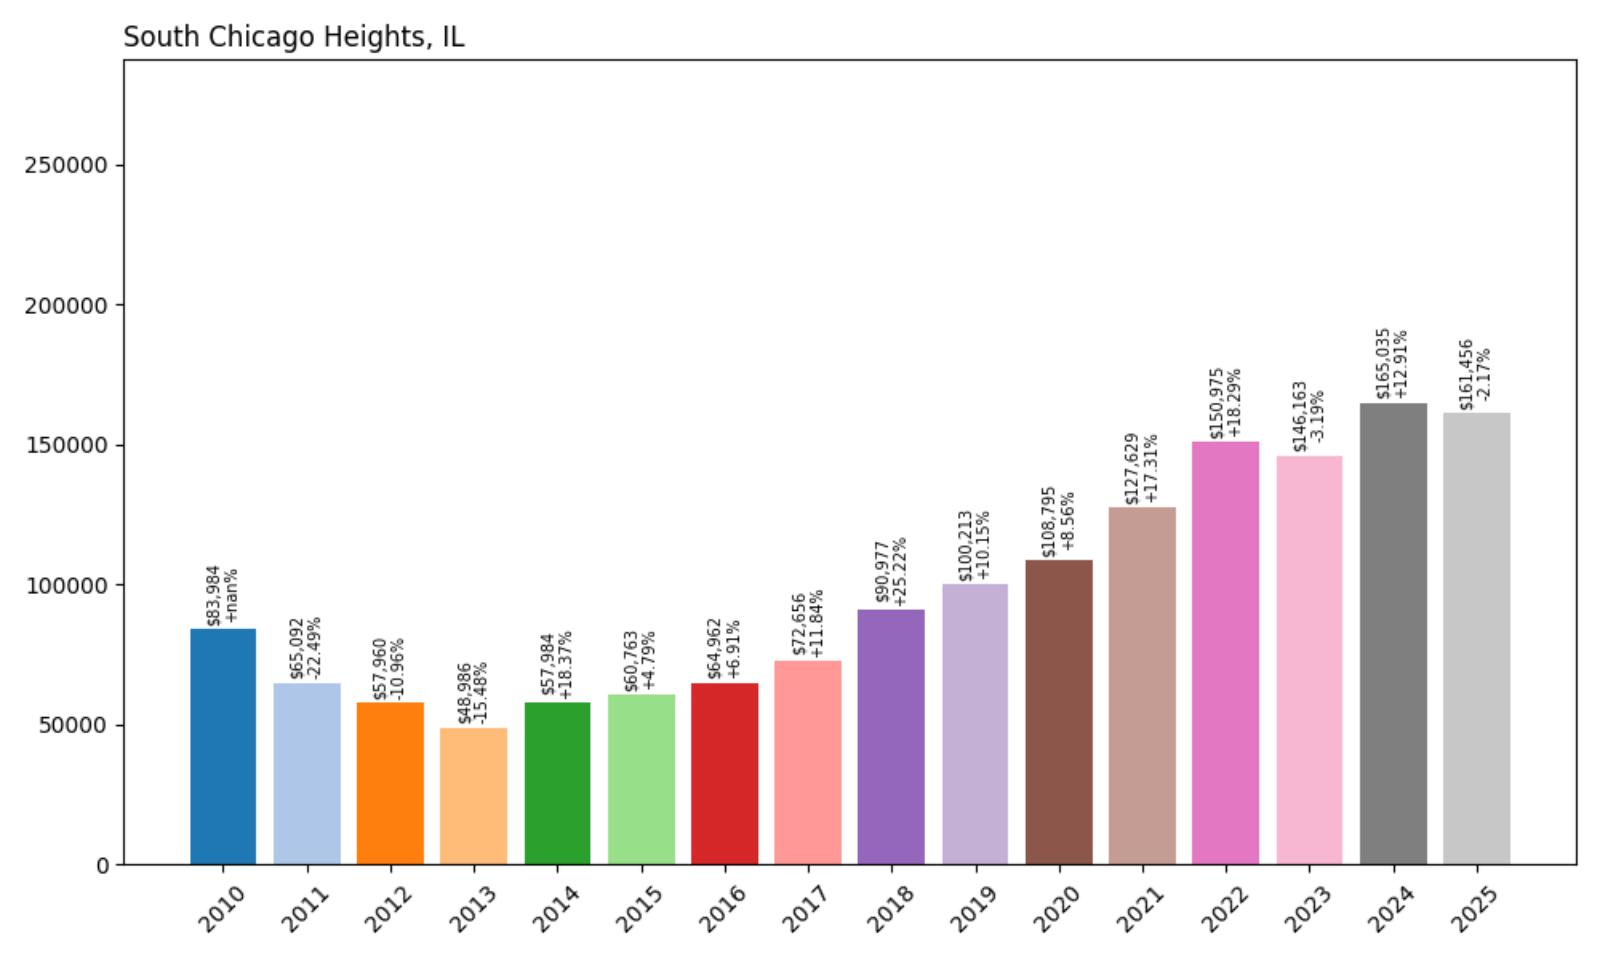
- Crash Risk Percentage: 93.95%
- Historical crashes (8%+ drops): 3
- Worst historical crash: 22.5% (2011)
- Total price increase since 2010: 92.2%
- Overextended above long-term average: 65.2%
- Price volatility (annual swings): 13.7%
- Current 2025 price: $161,456
South Chicago Heights demonstrates dangerous vulnerability with three historical crashes and significant overextension. The community suffered a 22.5% crash in 2011, establishing a pattern of market instability. With a 92.2% price increase since 2010 creating a 65.2% overextension above long-term averages, South Chicago Heights shows classic bubble conditions that historically precede major corrections.
South Chicago Heights – Triple Crash History Predicts Future Volatility
South Chicago Heights, a working-class community in Cook County, has established itself as one of the most crash-prone housing markets in Illinois with three separate corrections over the past 15 years. The town’s current median price of $161,456 represents a 92.2% increase since 2010, creating a 65.2% overextension above sustainable long-term levels. This dramatic appreciation has occurred despite ongoing economic challenges that limit the community’s ability to support such elevated values.
The 22.5% crash in 2011 serves as a reminder of how quickly overextended markets can correct when economic pressures mount. The town’s pattern of repeated crashes suggests underlying structural problems that make sustained housing appreciation difficult to maintain. With current overextension levels approaching those seen before previous corrections, South Chicago Heights appears positioned for another significant market decline that could match or exceed the severity of previous crashes.
4. Riverdale – Crash Risk Percentage: 95.00%
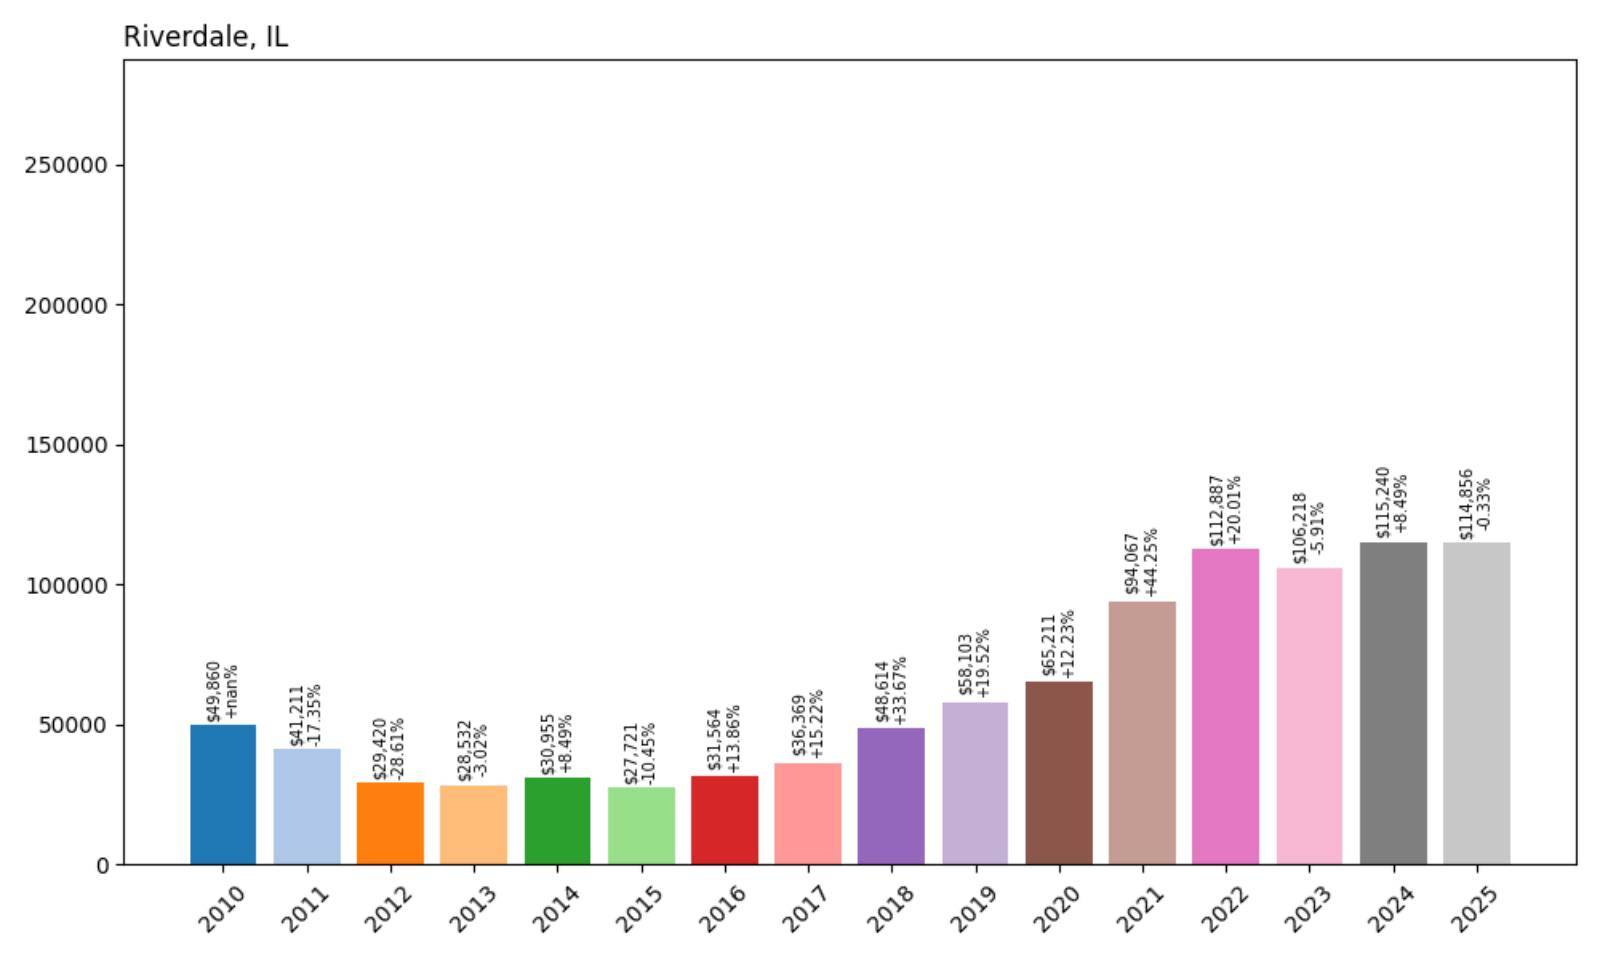
- Crash Risk Percentage: 95.00%
- Historical crashes (8%+ drops): 3
- Worst historical crash: 28.6% (2012)
- Total price increase since 2010: 130.4%
- Overextended above long-term average: 85.5%
- Price volatility (annual swings): 19.0%
- Current 2025 price: $114,856
Riverdale achieves a maximum 95.00% crash risk score through a combination of extreme overextension and historical instability. The community has experienced three crashes, including a devastating 28.6% decline in 2012. With prices 85.5% above long-term averages and the highest volatility on our list at 19.0%, Riverdale exhibits all the warning signs of an imminent major correction.
Riverdale – Maximum Risk Score Warns of Imminent Collapse
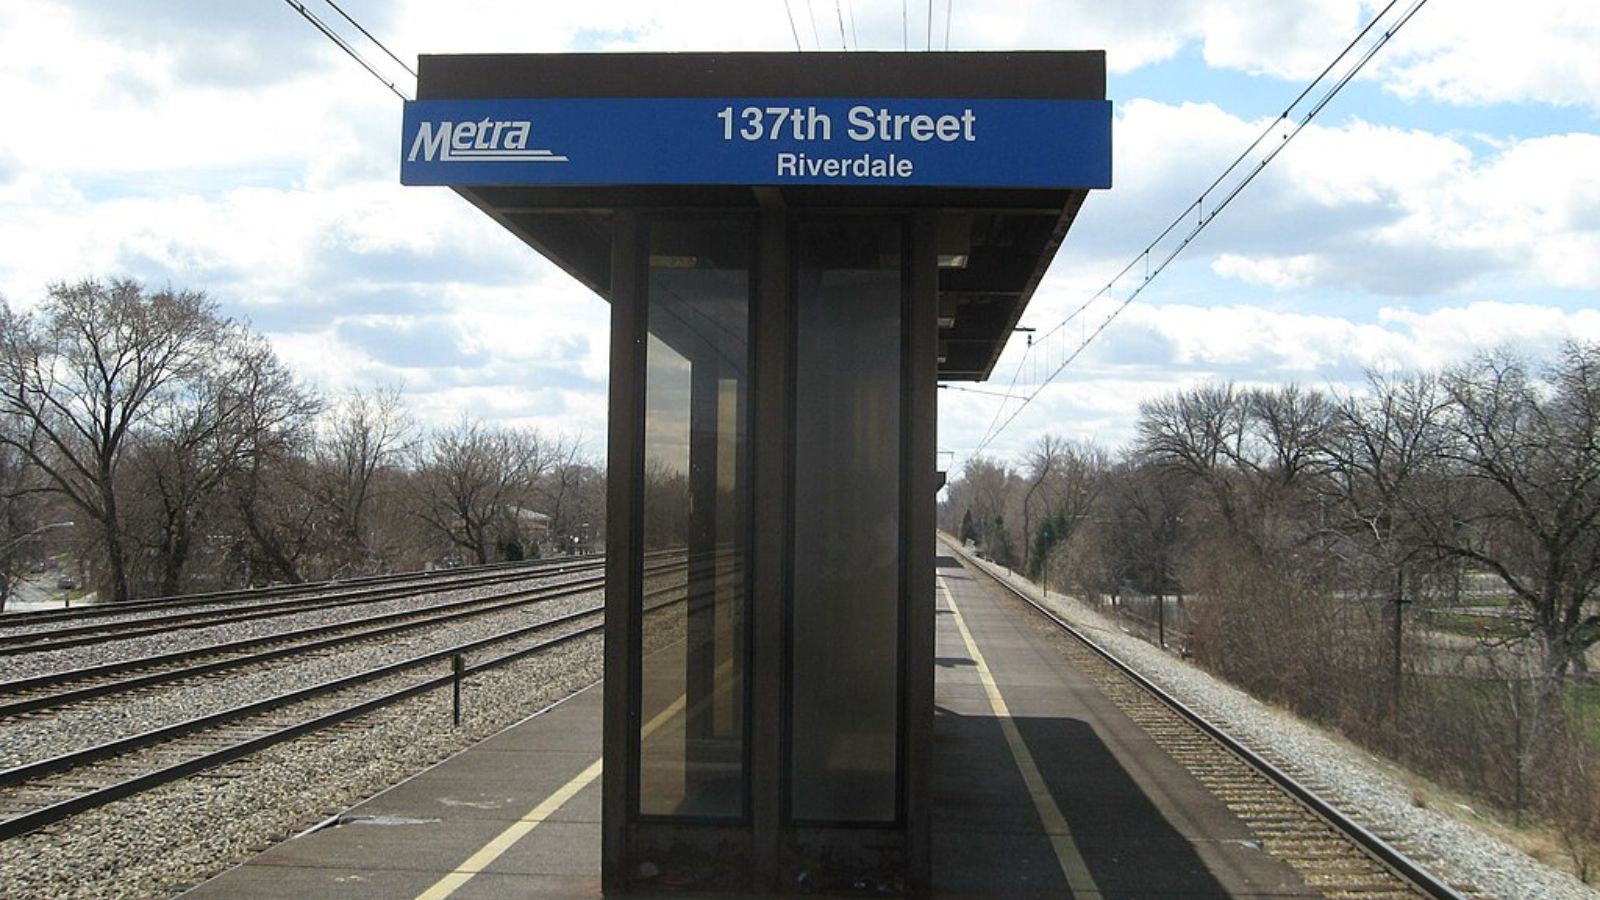
Riverdale, a small community in Cook County, has achieved the dubious distinction of sharing the highest crash risk score in our analysis at 95.00%. With a current median price of $114,856, the town has experienced a 130.4% price increase since 2010, creating an 85.5% overextension above long-term averages. This extreme overvaluation, combined with a history of three crashes including a catastrophic 28.6% decline in 2012, creates conditions that strongly suggest another major correction is imminent.
The community’s 19.0% annual price volatility indicates a market that lacks fundamental stability, where dramatic price swings are common. This instability, combined with the extreme overextension, creates a powder keg that could explode with minimal economic pressure. Riverdale’s pattern of repeated crashes and current bubble conditions make it the poster child for a market that has lost all connection to economic fundamentals, positioning it for a correction that could be more severe than any previous crash.
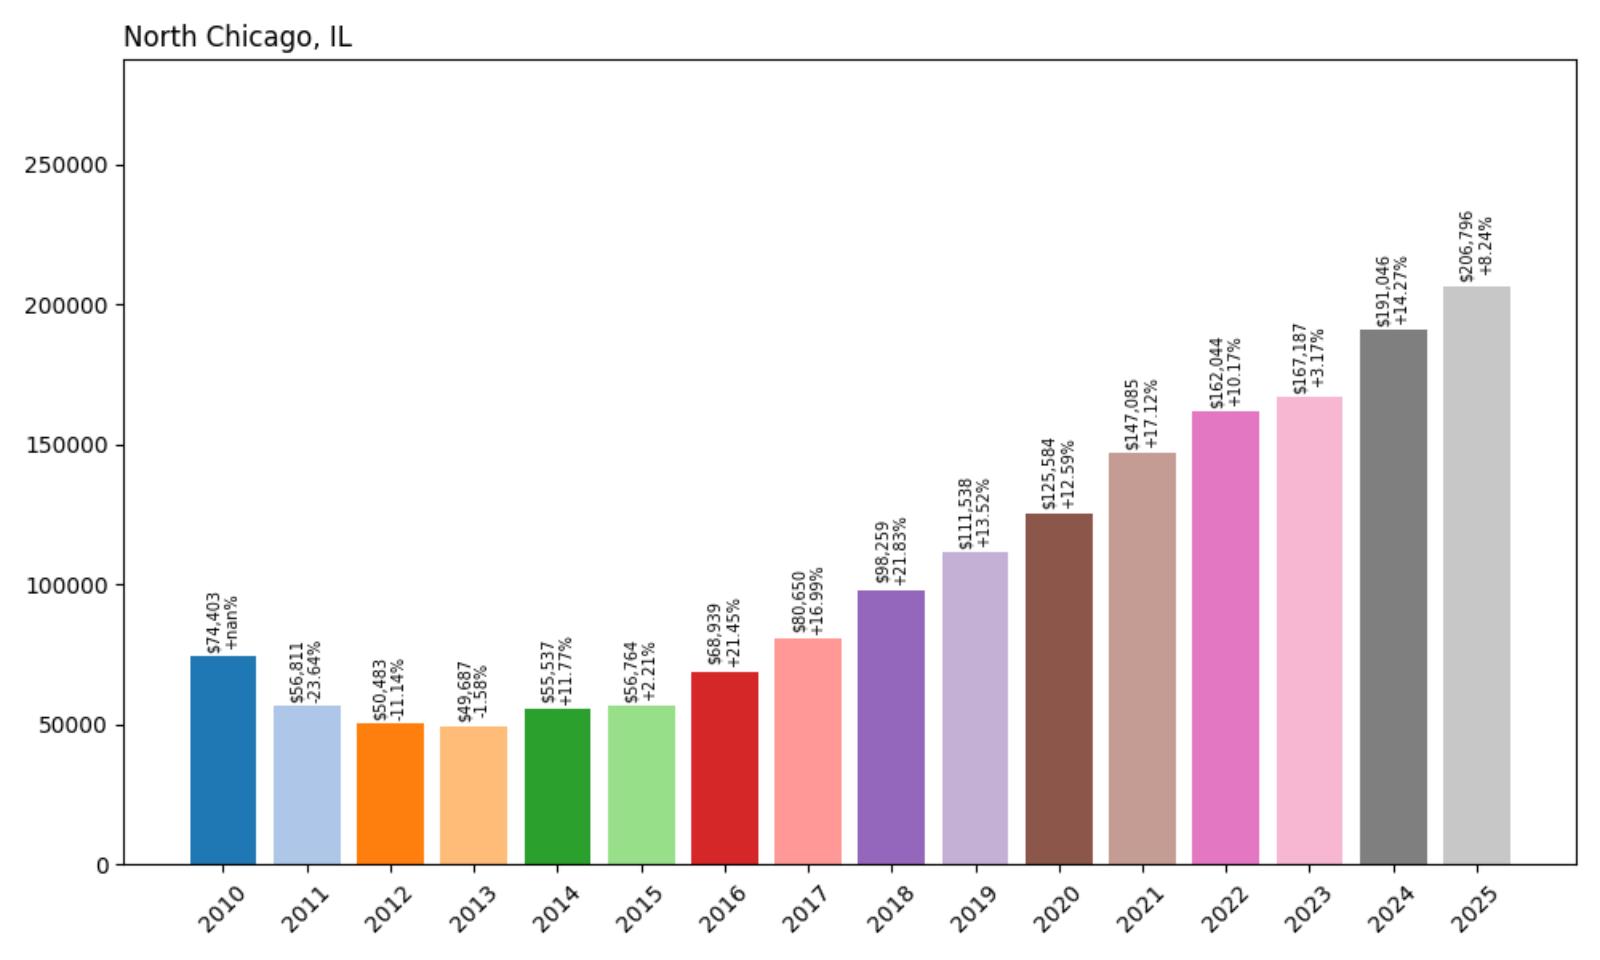
3. North Chicago – Crash Risk Percentage: 95.00%
- Crash Risk Percentage: 95.00%
- Historical crashes (8%+ drops): 2
- Worst historical crash: 23.6% (2011)
- Total price increase since 2010: 177.9%
- Overextended above long-term average: 94.3%
- Price volatility (annual swings): 12.4%
- Current 2025 price: $206,796
North Chicago reaches the maximum 95.00% crash risk score through extreme overextension that approaches double sustainable levels. The Lake County community has experienced a 177.9% price increase since 2010, creating a dangerous 94.3% overextension above long-term averages. With two historical crashes, including a 23.6% decline in 2011, North Chicago demonstrates both vulnerability to corrections and current bubble conditions.
North Chicago – Lake County Bubble Approaches Critical Mass
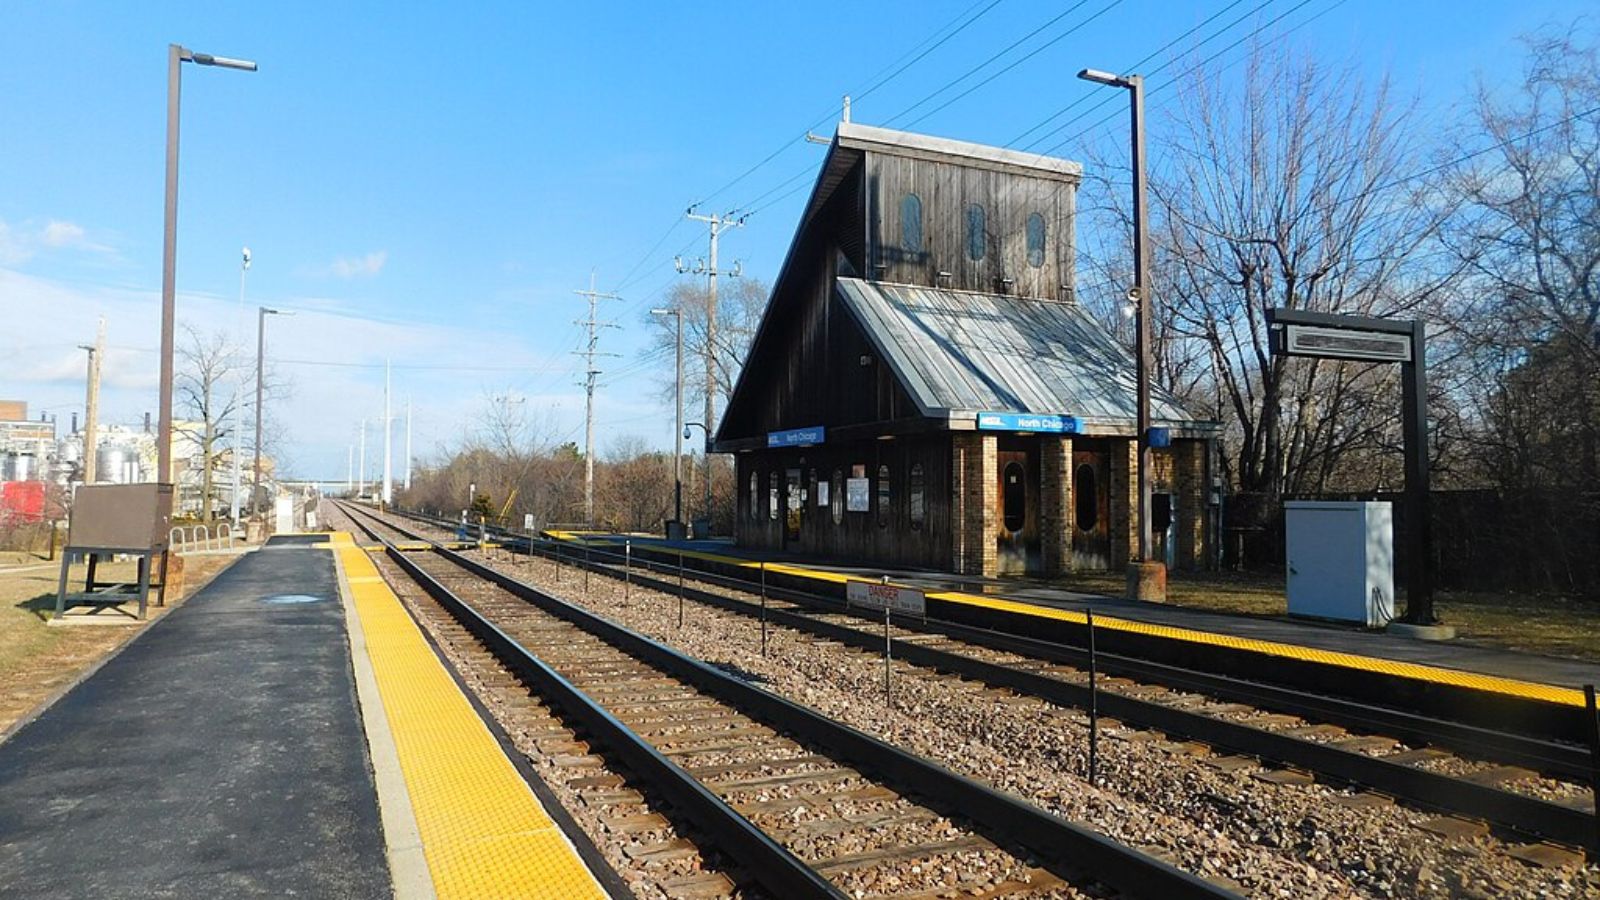
North Chicago, located in Lake County north of the Chicago metropolitan area, has experienced one of the most dramatic housing bubbles in Illinois. With a current median price of $206,796, the community has seen values increase 177.9% since 2010, pushing prices 94.3% above sustainable long-term levels. This lakefront community, historically known for its naval station and diverse population, now faces pricing that has completely disconnected from local economic realities.
The 23.6% crash in 2011 occurred when the market was far less overextended than current conditions, suggesting that another correction could be catastrophic. North Chicago’s location in Lake County, which has been identified as one of the most vulnerable housing markets in the Chicago area, amplifies the risk of a severe correction. With prices approaching double their sustainable levels, the community faces the prospect of a crash that could cut home values in half, returning them to more realistic levels aligned with local economic fundamentals.
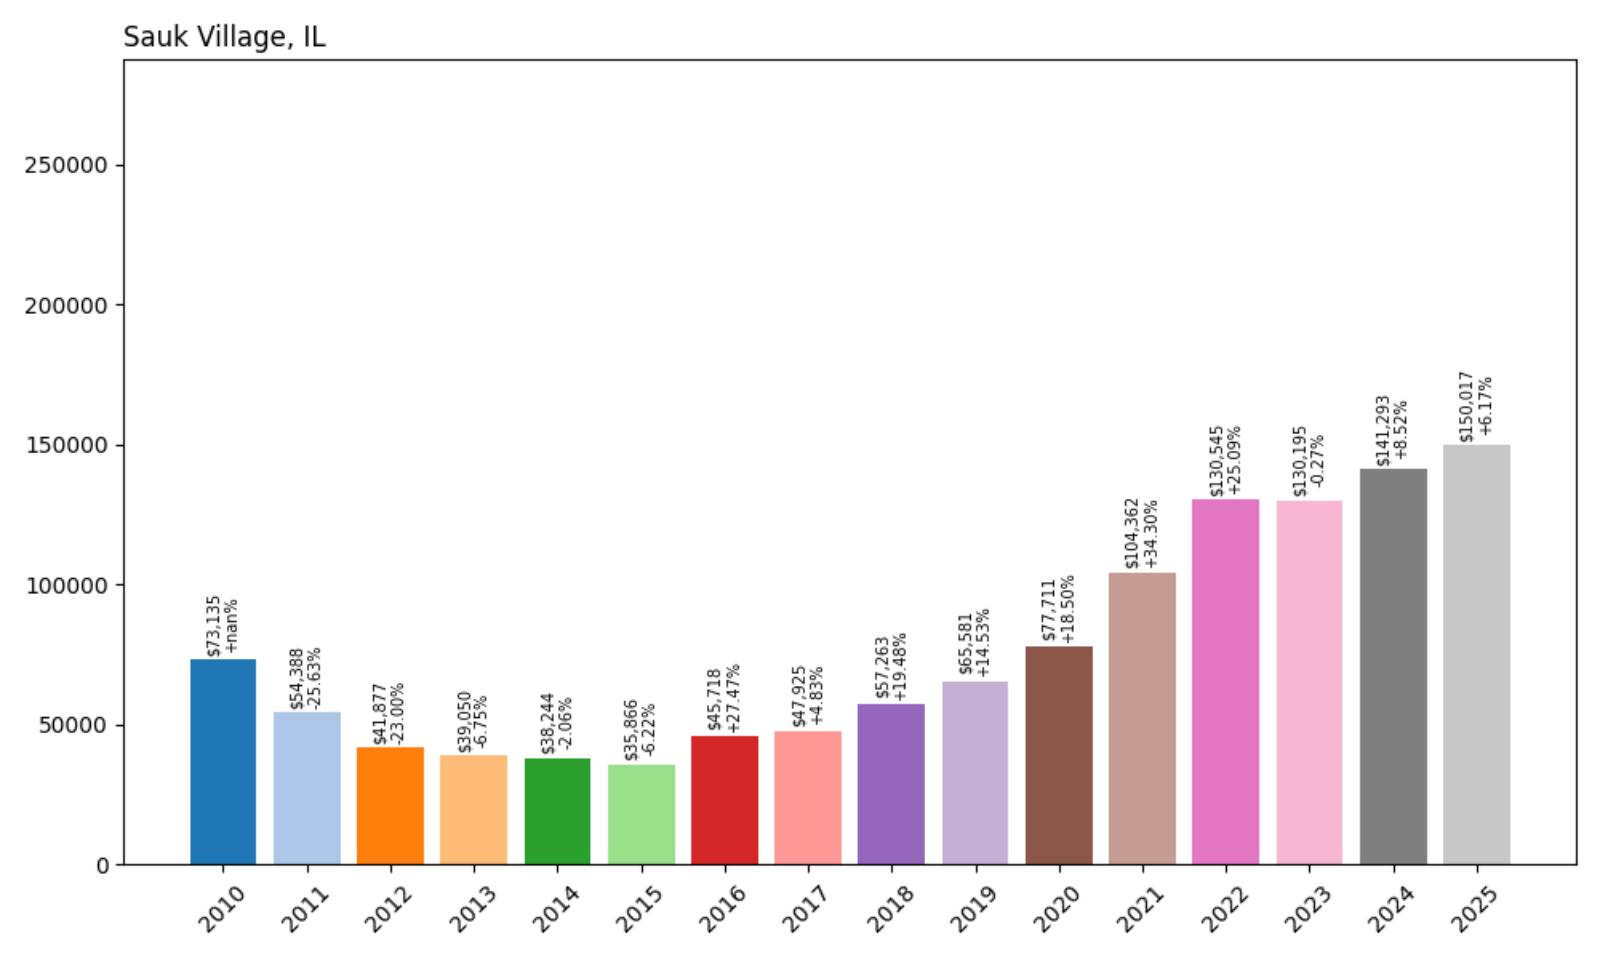
2. Sauk Village – Crash Risk Percentage: 95.00%
- Crash Risk Percentage: 95.00%
- Historical crashes (8%+ drops): 2
- Worst historical crash: 25.6% (2011)
- Total price increase since 2010: 105.1%
- Overextended above long-term average: 94.6%
- Price volatility (annual swings): 17.5%
- Current 2025 price: $150,017
Sauk Village achieves a maximum 95.00% crash risk score through extreme overextension and high volatility. The south suburban community has doubled in value since 2010, creating a 94.6% overextension above long-term averages. Combined with two historical crashes, including a severe 25.6% decline in 2011, Sauk Village exhibits all the characteristics of a market primed for a major correction.
Sauk Village – Doubled Values Signal Unsustainable Growth
Sauk Village, a south suburban community straddling Cook and Will counties, has experienced a housing bubble that has pushed values to nearly double their sustainable levels. With a current median price of $150,017, the town has seen a 105.1% price increase since 2010, creating a 94.6% overextension above long-term averages. This working-class community, historically known for affordable housing options for Chicago-area workers, now faces pricing levels that have completely disconnected from local economic conditions.
The 25.6% crash in 2011 demonstrates the community’s vulnerability to market corrections, and that decline occurred when overextension was far less severe than current conditions. Sauk Village’s high volatility of 17.5% indicates a market prone to dramatic swings, making it particularly susceptible to rapid corrections when economic pressures mount. The combination of extreme overextension and historical crash patterns creates conditions where another major correction appears mathematically inevitable, potentially matching or exceeding the severity of the 2011 crash.
1. Robbins – Crash Risk Percentage: 95.00%
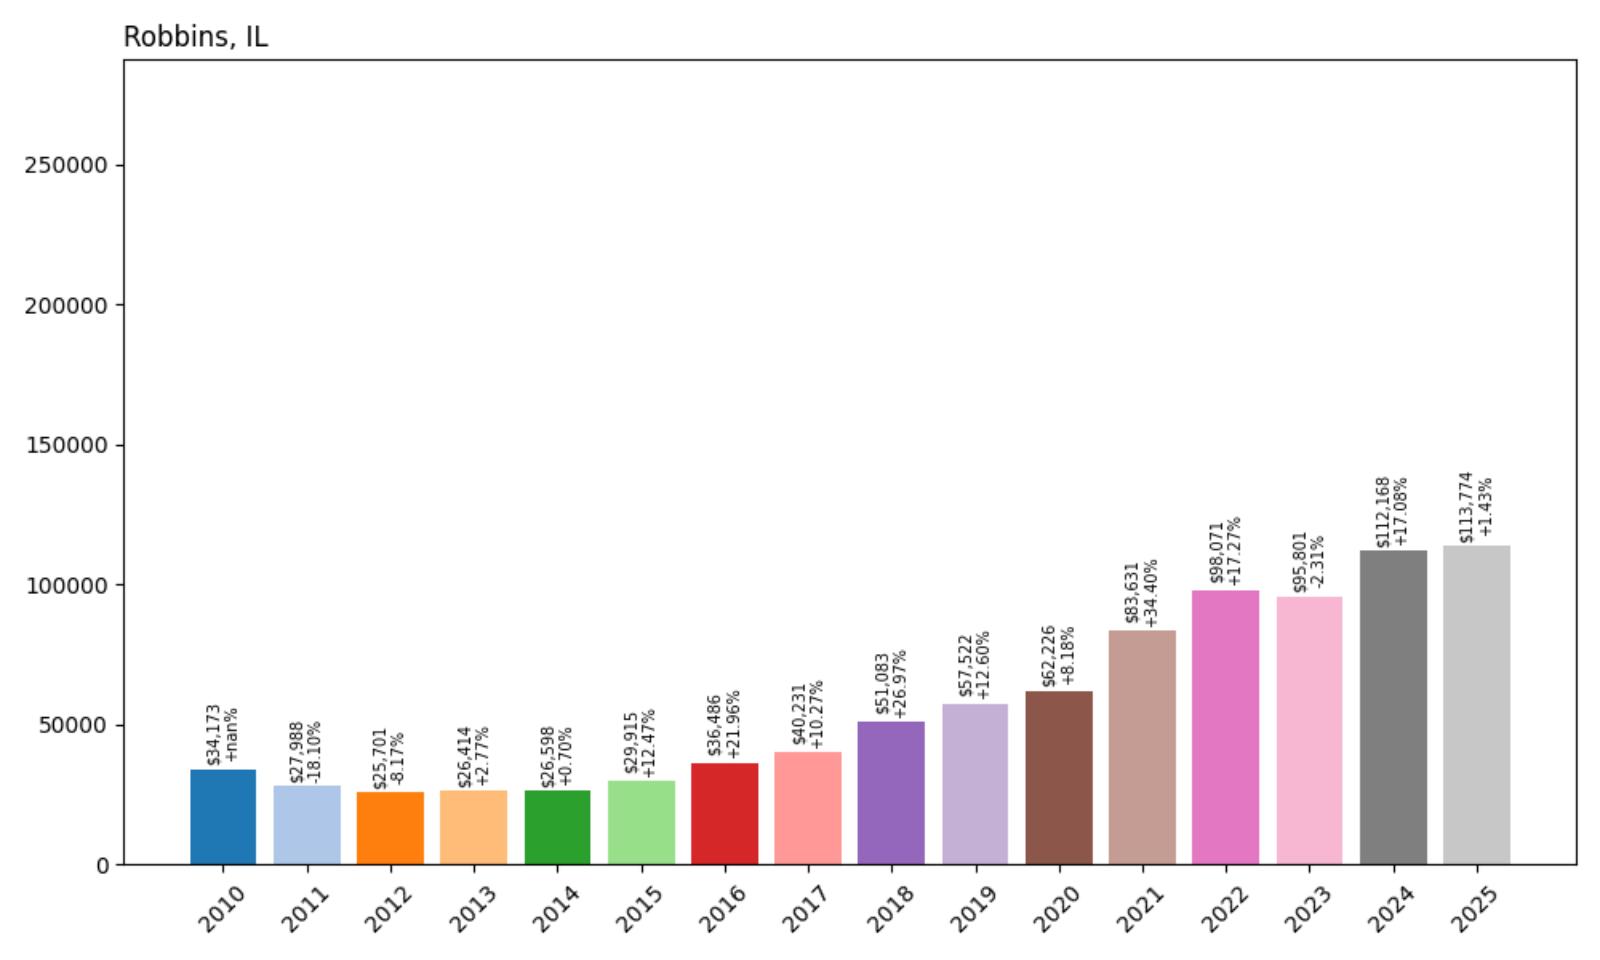
- Crash Risk Percentage: 95.00%
- Historical crashes (8%+ drops): 2
- Worst historical crash: 18.1% (2011)
- Total price increase since 2010: 232.9%
- Overextended above long-term average: 97.5%
- Price volatility (annual swings): 13.7%
- Current 2025 price: $113,774
Robbins tops our list with a maximum 95.00% crash risk score driven by the most extreme overextension in our analysis. The Cook County community has experienced a staggering 232.9% price increase since 2010, creating a 97.5% overextension above long-term averages. This represents prices that are nearly double sustainable levels, making Robbins the most mathematically unsustainable housing market in Illinois.
Robbins – Triple-Digit Price Surge Creates Ultimate Crash Risk

Robbins, a small community in Cook County, has achieved the most extreme housing bubble conditions in our analysis, with values increasing an unprecedented 232.9% since 2010. This tiny south suburban town, with a current median price of $113,774, now trades at nearly double its sustainable long-term price level, creating a 97.5% overextension that defies economic logic. Such extreme overvaluation in a community with limited economic drivers makes a severe correction appear mathematically inevitable.
The community’s modest 18.1% crash in 2011 occurred when the market was far less overextended than current conditions, suggesting that another correction could be catastrophic. Robbins faces the unique challenge of having the most overextended housing market while operating within Cook County’s challenging economic environment of population decline, high taxes, and limited job growth. The combination of extreme overextension and regional economic headwinds creates conditions where a crash could cut home values in half or more, potentially making Robbins the epicenter of Illinois’s next housing market correction.