
Iowa remains one of the most affordable states for homebuyers in 2025 — but some towns stand out even more than others for their remarkably low housing costs. Using data from the Zillow Home Value Index, we’ve ranked 19 communities across the state where home prices are still within reach, even as national trends push values higher elsewhere.
These towns are ranked from #19 (least affordable on this list) down to #1 (the most affordable). Many of them have seen modest price growth, while others have even dipped slightly — offering unique opportunities for buyers, retirees, or anyone seeking a budget-friendly place to live. Each listing includes full historical price data from 2010 to 2025 (when available) and a deeper look at what makes these towns tick, from location and amenities to surprising value trends.
Whether you’re house hunting or just curious where your money stretches furthest, this roundup highlights some of the best bargains in Iowa real estate right now.
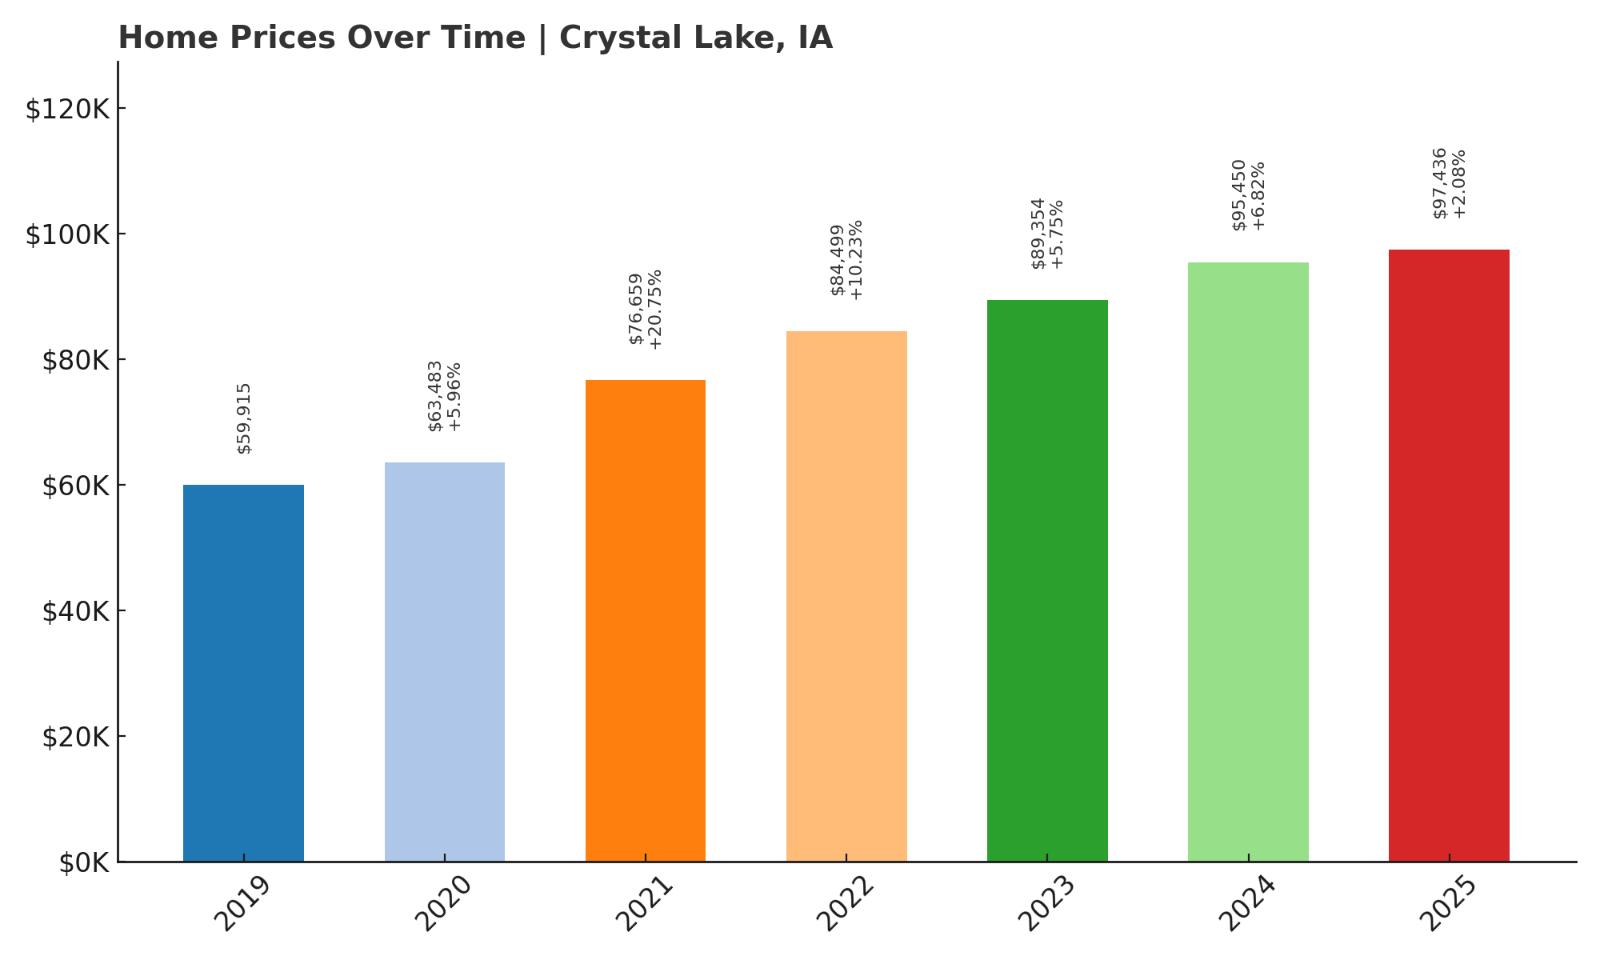
19. Crystal Lake – 62.7% Home Price Increase Since 2019
- 2010: N/A
- 2011: N/A
- 2012: N/A
- 2013: N/A
- 2014: N/A
- 2015: N/A
- 2016: N/A
- 2017: N/A
- 2018: N/A
- 2019: $59,915.27
- 2020: $63,483.34 (+$3,568.07, +5.96% from previous year)
- 2021: $76,659.12 (+$13,175.78, +20.75% from previous year)
- 2022: $84,499.79 (+$7,840.67, +10.23% from previous year)
- 2023: $89,354.85 (+$4,855.06, +5.75% from previous year)
- 2024: $95,450.05 (+$6,095.20, +6.82% from previous year)
- 2025: $97,436.26 (+$1,986.21, +2.08% from previous year)
Crystal Lake’s home prices have risen over 62% since 2019, but it remains one of Iowa’s most affordable places to live in 2025. The town saw consistent appreciation through the pandemic years, with especially strong growth between 2020 and 2022. More recently, the pace has slowed, indicating the market may be stabilizing.
Crystal Lake – Quiet Living in Northern Iowa
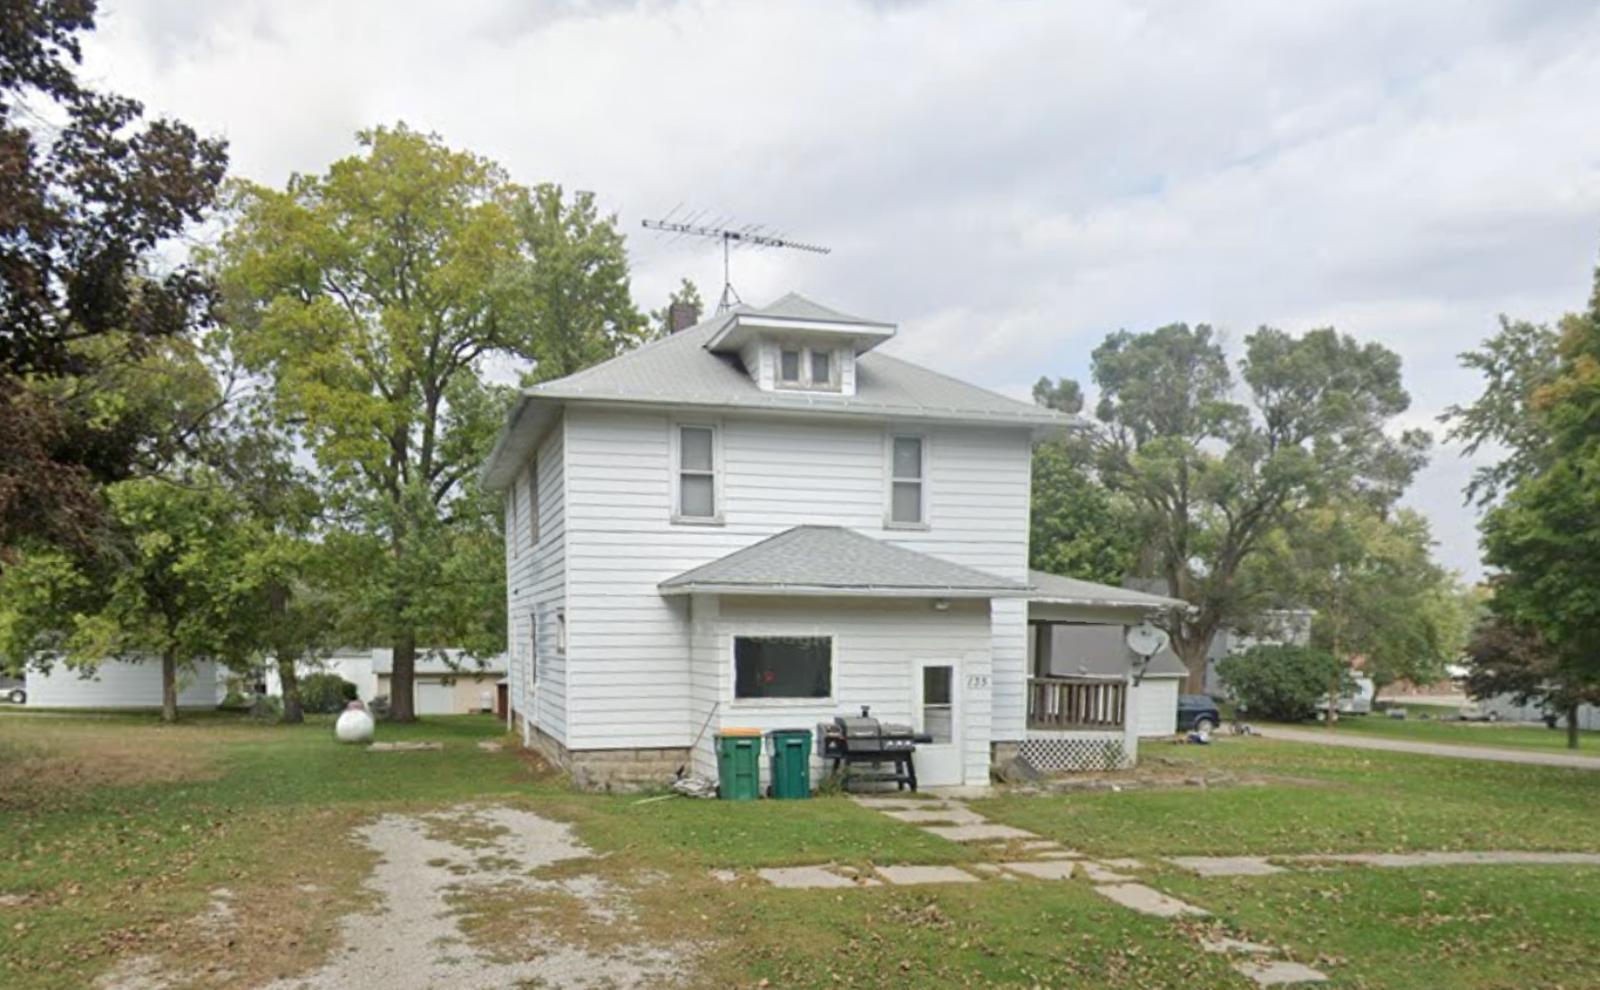
Located in Hancock County near the Minnesota border, Crystal Lake is a small community with a rural charm that appeals to those seeking peace and affordability. With a population of just over 250, the town is named after the nearby natural lake, offering outdoor recreation like boating and fishing. Home values here are still below $100,000, making it ideal for first-time buyers or retirees on a tight budget. The surrounding region relies on agriculture, and there are basic services and schools within a short drive. Price growth has been steady rather than volatile, and the low base means the town is still an outlier for value in the state.
While the price curve has flattened recently, the cumulative increase since 2019 suggests rising interest in rural affordability. The town’s proximity to Mason City and the I-35 corridor gives residents access to broader employment and services while still benefiting from small-town prices. That combination helps explain why Crystal Lake, even with growth, remains on this list of Iowa’s cheapest towns.
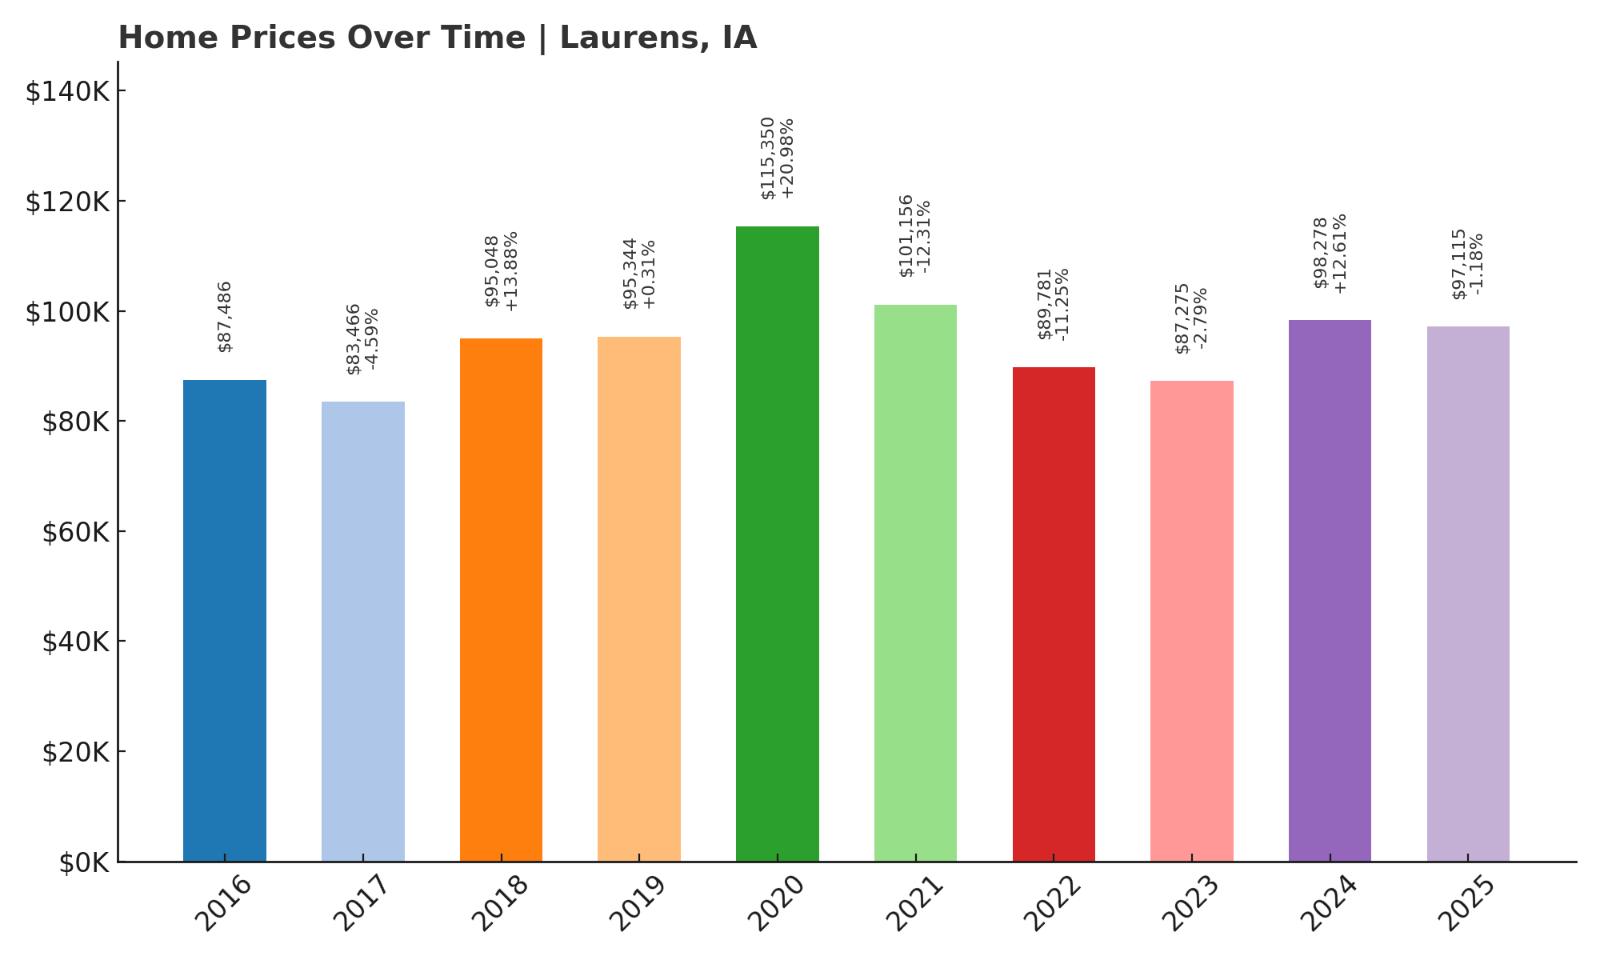
18. Laurens – 11% Home Price Increase Since 2016
- 2010: N/A
- 2011: N/A
- 2012: N/A
- 2013: N/A
- 2014: N/A
- 2015: N/A
- 2016: $87,486.27
- 2017: $83,466.66 (-$4,019.61, -4.59% from previous year)
- 2018: $95,048.03 (+$11,581.38, +13.88% from previous year)
- 2019: $95,344.37 (+$296.33, +0.31% from previous year)
- 2020: $115,350.88 (+$20,006.51, +20.98% from previous year)
- 2021: $101,156.72 (-$14,194.16, -12.31% from previous year)
- 2022: $89,781.08 (-$11,375.64, -11.25% from previous year)
- 2023: $87,275.98 (-$2,505.10, -2.79% from previous year)
- 2024: $98,278.36 (+$11,002.38, +12.61% from previous year)
- 2025: $97,115.42 (-$1,162.93, -1.18% from previous year)
Laurens’ home price trends are a rollercoaster, with spikes in 2020 followed by corrections. Despite some volatility, current prices are only about 11% higher than they were in 2016. It’s a town where price drops haven’t led to panic but rather opened new opportunities for affordable entry.
Laurens – A Resilient Market With Room to Grow
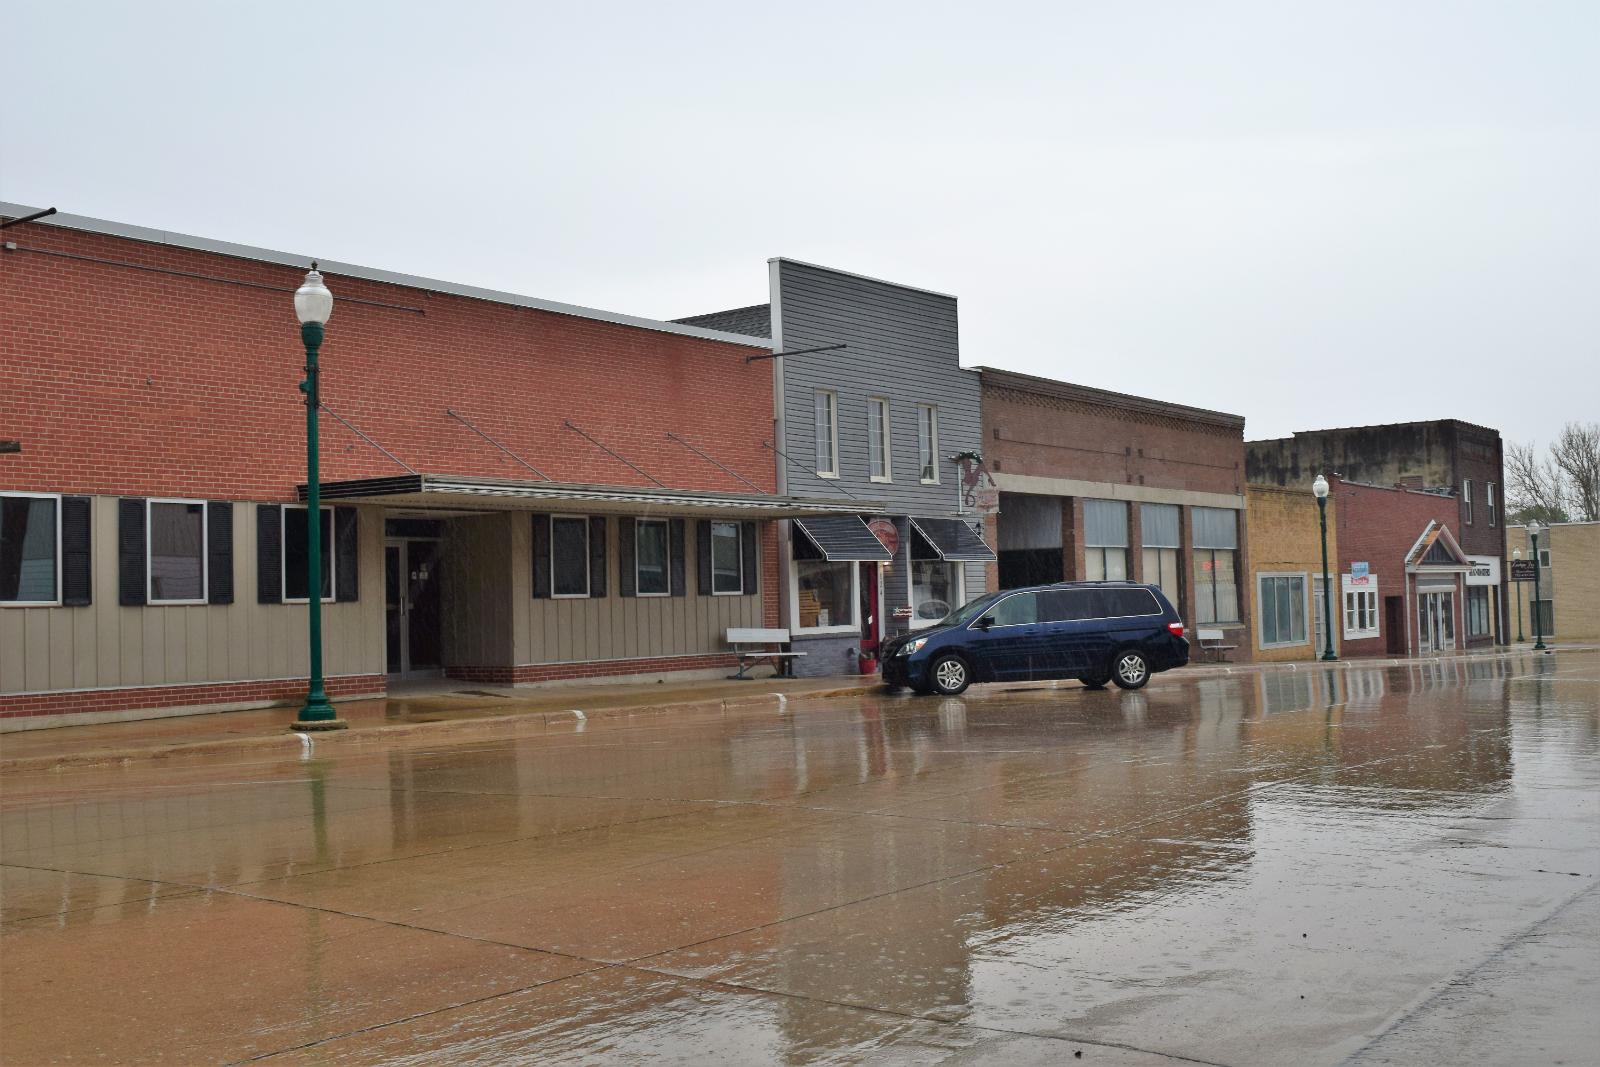
Set in Pocahontas County, Laurens is a quiet community that blends affordability with small-town Midwestern values. Home prices peaked during the post-2020 housing surge but have since corrected downward, offering current buyers better deals. The town has essential services, a public library, and a strong school district — all signs of a stable civic core. Its location near Highway 10 makes it easy to access larger hubs like Fort Dodge or Storm Lake.
The post-peak adjustment from 2021 to 2023 may reflect overvaluation during the national housing boom, but Laurens has since bounced back. Its year-over-year figures in 2024 and 2025 show some market normalization. For buyers, it’s an opportunity to step into a market that has calmed without collapsing — and where average home values hover just under $100,000.
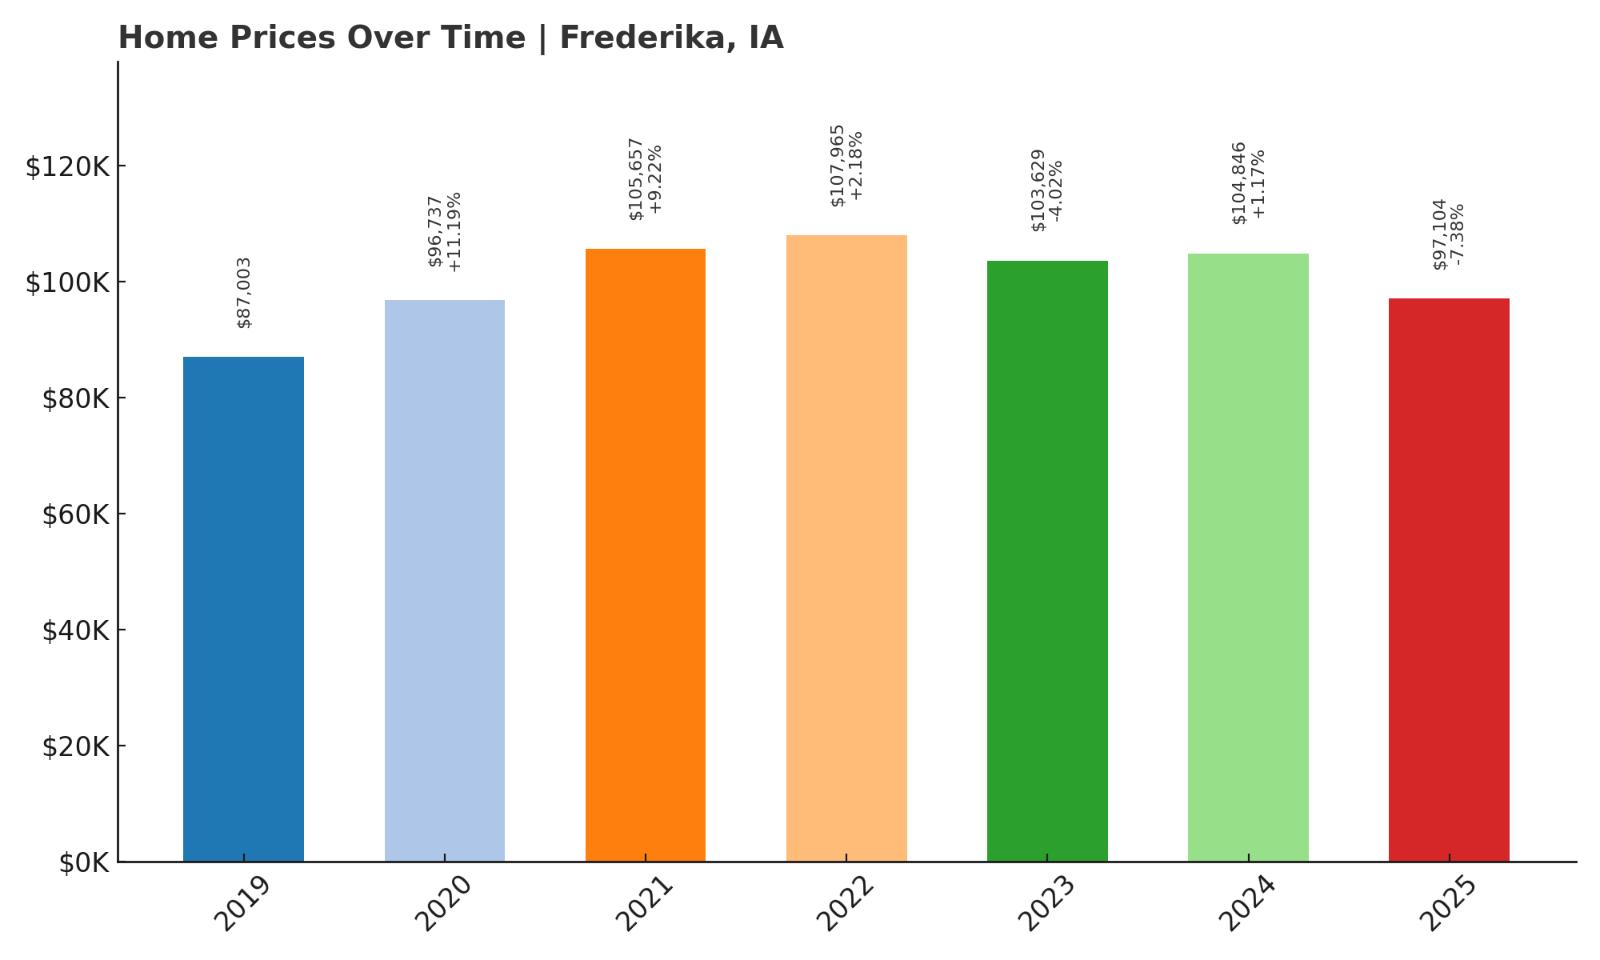
17. Frederika – 11.9% Home Price Increase Since 2019
- 2010: N/A
- 2011: N/A
- 2012: N/A
- 2013: N/A
- 2014: N/A
- 2015: N/A
- 2016: N/A
- 2017: N/A
- 2018: N/A
- 2019: $87,003.71
- 2020: $96,737.27 (+$9,733.56, +11.19% from previous year)
- 2021: $105,657.31 (+$8,920.03, +9.22% from previous year)
- 2022: $107,965.34 (+$2,308.04, +2.18% from previous year)
- 2023: $103,629.34 (-$4,336.00, -4.02% from previous year)
- 2024: $104,846.48 (+$1,217.14, +1.17% from previous year)
- 2025: $97,104.04 (-$7,742.44, -7.38% from previous year)
Frederika has had a bumpy price ride since 2019, rising during the pandemic years before sliding back. Overall, home values are up nearly 12% from six years ago — not explosive, but still noteworthy in a cooling market. It’s now a quieter, more stable space for buyers.
Frederika – Small-Town Living With Price Adjustments
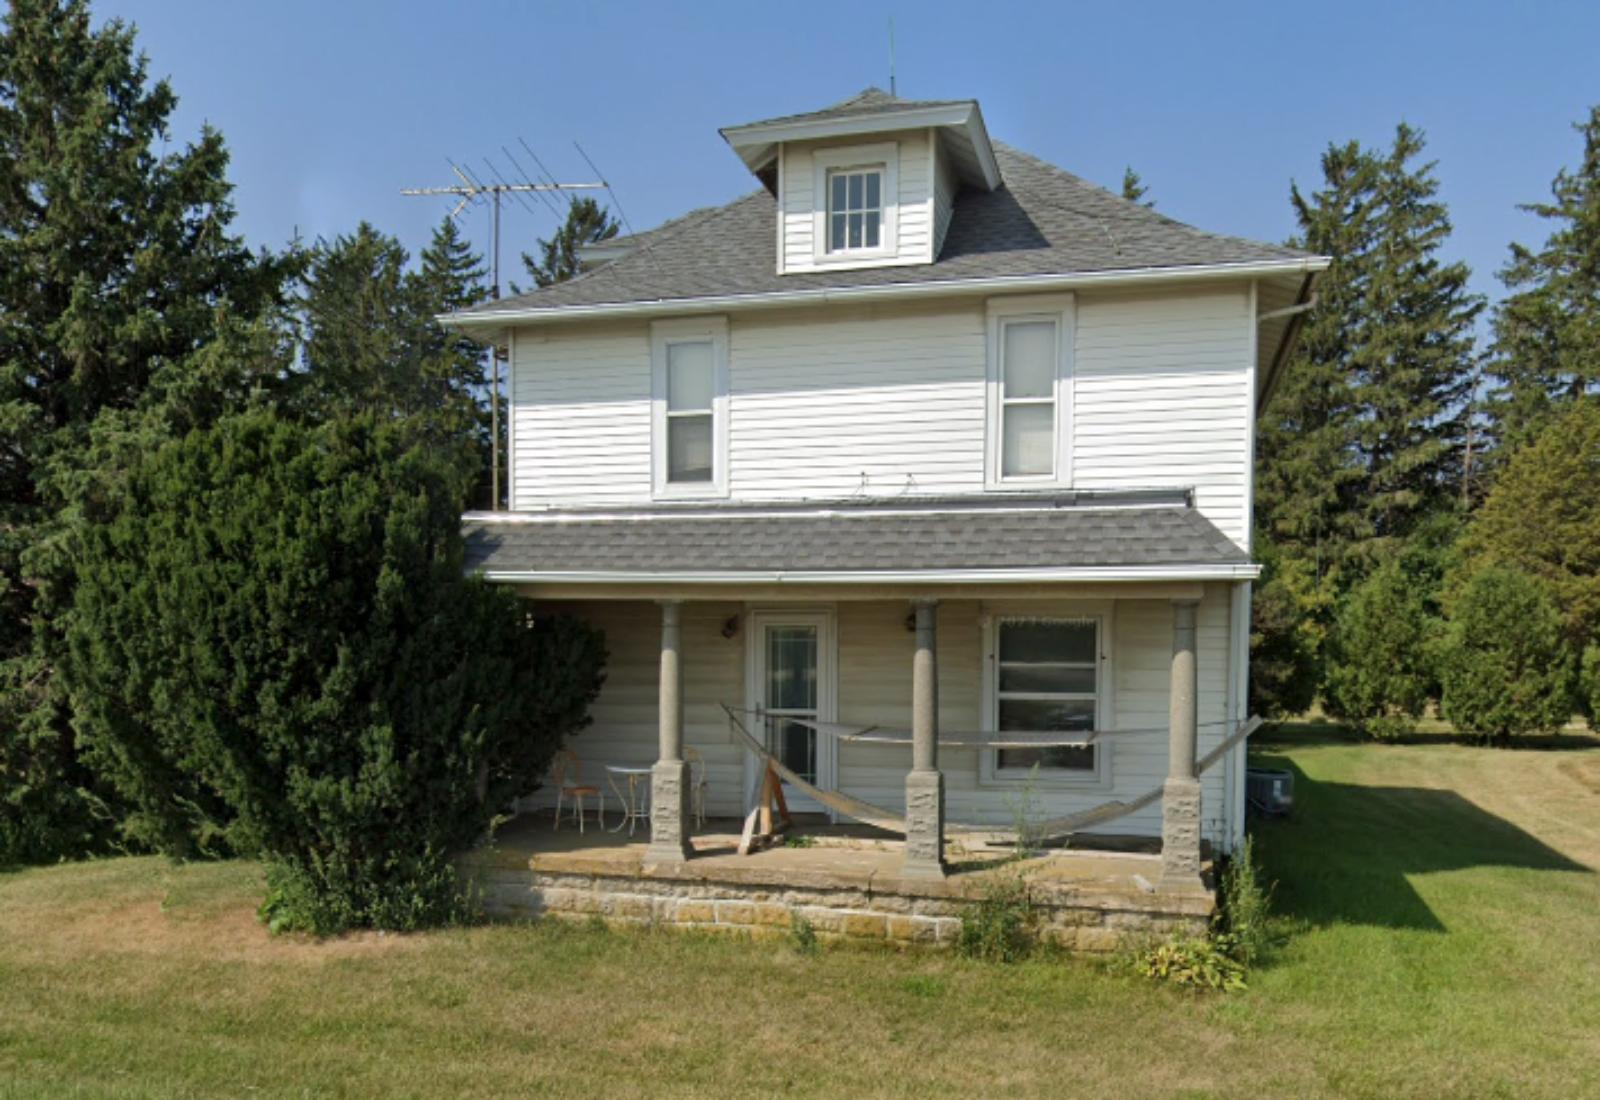
Frederika is a compact town in Bremer County with fewer than 200 residents. Its affordability is one of its biggest draws. Despite a brief boom in 2021, Frederika has seen three consecutive years of softening home prices. This aligns with national trends for rural towns that surged during the remote work wave but have since returned to earth. Still, prices remain below $100,000 — low by any standard.
The town’s position near the Wapsipinicon River offers some appeal to outdoor enthusiasts. Basic amenities are limited, so residents typically travel to Waverly or Waterloo for shopping and healthcare. The market here reflects low demand but also low volatility long-term, making Frederika a budget-friendly option that has cooled off — potentially making it more attractive to those looking to buy without the pressure of aggressive bidding wars.
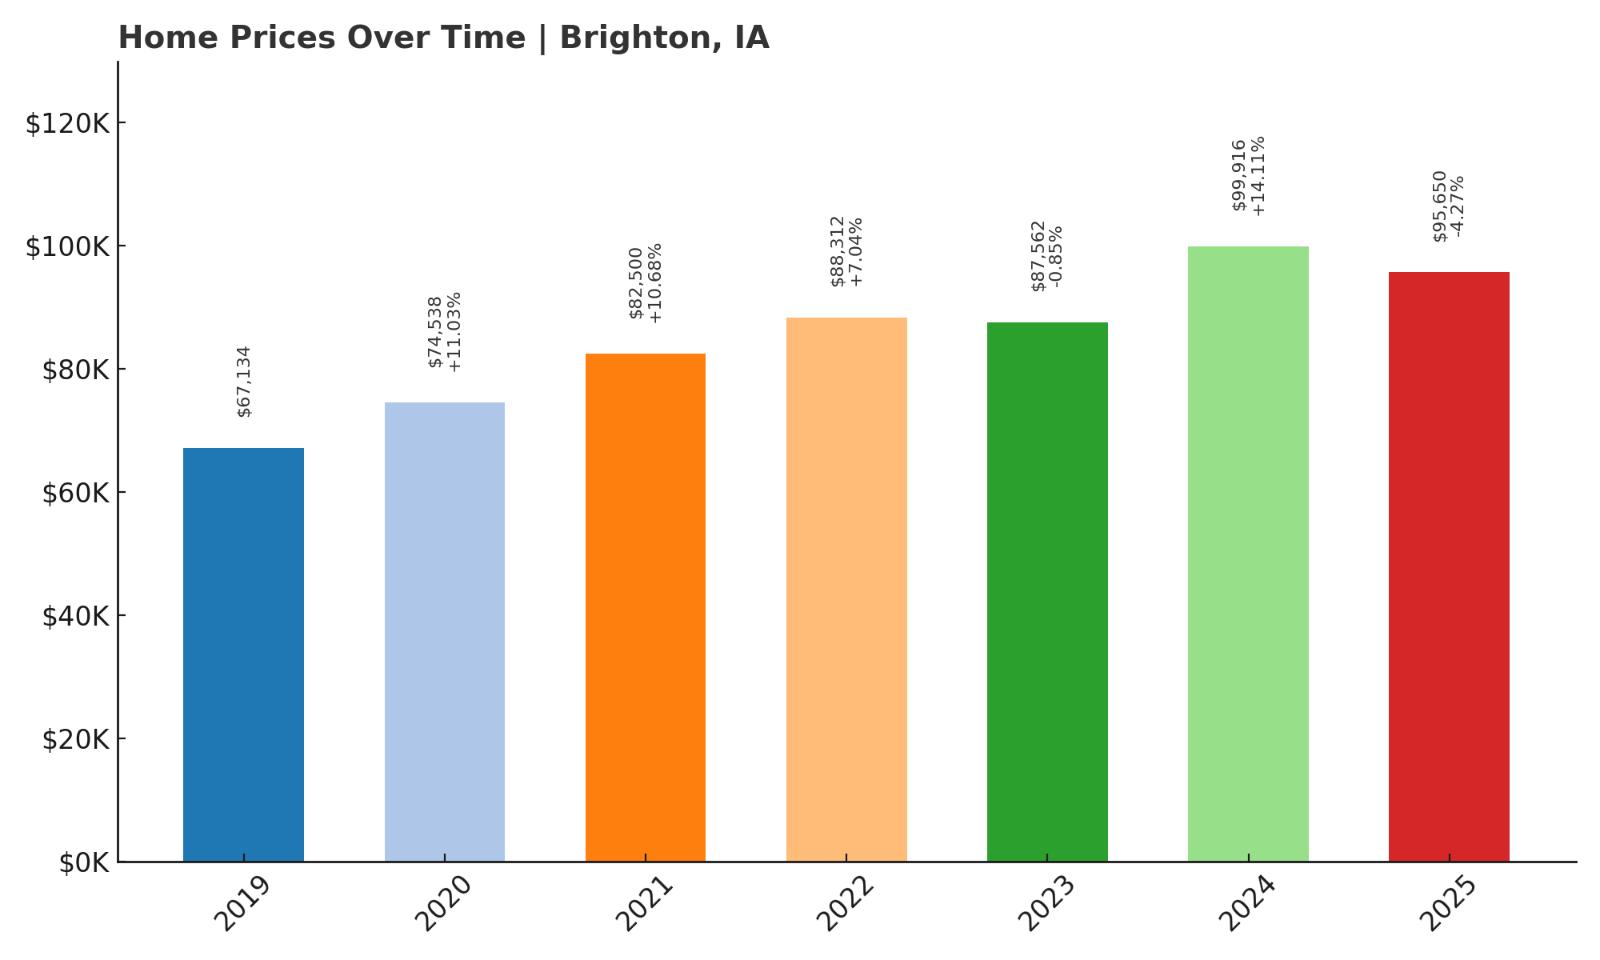
16. Brighton – 42.4% Home Price Increase Since 2019
- 2010: N/A
- 2011: N/A
- 2012: N/A
- 2013: N/A
- 2014: N/A
- 2015: N/A
- 2016: N/A
- 2017: N/A
- 2018: N/A
- 2019: $67,134.73
- 2020: $74,538.47 (+$7,403.74, +11.03% from previous year)
- 2021: $82,500.35 (+$7,961.88, +10.68% from previous year)
- 2022: $88,312.07 (+$5,811.72, +7.04% from previous year)
- 2023: $87,562.37 (-$749.70, -0.85% from previous year)
- 2024: $99,916.81 (+$12,354.44, +14.11% from previous year)
- 2025: $95,650.67 (-$4,266.14, -4.27% from previous year)
Brighton’s home prices have jumped more than 42% since 2019, though recent fluctuations suggest a maturing market. After strong gains through 2022, a dip in 2025 reflects a possible peak. Still, it’s an area where growth has clearly outpaced many peers.
Brighton – Quiet Growth in Southeast Iowa
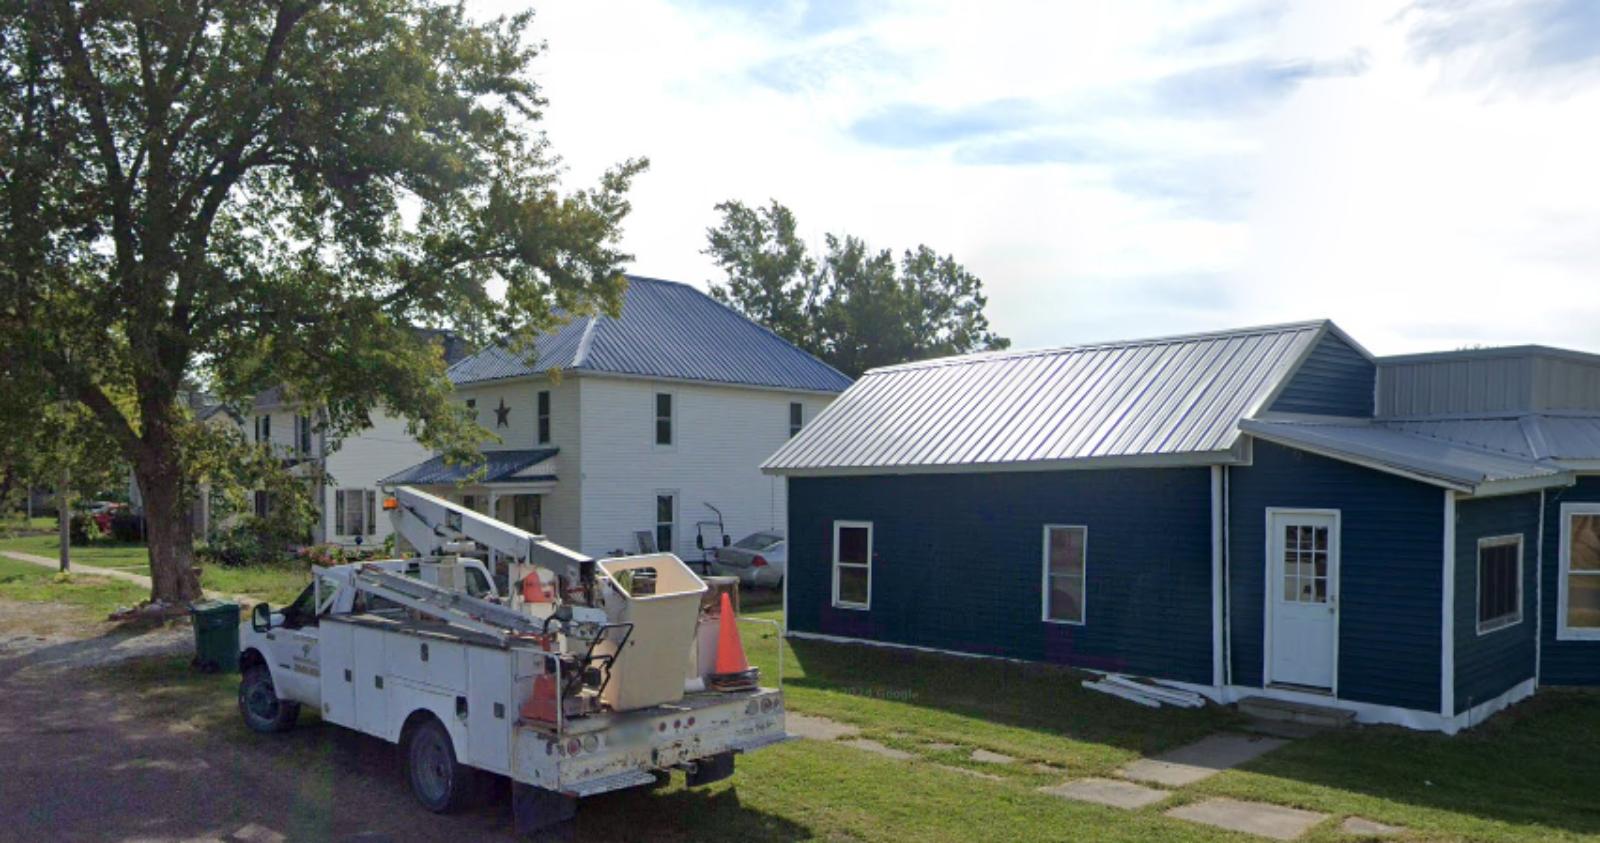
Situated in Washington County, Brighton offers a rural lifestyle just west of the city of Washington. The area features wide open landscapes and a family-friendly vibe. Though it’s small, Brighton isn’t isolated — and its proximity to larger markets like Iowa City keeps it connected. The local housing stock is affordable, and the mid-$90K average price in 2025 is still highly competitive compared to other parts of the state.
The spike in home prices during 2023–2024 may have been driven by increasing interest from commuters or investors seeking value outside metro areas. While prices have dipped slightly from their 2024 peak, Brighton remains attractive for its low cost of entry and access to employment corridors. For those seeking budget homes in southeast Iowa, Brighton stands out for its combination of growth and value.
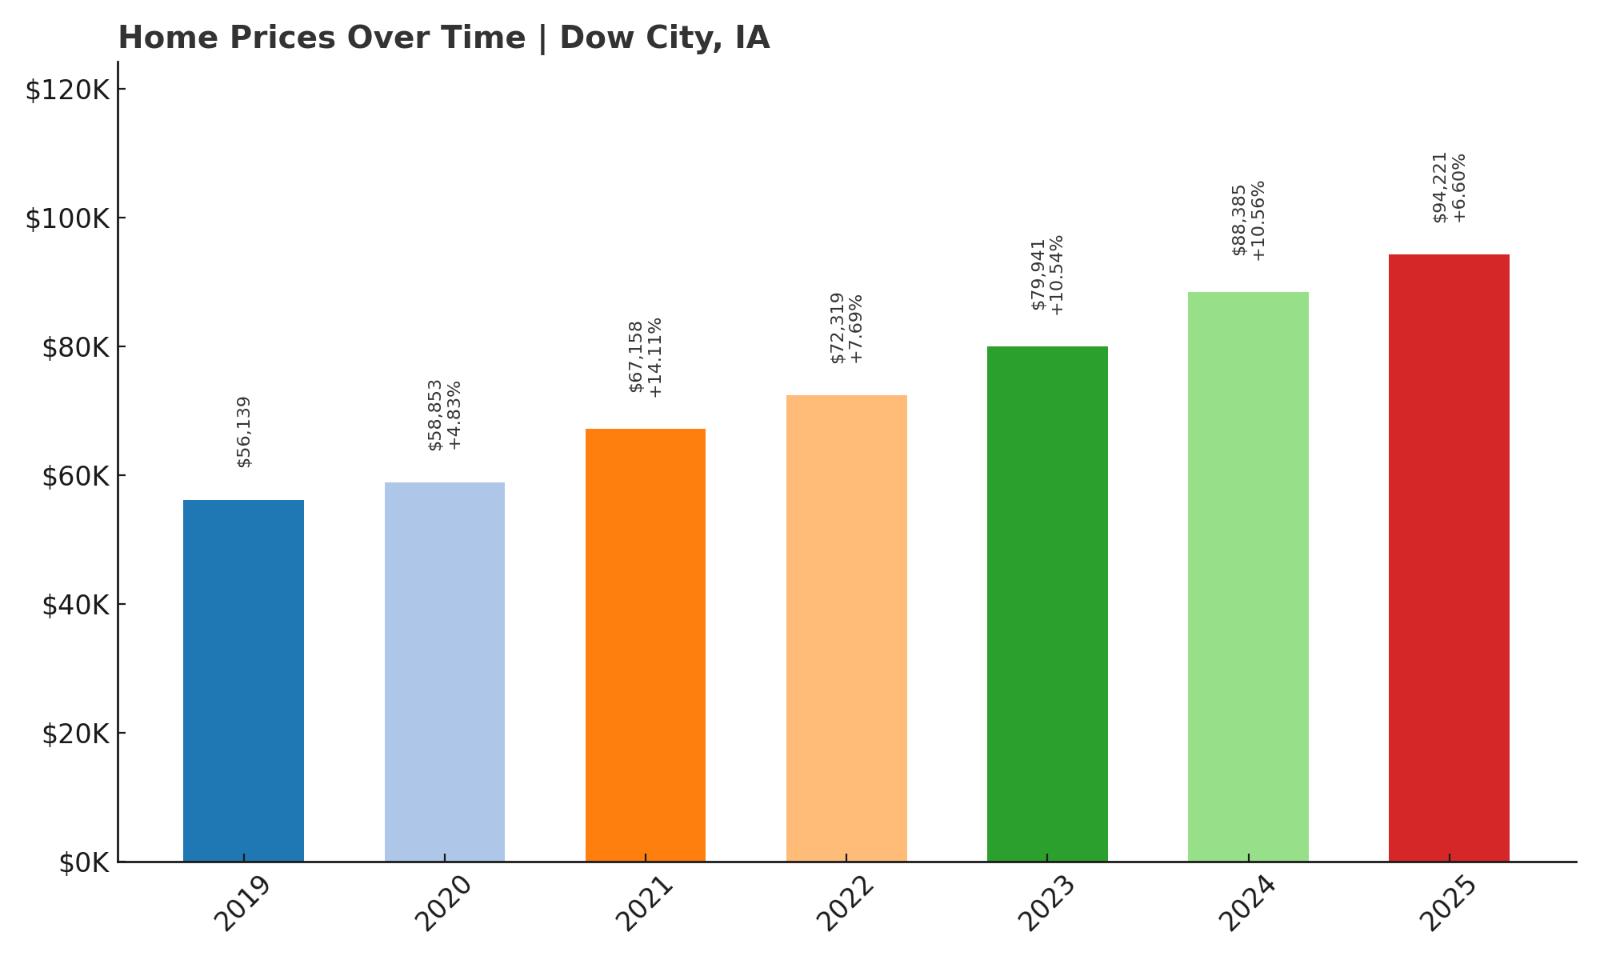
15. Dow City – 67.8% Home Price Increase Since 2019
- 2010: N/A
- 2011: N/A
- 2012: N/A
- 2013: N/A
- 2014: N/A
- 2015: N/A
- 2016: N/A
- 2017: N/A
- 2018: N/A
- 2019: $56,139.26
- 2020: $58,853.53 (+$2,714.27, +4.83% from previous year)
- 2021: $67,158.61 (+$8,305.09, +14.11% from previous year)
- 2022: $72,319.92 (+$5,161.30, +7.69% from previous year)
- 2023: $79,941.81 (+$7,621.89, +10.54% from previous year)
- 2024: $88,385.27 (+$8,443.45, +10.56% from previous year)
- 2025: $94,221.67 (+$5,836.40, +6.60% from previous year)
Dow City has experienced one of the strongest surges in home values on this list, with prices increasing nearly 68% since 2019. Growth has been remarkably steady, with no major dips over the six-year stretch. This trend suggests an area where affordability is being slowly re-evaluated by buyers.
Dow City – Steady Gains in Western Iowa
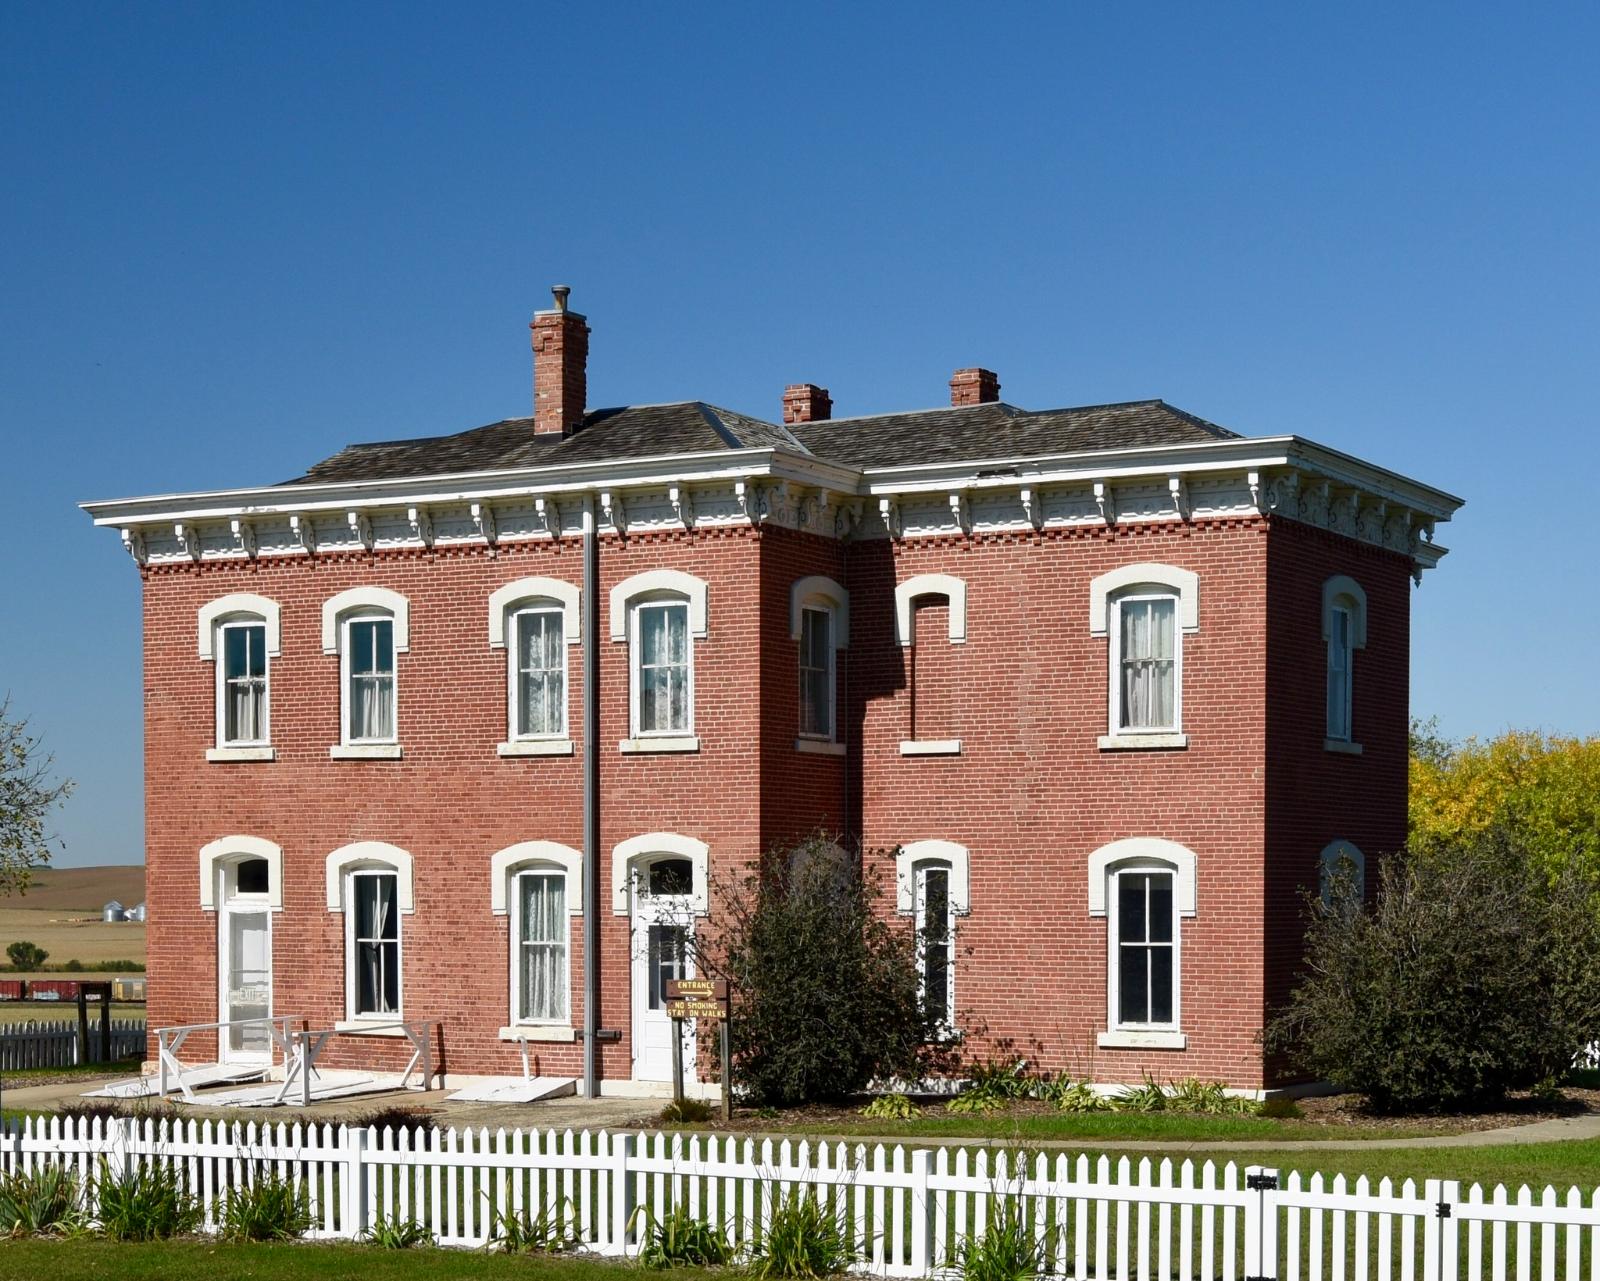
Nestled in Crawford County near the Boyer River, Dow City is a classic example of rural Iowa value meeting gradual market momentum. While its population remains small, the town has benefited from regional interest and consistent buyer activity. The average home price of just over $94,000 in 2025 reflects a strong run-up from pre-pandemic levels — yet still offers a bargain compared to most of the state.
Dow City may be drawing attention thanks to its location on U.S. Route 30, providing direct access to Denison and the surrounding agricultural corridor. The absence of price volatility indicates a relatively healthy local economy without speculative spikes. For homebuyers, it presents a rare mix of long-term affordability and reliable appreciation — something few other markets can offer right now.
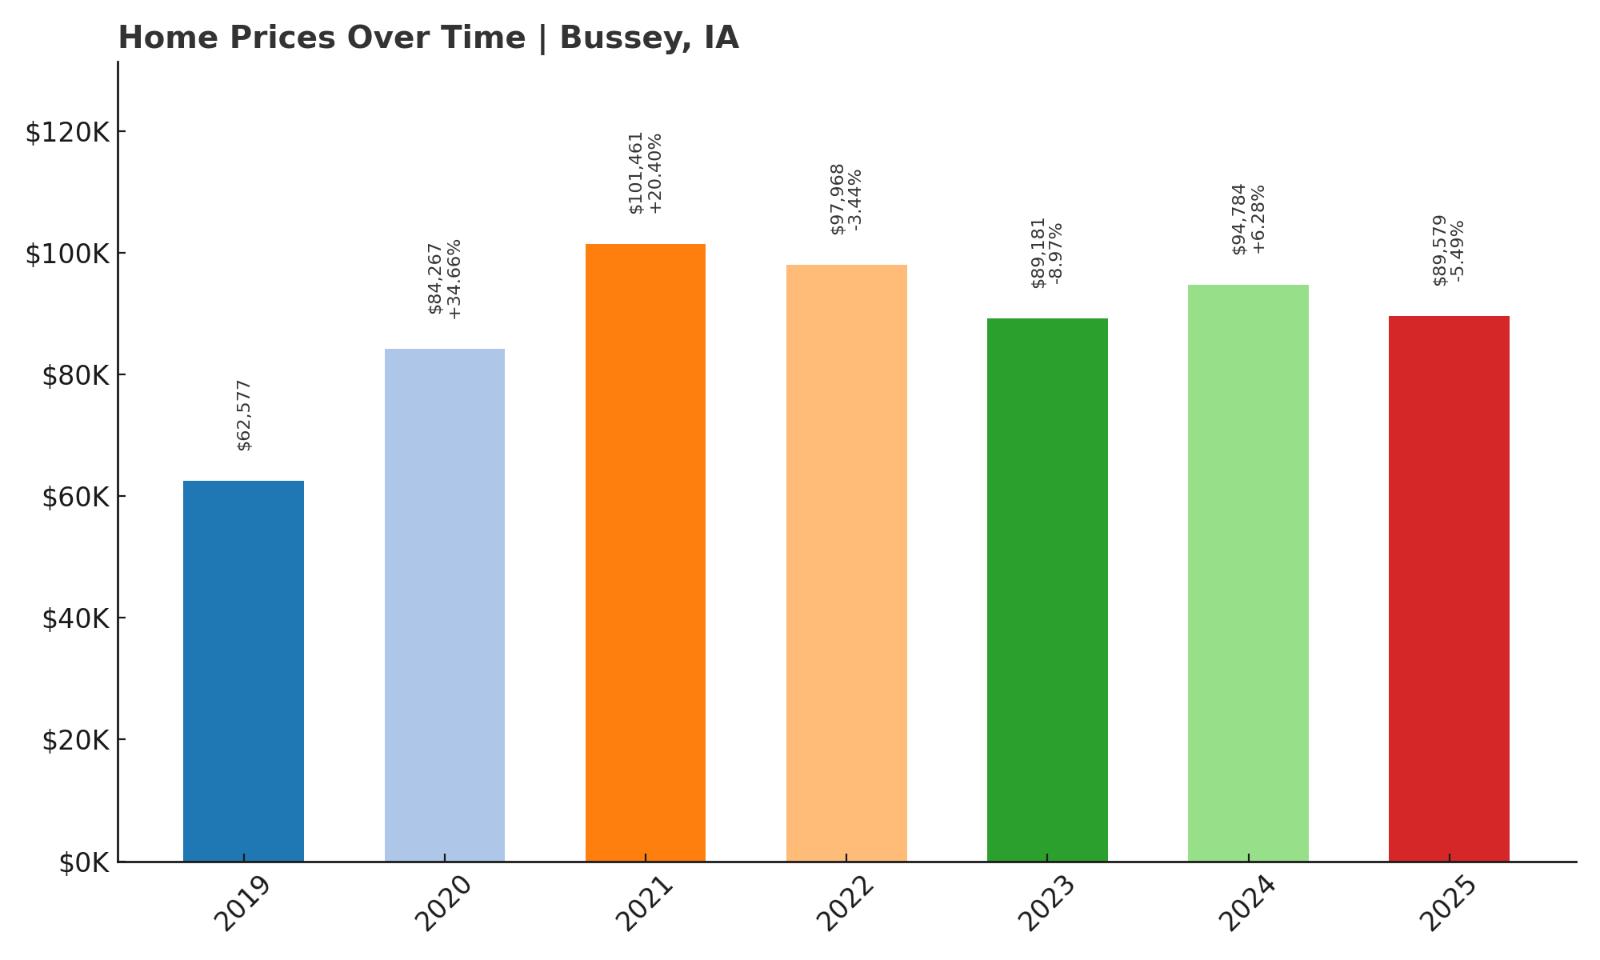
14. Bussey – 43.2% Home Price Increase Since 2019
- 2010: N/A
- 2011: N/A
- 2012: N/A
- 2013: N/A
- 2014: N/A
- 2015: N/A
- 2016: N/A
- 2017: N/A
- 2018: N/A
- 2019: $62,577.72
- 2020: $84,267.77 (+$21,690.06, +34.66% from previous year)
- 2021: $101,461.37 (+$17,193.60, +20.40% from previous year)
- 2022: $97,968.04 (-$3,493.33, -3.44% from previous year)
- 2023: $89,181.41 (-$8,786.63, -8.97% from previous year)
- 2024: $94,784.76 (+$5,603.34, +6.28% from previous year)
- 2025: $89,579.20 (-$5,205.56, -5.49% from previous year)
Bussey saw an aggressive surge in home values during the 2020–2021 boom but has since cooled off. Prices remain 43% above 2019 levels, though the last three years reflect a downward correction. For buyers, this shift may present a timely opening in a market once considered overheated.
Bussey – Boom and Balance in Marion County
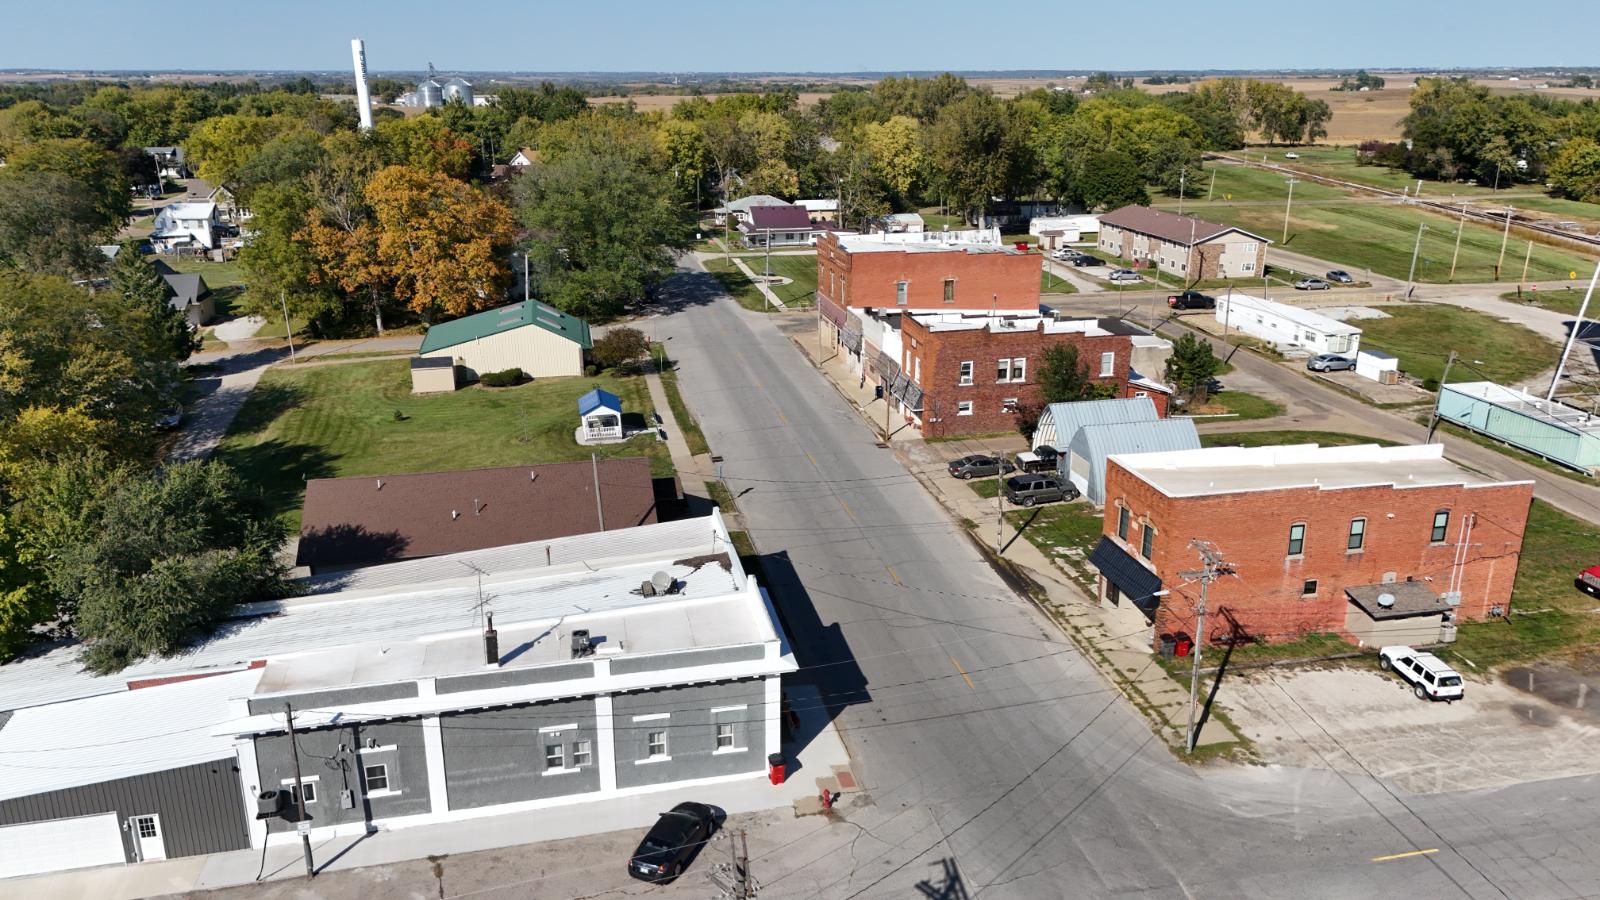
Located in southern Marion County, Bussey is a small town with a strong agricultural foundation and tight-knit community. Its housing market exploded during the pandemic, with home prices shooting up by over 60% in just two years. However, this rapid climb was followed by a correction, suggesting the peak may have been unsustainable in the short term.
By 2025, average home values hover around $89,000 — a significant drop from the 2021 high. Still, this is a market that saw real demand and remains an attractive option for families or individuals looking for low-cost homes near Oskaloosa or Knoxville. With essential services nearby and a calm small-town atmosphere, Bussey’s current prices reflect a recalibrated, but still desirable, local market.
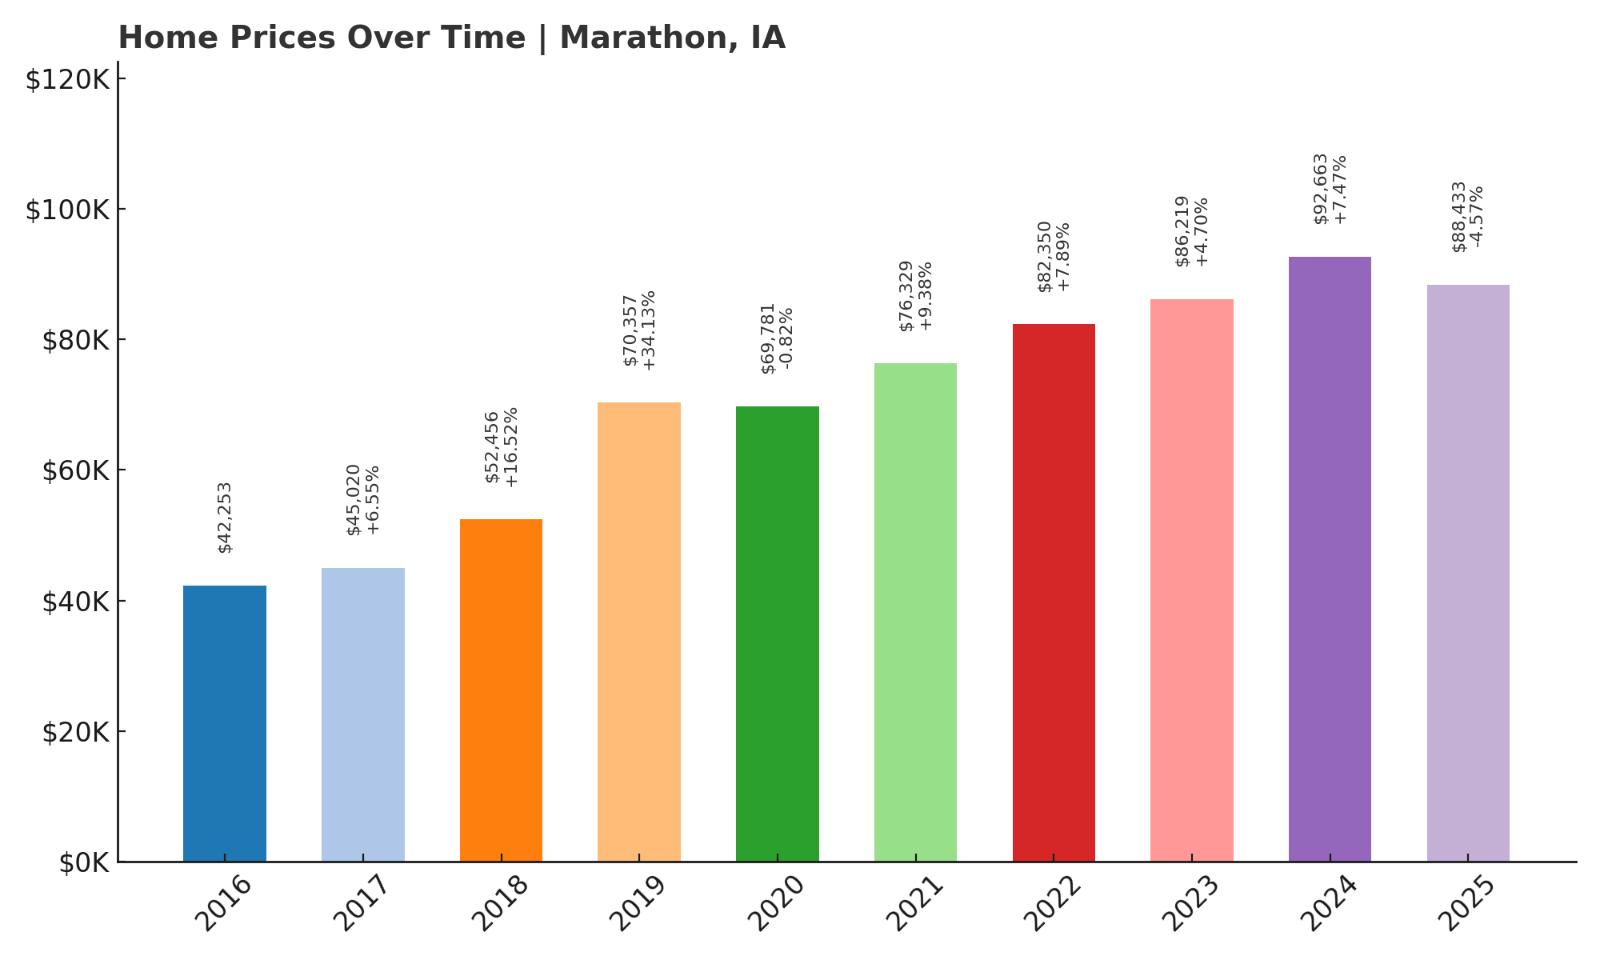
13. Marathon – 109.2% Home Price Increase Since 2016
- 2010: N/A
- 2011: N/A
- 2012: N/A
- 2013: N/A
- 2014: N/A
- 2015: N/A
- 2016: $42,253.83
- 2017: $45,020.60 (+$2,766.77, +6.55% from previous year)
- 2018: $52,456.77 (+$7,436.16, +16.52% from previous year)
- 2019: $70,357.72 (+$17,900.96, +34.13% from previous year)
- 2020: $69,781.08 (-$576.64, -0.82% from previous year)
- 2021: $76,329.49 (+$6,548.41, +9.38% from previous year)
- 2022: $82,350.75 (+$6,021.25, +7.89% from previous year)
- 2023: $86,219.81 (+$3,869.06, +4.70% from previous year)
- 2024: $92,663.39 (+$6,443.58, +7.47% from previous year)
- 2025: $88,433.19 (-$4,230.20, -4.57% from previous year)
Marathon’s home prices have more than doubled since 2016, with especially sharp gains from 2017 through 2019. While prices have fluctuated slightly since, the long-term trajectory remains impressive. It’s one of the fastest-appreciating markets in this affordability roundup.
Marathon – Rapid Growth From a Low Starting Point
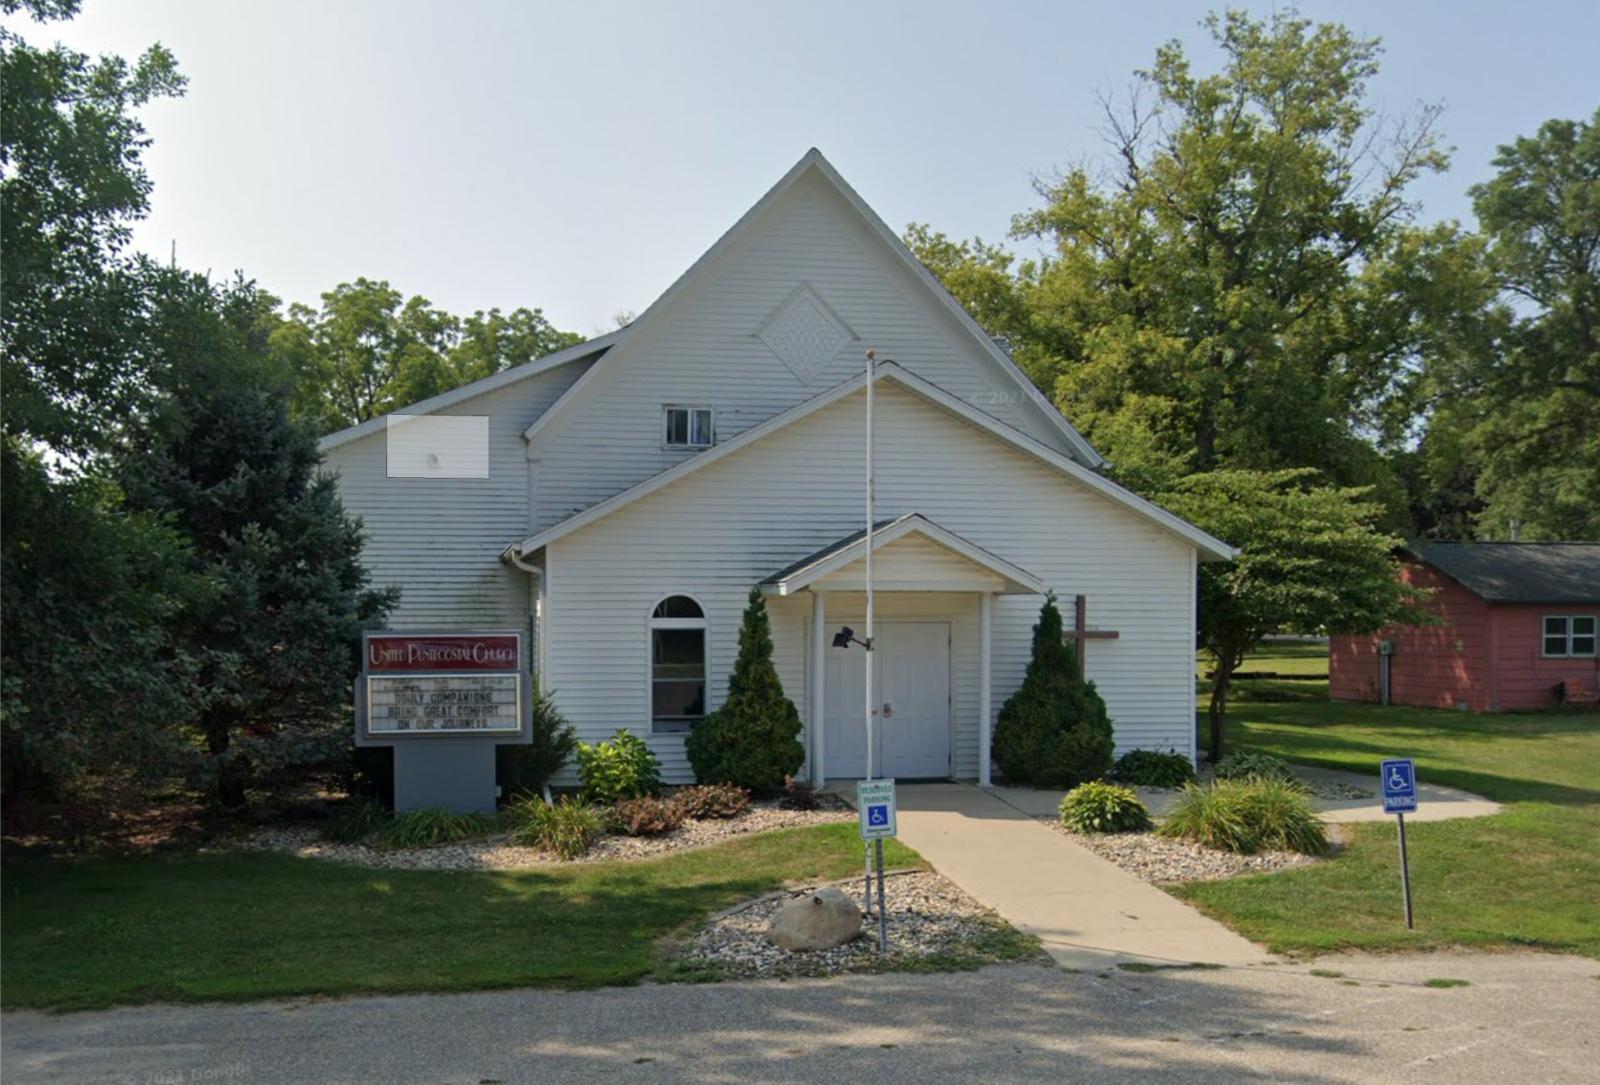
Marathon is a small town in Buena Vista County that saw its home values rise from just over $42,000 in 2016 to nearly $89,000 in 2025. That’s a 109% increase, driven by steady demand and limited housing stock. It remains a low-density community with quiet streets and open farmland, but rising interest in budget-friendly properties has pushed prices up.
Despite its size, Marathon benefits from being located near Storm Lake and the Highway 71 corridor. That makes it a feasible option for workers commuting to larger job markets or looking for inexpensive investment properties. Though prices dipped slightly in 2025, the broader trend is one of strong appreciation, and that trajectory may continue if demand holds.
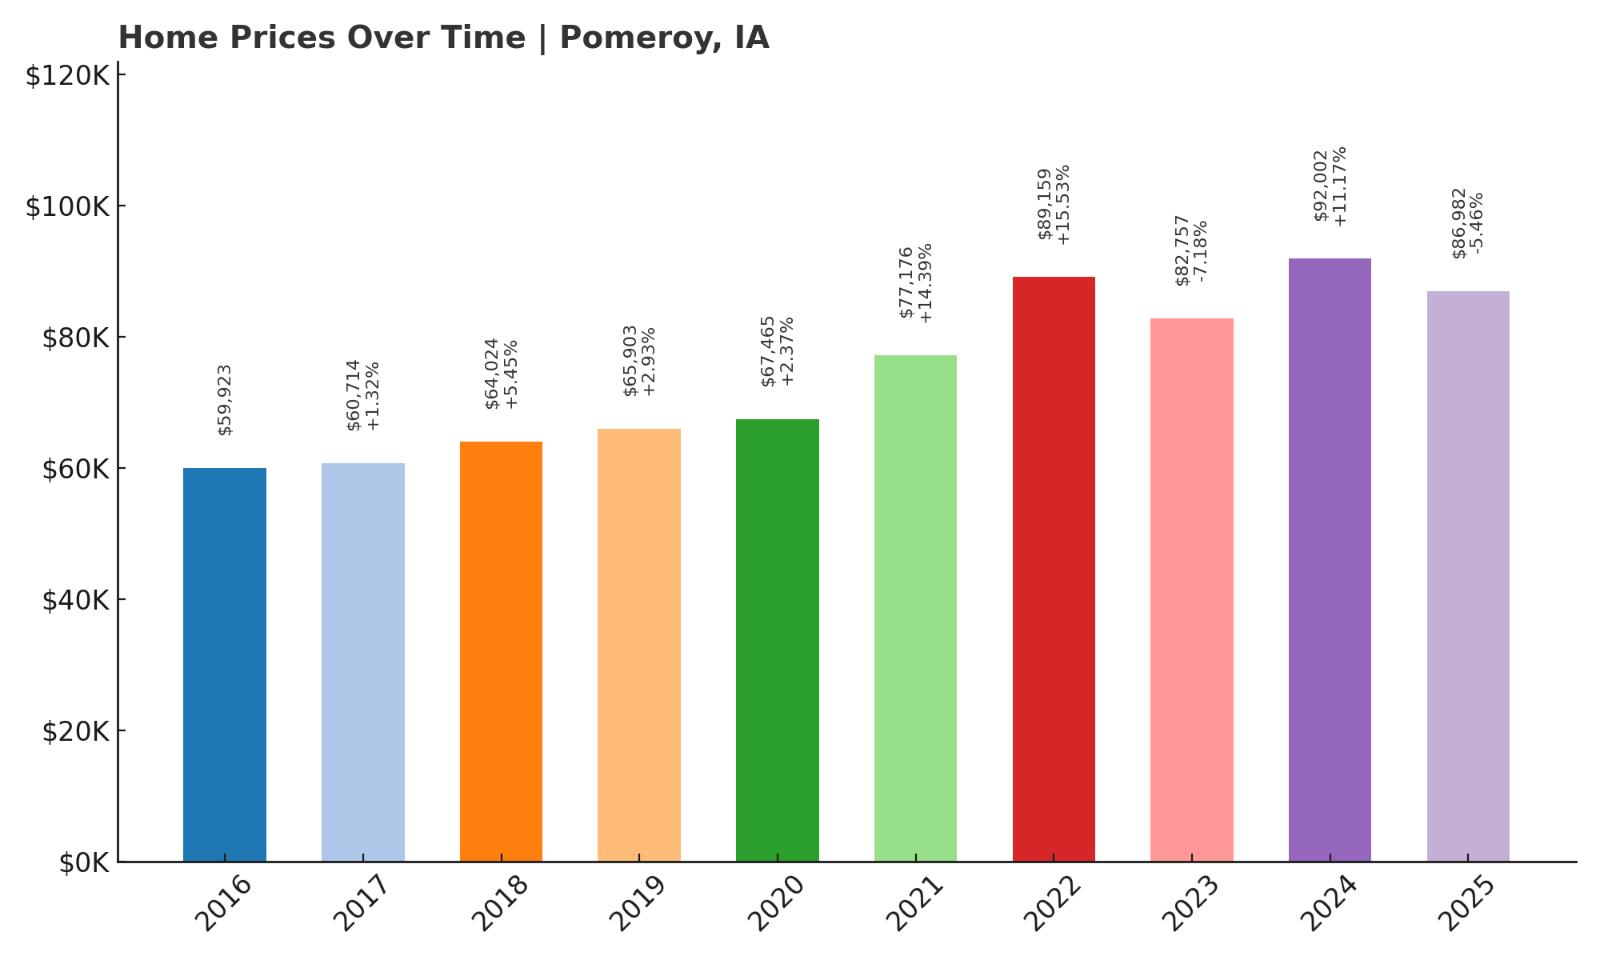
12. Pomeroy – 45.2% Home Price Increase Since 2016
- 2010: N/A
- 2011: N/A
- 2012: N/A
- 2013: N/A
- 2014: N/A
- 2015: N/A
- 2016: $59,923.12
- 2017: $60,714.04 (+$790.92, +1.32% from previous year)
- 2018: $64,024.97 (+$3,310.94, +5.45% from previous year)
- 2019: $65,903.62 (+$1,878.65, +2.93% from previous year)
- 2020: $67,465.83 (+$1,562.21, +2.37% from previous year)
- 2021: $77,176.90 (+$9,711.07, +14.39% from previous year)
- 2022: $89,159.78 (+$11,982.88, +15.53% from previous year)
- 2023: $82,757.95 (-$6,401.83, -7.18% from previous year)
- 2024: $92,002.80 (+$9,244.85, +11.17% from previous year)
- 2025: $86,982.38 (-$5,020.43, -5.46% from previous year)
Pomeroy has grown 45% in value since 2016, with most gains occurring between 2020 and 2022. The market dipped in 2023 and 2025, showing some softening, but average prices remain well below the state median, offering affordability with a history of growth.
Pomeroy – Rural Strength With Market Fluctuations
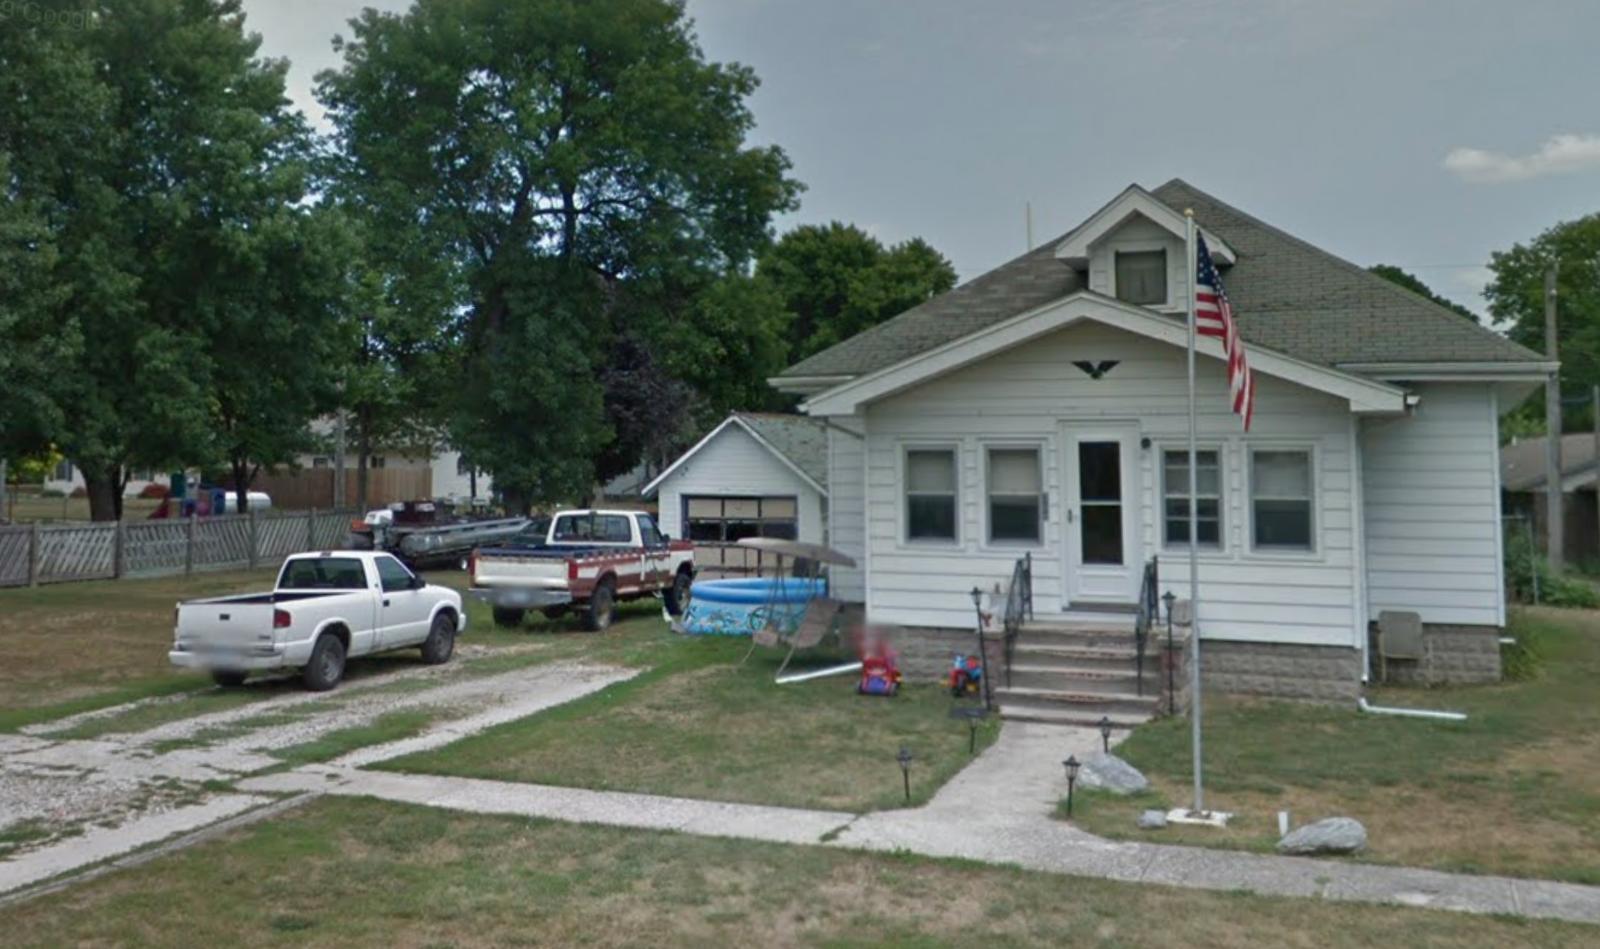
In Calhoun County, Pomeroy is another example of a small Iowa town where long-term price appreciation doesn’t mean unaffordable homes. After a steady climb in the mid-2010s, the pandemic accelerated growth — peaking in 2022 before giving way to price corrections. With homes averaging $86,000 in 2025, Pomeroy still stands out as a value play.
The town features basic amenities, community parks, and access to U.S. Route 20 — allowing easy movement between Fort Dodge and Sioux City. Though the price chart includes recent declines, the broader trend remains positive. It’s a town with historical character and ongoing demand from those prioritizing space, affordability, and low cost of ownership.
11. Waucoma – 11.3% Home Price Increase Since 2019
- 2010: N/A
- 2011: N/A
- 2012: N/A
- 2013: N/A
- 2014: N/A
- 2015: N/A
- 2016: N/A
- 2017: N/A
- 2018: N/A
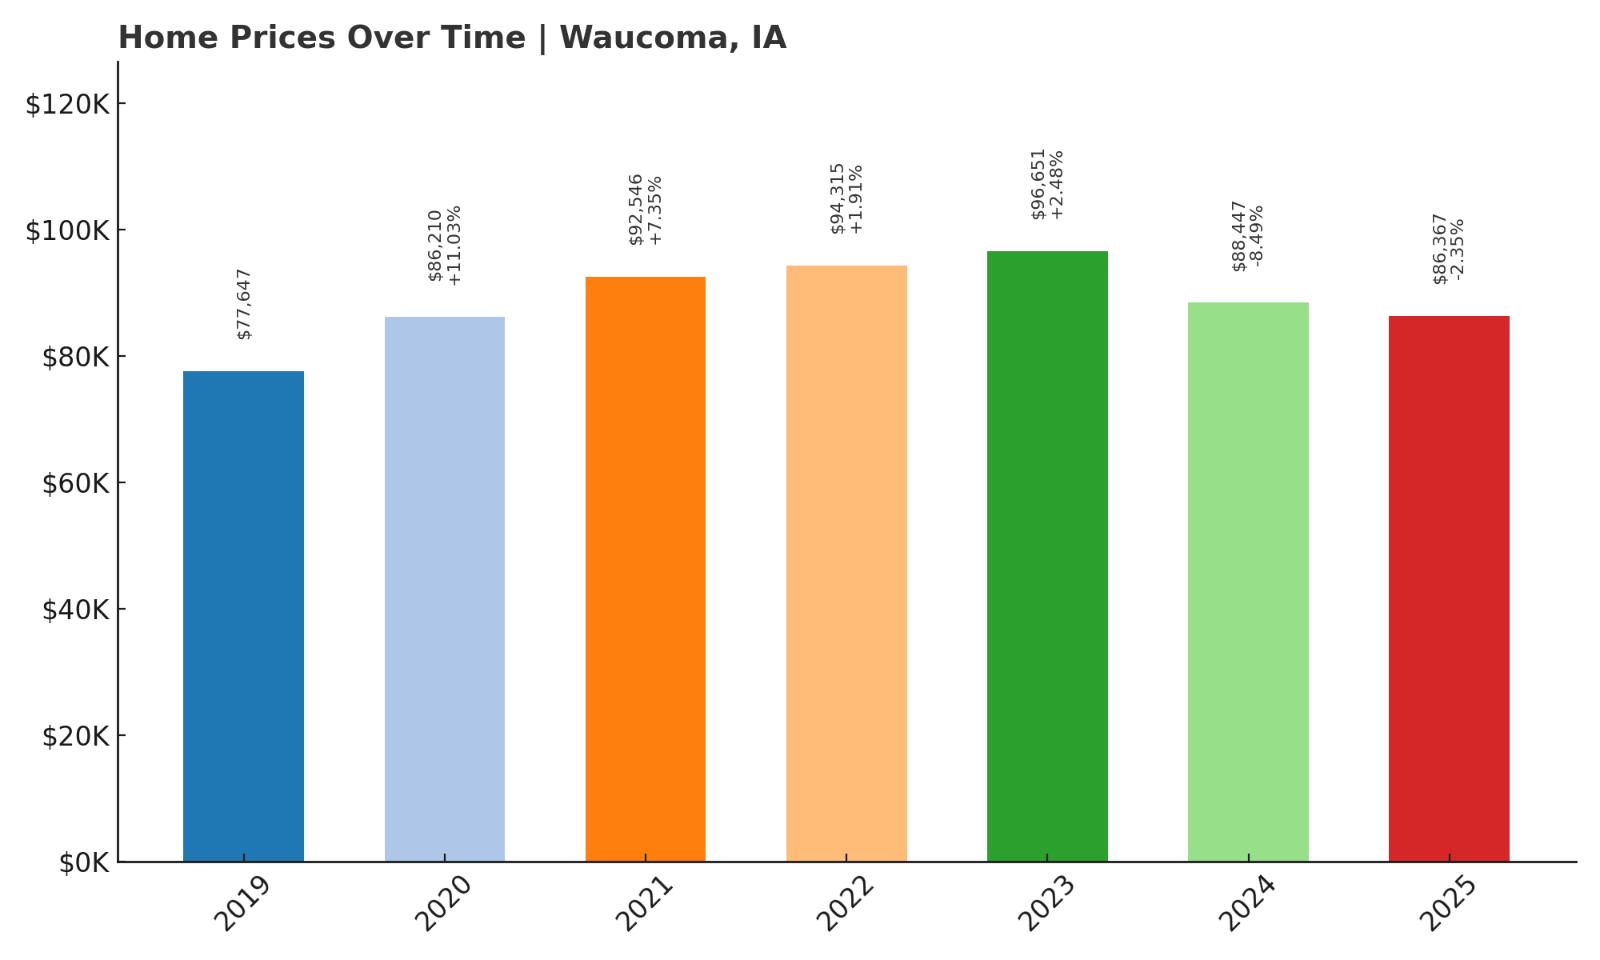
- 2019: $77,647.49
- 2020: $86,210.25 (+$8,562.76, +11.03% from previous year)
- 2021: $92,546.79 (+$6,336.54, +7.35% from previous year)
- 2022: $94,315.38 (+$1,768.58, +1.91% from previous year)
- 2023: $96,651.89 (+$2,336.51, +2.48% from previous year)
- 2024: $88,447.66 (-$8,204.23, -8.49% from previous year)
- 2025: $86,367.18 (-$2,080.48, -2.35% from previous year)
Waucoma’s home prices have gone up a modest 11.3% since 2019, with the sharpest growth occurring between 2019 and 2021. While recent years have seen some correction, the market remains affordable and relatively stable. The downturns in 2024 and 2025 suggest an adjustment following the earlier post-pandemic run-up.
Waucoma – A Tight-Knit Community With Balanced Pricing
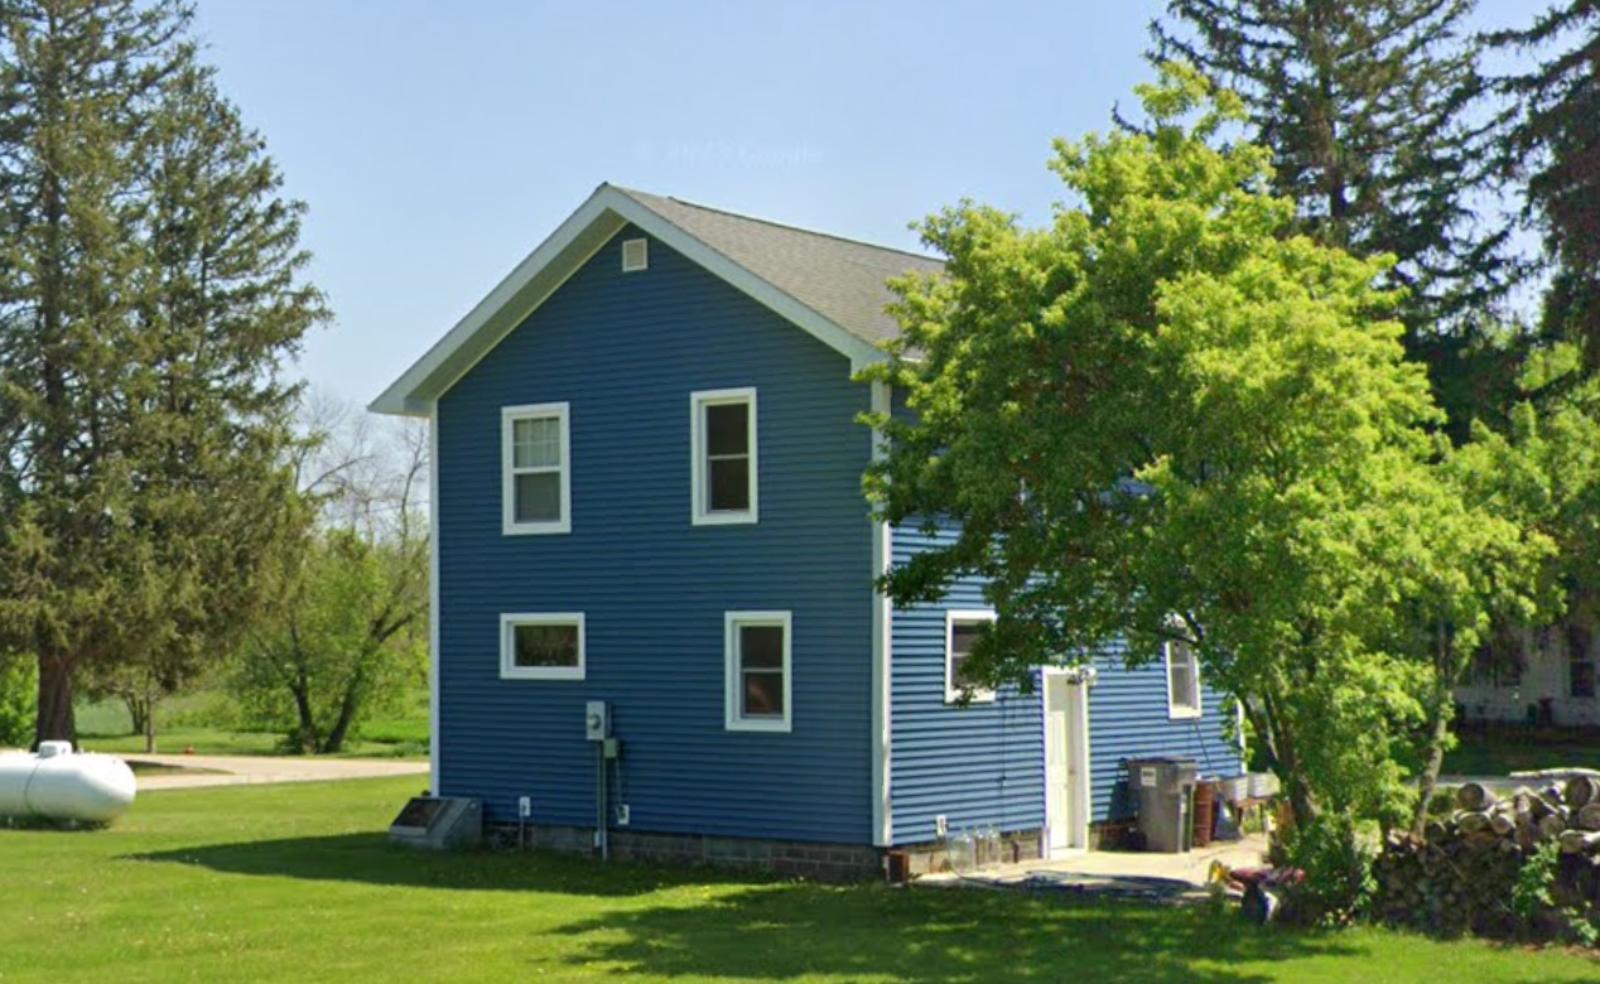
Waucoma is a small town in Fayette County with fewer than 300 residents, and it embodies the slow-paced, tight-knit character of rural northeastern Iowa. The housing market here has generally avoided extreme swings, with values increasing steadily before hitting a soft ceiling around 2022. Despite a couple of years of gentle price declines, homes remain comfortably priced under $90,000, making Waucoma one of the most budget-friendly markets in the region. This consistency reflects the town’s stable housing demand, grounded in local ownership and long-term residency rather than investor speculation. For homebuyers looking for predictability and affordability, that stability matters.
Waucoma is surrounded by open farmland and located about 30 miles from Decorah, a cultural and educational hub. While the town itself is small, it supports a post office, churches, and a few local businesses, and has a reputation for a close community where neighbors know each other by name. Many homes are older but well-kept, and properties come with large lots compared to urban standards. The proximity to larger towns for employment and healthcare gives residents the best of both worlds: low-cost homeownership and access to essential services. Waucoma isn’t trying to be flashy — it’s a quiet, affordable place to put down roots and stretch your housing dollars farther than most towns in Iowa.
10. Centerville – 70.9% Home Price Increase Since 2010
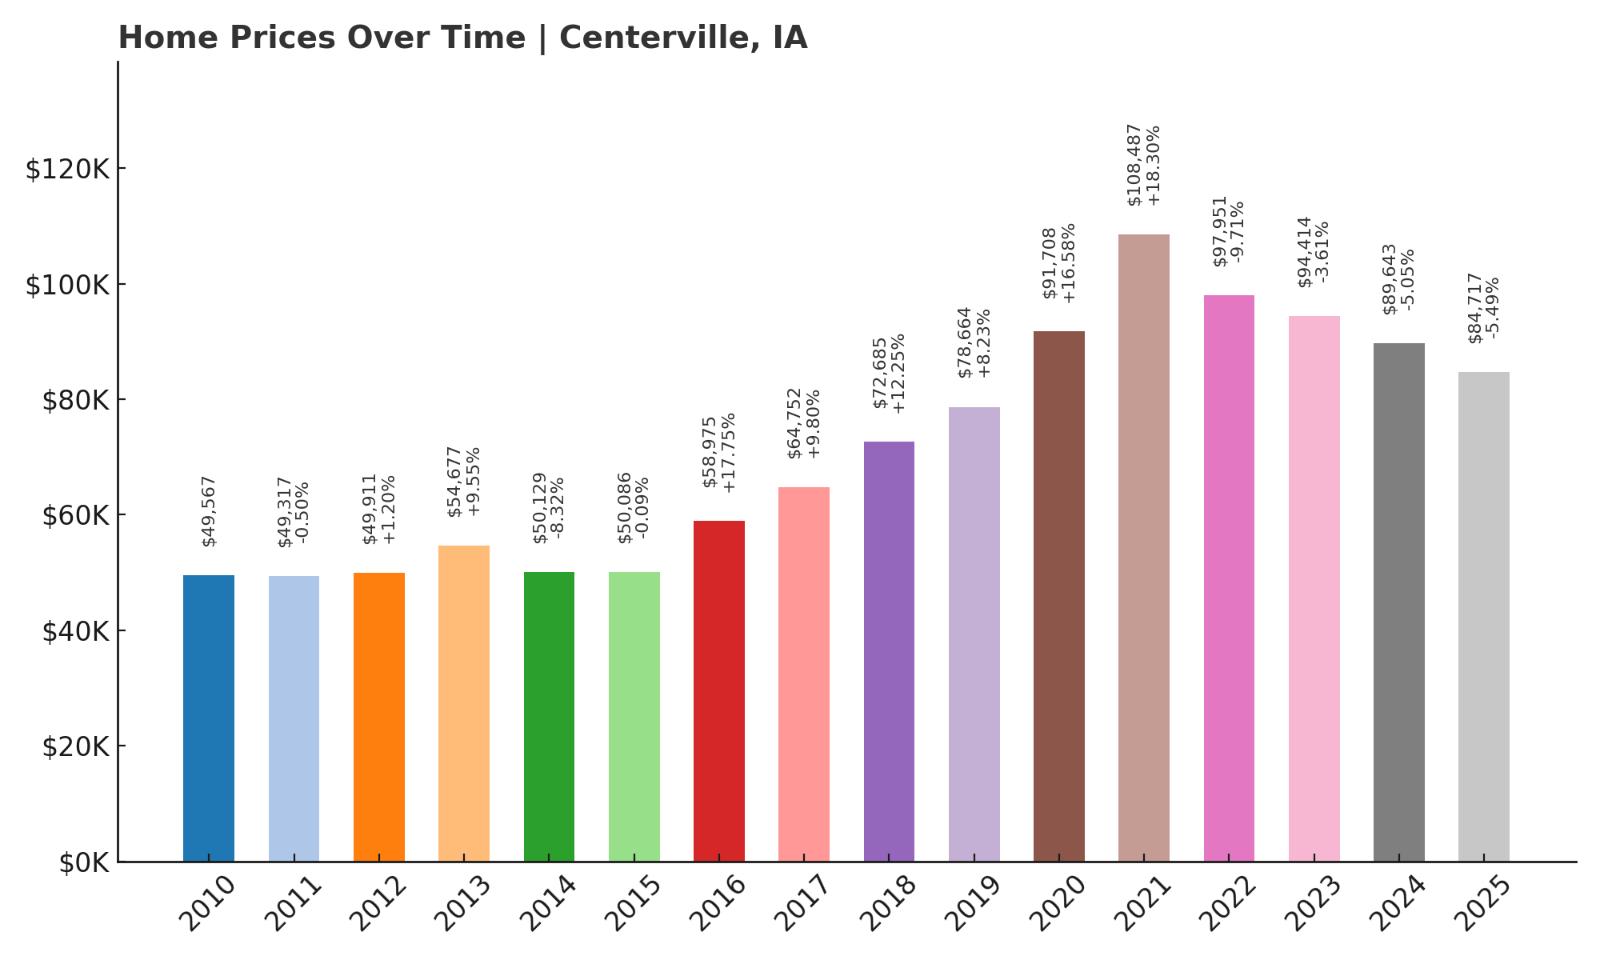
- 2010: $49,567.06
- 2011: $49,317.70 (-$249.36, -0.50% from previous year)
- 2012: $49,911.75 (+$594.05, +1.20% from previous year)
- 2013: $54,677.83 (+$4,766.08, +9.55% from previous year)
- 2014: $50,129.11 (-$4,548.72, -8.32% from previous year)
- 2015: $50,086.14 (-$42.97, -0.09% from previous year)
- 2016: $58,975.07 (+$8,888.93, +17.75% from previous year)
- 2017: $64,752.98 (+$5,777.91, +9.80% from previous year)
- 2018: $72,685.39 (+$7,932.41, +12.25% from previous year)
- 2019: $78,664.86 (+$5,979.46, +8.23% from previous year)
- 2020: $91,708.52 (+$13,043.67, +16.58% from previous year)
- 2021: $108,487.20 (+$16,778.68, +18.30% from previous year)
- 2022: $97,951.75 (-$10,535.45, -9.71% from previous year)
- 2023: $94,414.22 (-$3,537.53, -3.61% from previous year)
- 2024: $89,643.06 (-$4,771.16, -5.05% from previous year)
- 2025: $84,717.41 (-$4,925.65, -5.49% from previous year)
Centerville’s home prices have risen nearly 71% since 2010, despite several recent years of steady decline. The town saw major gains through 2021, reaching a peak above $108,000, before a multi-year correction brought values closer to their long-term average.
Centerville – Strong History, Recent Correction
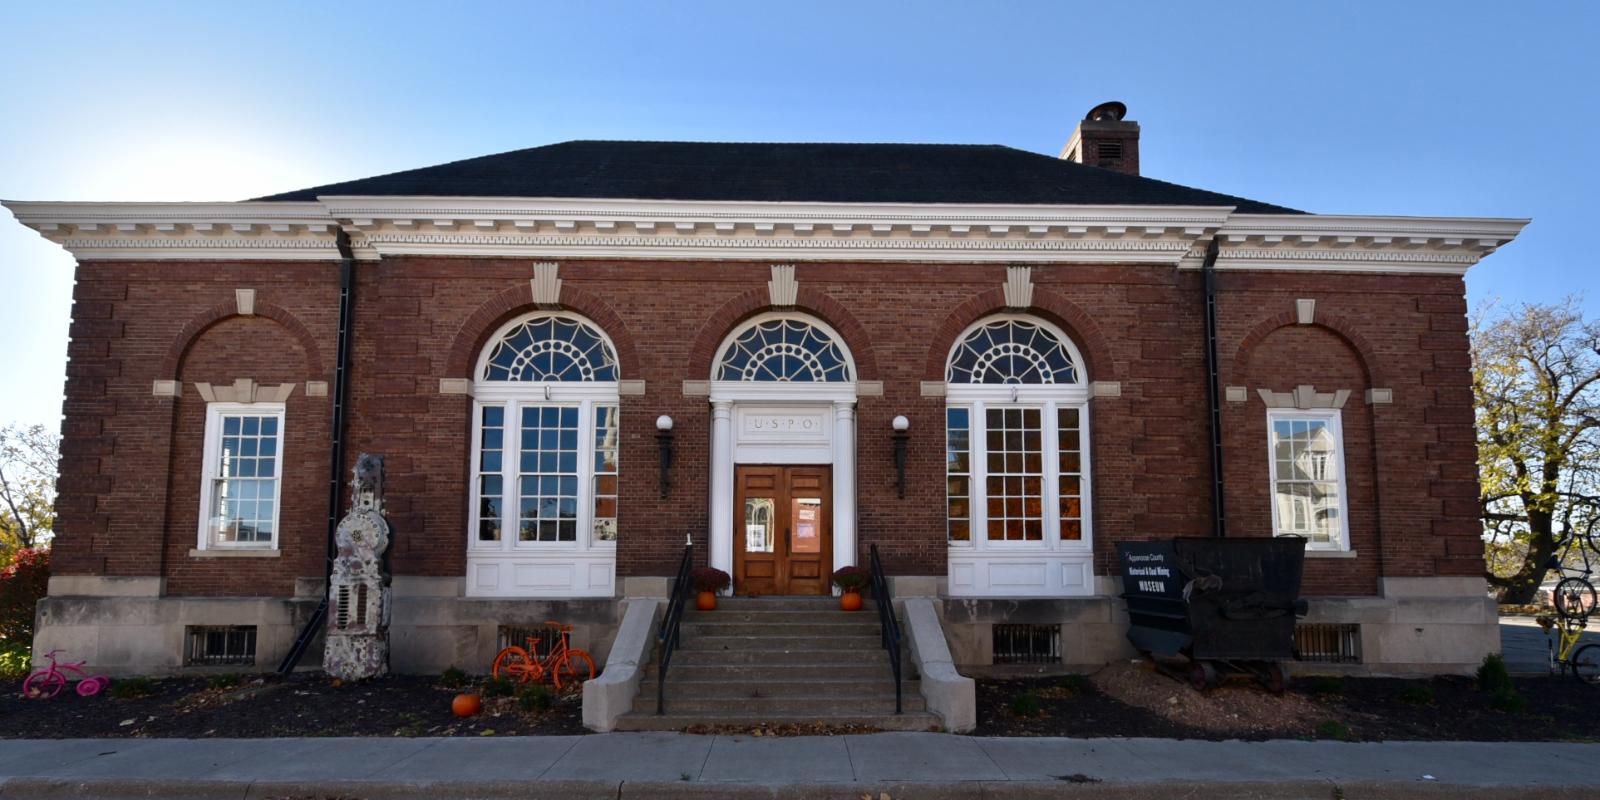
Centerville, located in Appanoose County near the Missouri border, is one of Iowa’s more historically rich small cities. With a population of around 5,000, it has a robust downtown, historical courthouse square, and multiple public amenities including parks, a public library, and a community college campus. The city once thrived on coal mining and railroads and still benefits from being a regional hub in the southern tier of the state. Home values here surged from 2016 to 2021, reflecting a broader national trend — but prices have declined steadily over the last four years. The average price in 2025 sits around $84,700, down from a high of $108,000 just four years earlier.
Despite the downturn, Centerville remains affordable by nearly any measure, and the recent price drops could represent a reset more than a red flag. It’s the kind of place where a modest salary can still support homeownership. The area features Rathbun Lake and Honey Creek Resort just to the north, drawing seasonal visitors and modest tourism dollars. With healthcare, schools, and jobs available within city limits, Centerville offers a complete lifestyle for much less than urban markets. For buyers looking for value with some cultural and civic infrastructure, it offers a compelling mix — especially at its current price point.
9. Keokuk – 32.2% Home Price Increase Since 2010
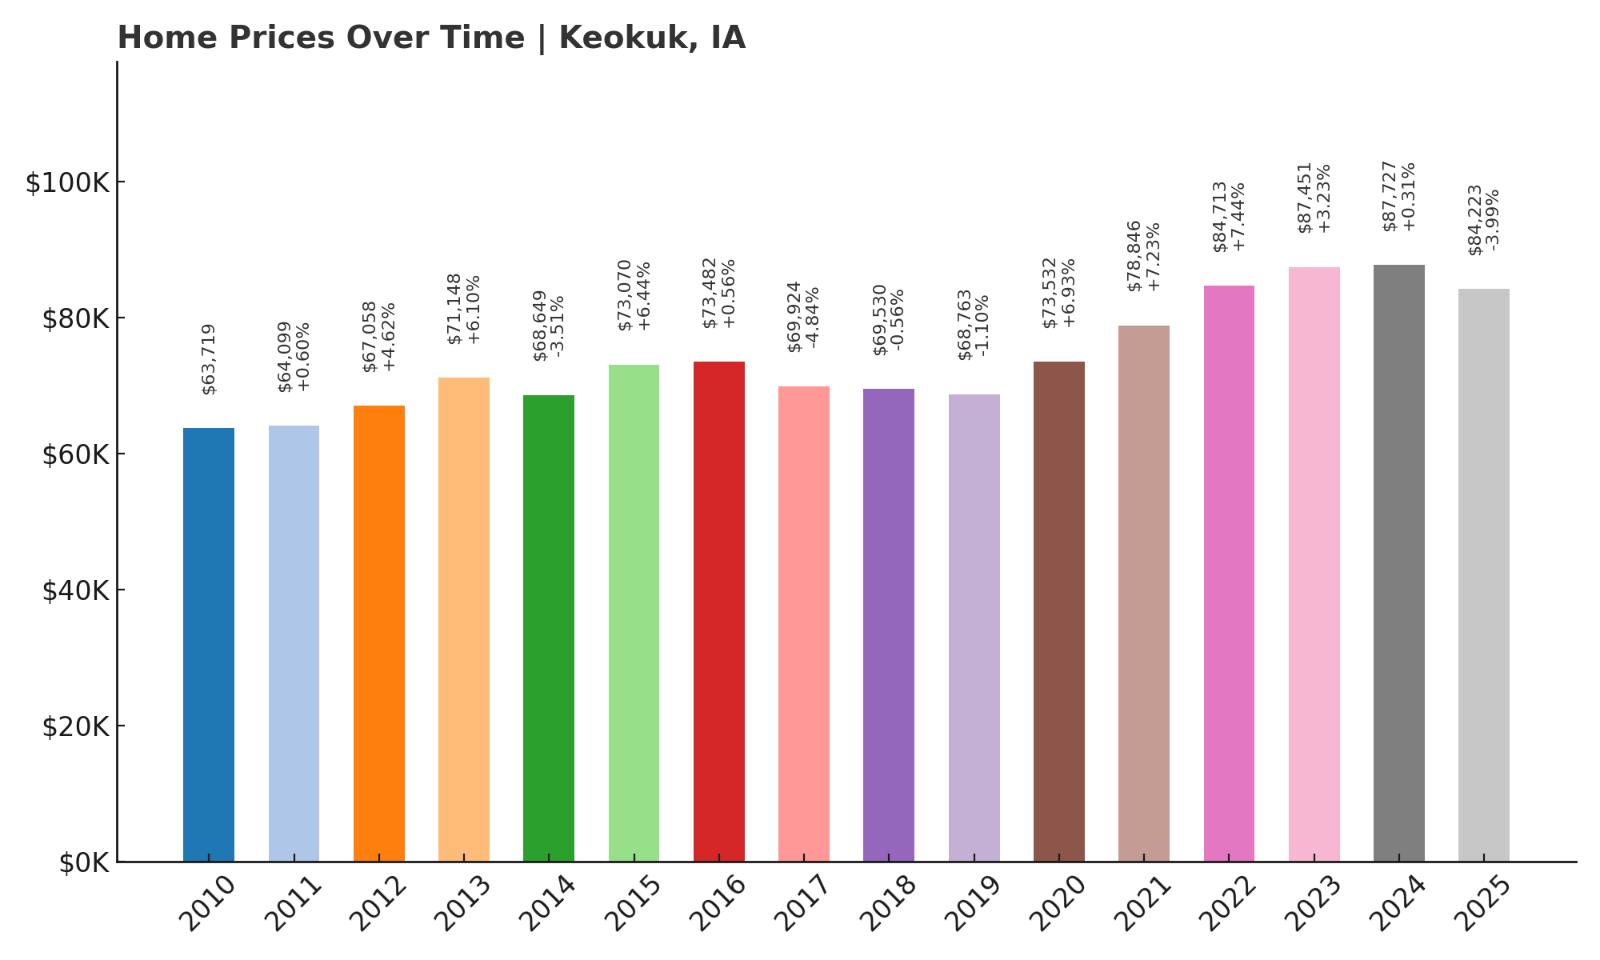
- 2010: $63,719.43
- 2011: $64,099.98 (+$380.54, +0.60% from previous year)
- 2012: $67,058.61 (+$2,958.63, +4.62% from previous year)
- 2013: $71,148.39 (+$4,089.78, +6.10% from previous year)
- 2014: $68,649.35 (-$2,499.03, -3.51% from previous year)
- 2015: $73,070.51 (+$4,421.15, +6.44% from previous year)
- 2016: $73,482.57 (+$412.07, +0.56% from previous year)
- 2017: $69,924.02 (-$3,558.55, -4.84% from previous year)
- 2018: $69,530.69 (-$393.33, -0.56% from previous year)
- 2019: $68,763.45 (-$767.24, -1.10% from previous year)
- 2020: $73,532.02 (+$4,768.57, +6.93% from previous year)
- 2021: $78,846.64 (+$5,314.61, +7.23% from previous year)
- 2022: $84,713.96 (+$5,867.32, +7.44% from previous year)
- 2023: $87,451.74 (+$2,737.78, +3.23% from previous year)
- 2024: $87,727.04 (+$275.30, +0.31% from previous year)
- 2025: $84,223.50 (-$3,503.54, -3.99% from previous year)
Keokuk’s home prices have climbed more than 32% since 2010, with the most consistent growth happening between 2020 and 2022. The slight dip in 2025 follows a multi-year stretch of stability and suggests a modest price correction in an otherwise steady market.
Keokuk – Mississippi River City With Historical Value
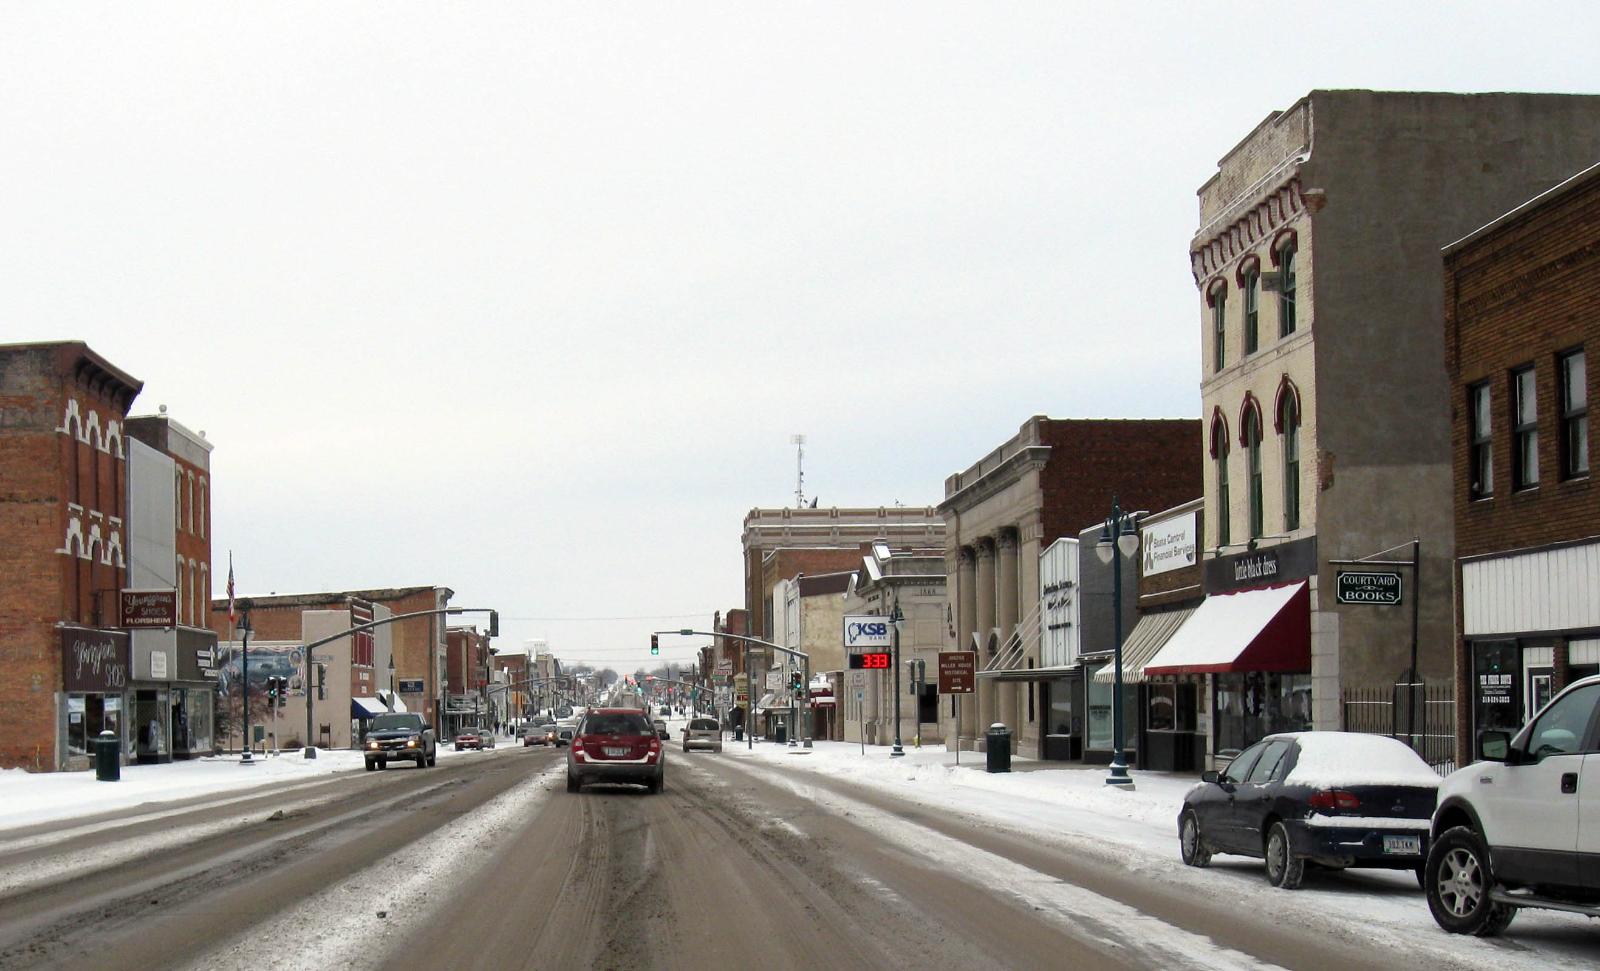
Keokuk is one of the more historically significant cities in southeastern Iowa, located at the convergence of the Des Moines and Mississippi Rivers. With roots in 19th-century steamboat trade and a grid of historic homes, Keokuk combines small-city services with some of the most affordable housing in the region. Home prices here have risen over the past decade, but current values hover just above $84,000 — very low for a town that features amenities like a hospital, multiple public schools, shopping districts, and riverfront parks. The community also hosts several annual events and has a diverse housing stock that includes both older Victorian homes and mid-century builds.
Geographically, Keokuk borders Illinois and Missouri, giving it cross-state commuter access and potential appeal for tri-state workers. It’s the southernmost city in Iowa and serves as a key industrial and transport corridor. Although the economy has had ups and downs, recent housing trends show that Keokuk has managed to avoid wild fluctuations and instead build a slow but steady pattern of appreciation. The recent dip could offer opportunities for those seeking value in a community that has infrastructure, character, and location working in its favor.
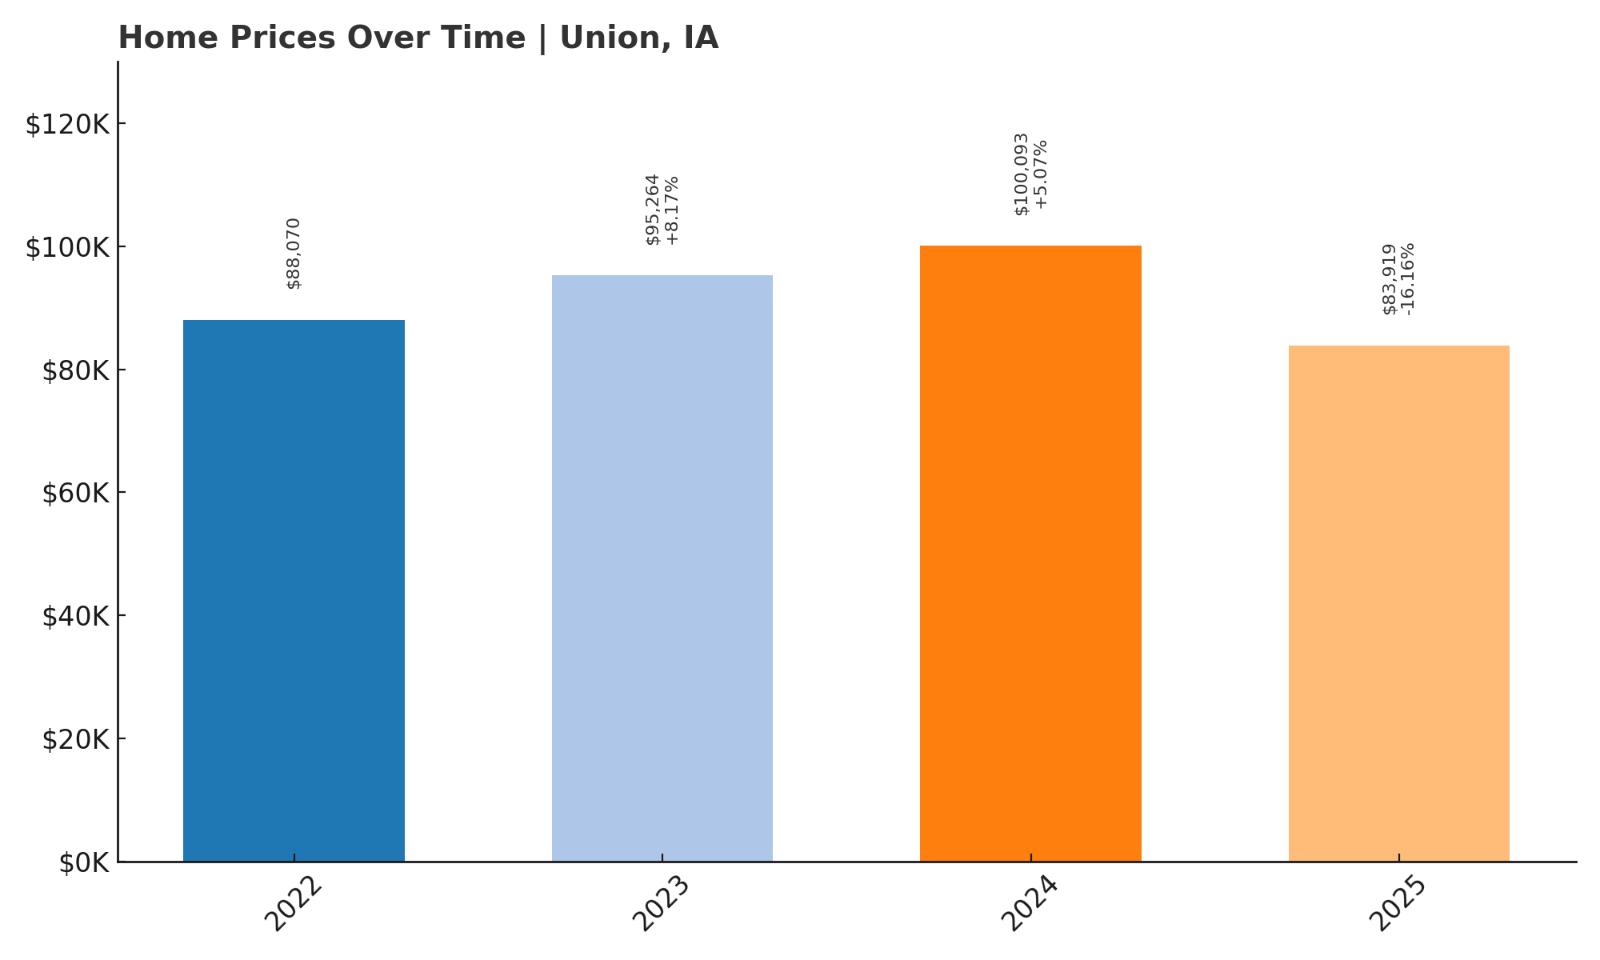
8. Union – Home Prices Down 4.7% Since 2022
- 2010: N/A
- 2011: N/A
- 2012: N/A
- 2013: N/A
- 2014: N/A
- 2015: N/A
- 2016: N/A
- 2017: N/A
- 2018: N/A
- 2019: N/A
- 2020: N/A
- 2021: N/A
- 2022: $88,070.48
- 2023: $95,264.78 (+$7,194.30, +8.17% from previous year)
- 2024: $100,093.20 (+$4,828.42, +5.07% from previous year)
- 2025: $83,919.94 (-$16,173.26, -16.16% from previous year)
Union’s home prices surged rapidly between 2022 and 2024, climbing from under $90,000 to just over $100,000. However, the 2025 figure marks a sharp 16% drop, pulling prices back to roughly where they were two years prior. It’s one of the more dramatic one-year reversals in this entire list, raising questions and opportunities for prospective buyers.
Union – A High-Peak, High-Drop Market in Central Iowa
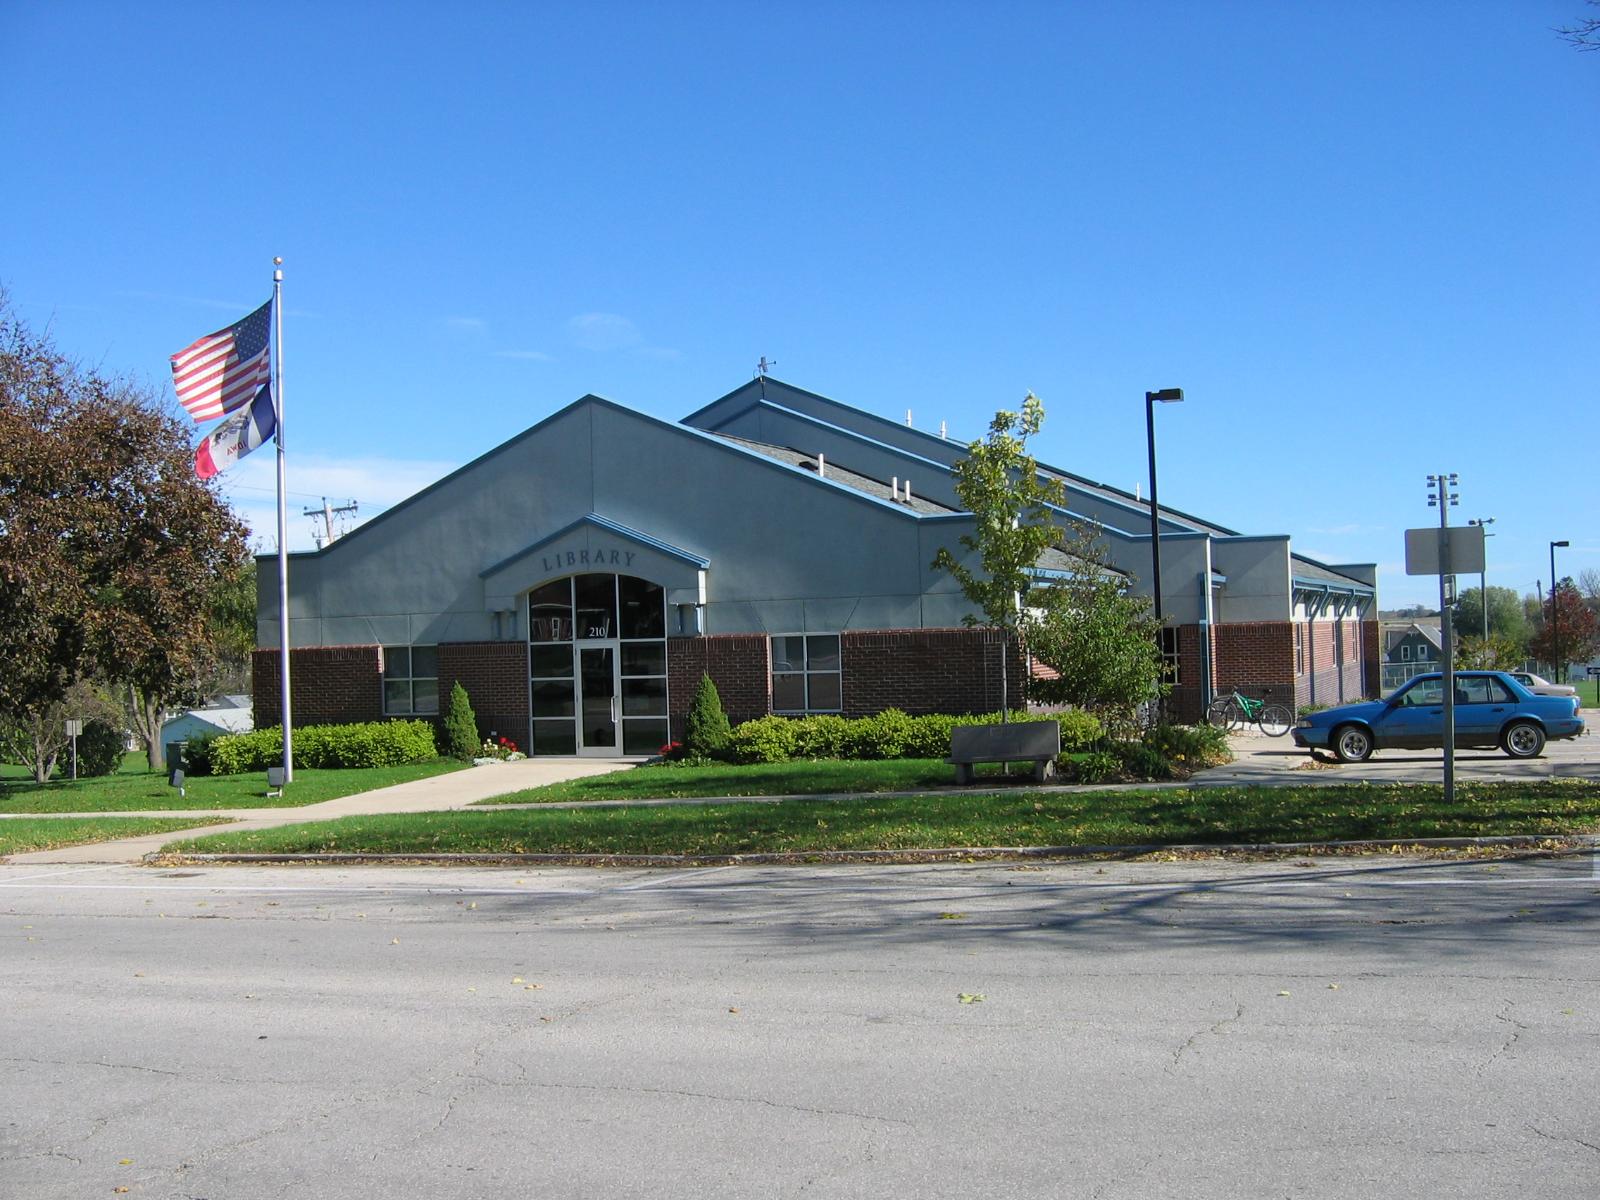
Union is a small town in Hardin County, centrally located between Marshalltown and Eldora. With a population of under 400 people, it exemplifies the kind of rural Midwest town where affordability, community, and open space still hold strong appeal. The jump in prices between 2022 and 2024 likely reflects pandemic-era demand coupled with a limited housing supply. Union doesn’t have a large volume of listings at any given time, and a handful of home sales can shift the local index quickly. Buyers looking here during the surge may have faced competitive offers for the first time in years. But in 2025, prices fell back by more than $16,000 — a correction that could reflect slowing demand, inflationary pressures, or simple market saturation in such a small housing pool.
Despite the price dip, Union remains attractive for several reasons. It’s close to Iowa Highway 14 and within commuting distance of larger towns, making it viable for workers who want quiet living without complete isolation. The town includes a community center, elementary school, and access to recreational facilities like Union Country Club golf course. Many homes are older, built mid-century or earlier, and typically sit on large lots. Union’s price volatility suggests that buyers should be mindful of timing — but for those entering the market now, the 2025 dip presents a possible bargain in a town that has shown it can climb quickly when conditions are right. With prices under $84,000 and basic amenities in place, Union’s affordability is back on the table after a brief market peak.
7. Rolfe – Home Prices Down 0.7% Since 2022
- 2010: N/A
- 2011: N/A
- 2012: N/A
- 2013: N/A
- 2014: N/A
- 2015: N/A
- 2016: N/A
- 2017: N/A
- 2018: N/A
- 2019: N/A
- 2020: N/A
- 2021: N/A
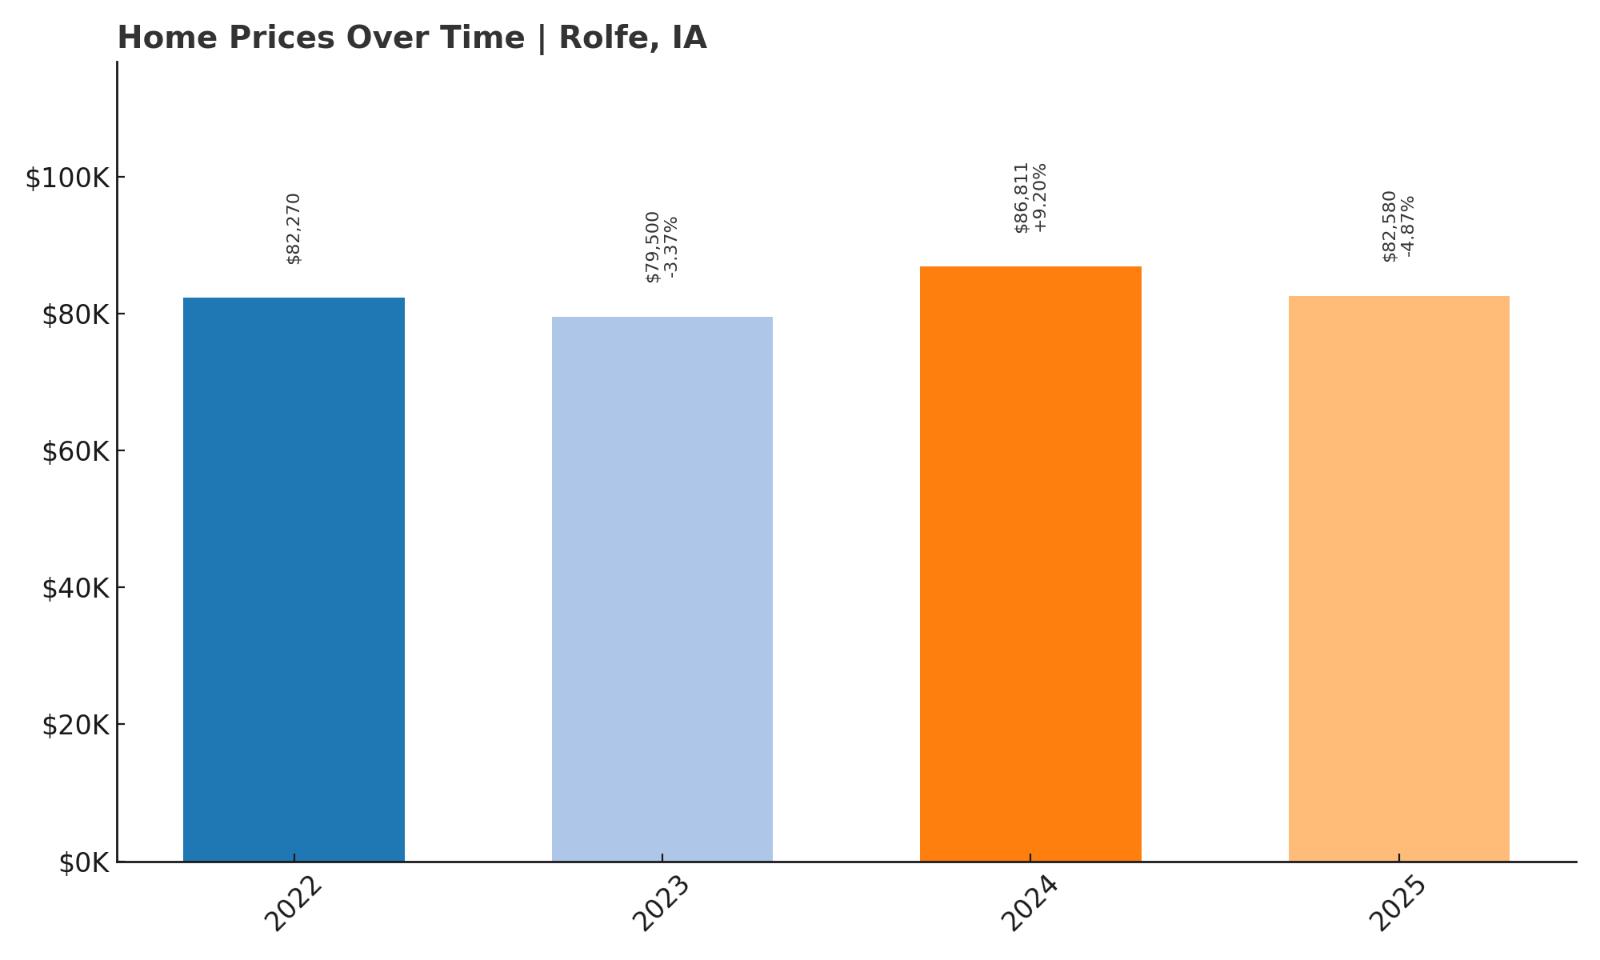
- 2022: $82,270.25
- 2023: $79,500.19 (-$2,770.06, -3.37% from previous year)
- 2024: $86,811.17 (+$7,310.98, +9.20% from previous year)
- 2025: $82,580.80 (-$4,230.36, -4.87% from previous year)
Rolfe’s housing market has wobbled slightly since 2022, with a mild drop overall of 0.7%. The price trajectory has seesawed over three years, dipping in 2023, rebounding in 2024, then sliding again in 2025. While the fluctuations are modest, they suggest a market that hasn’t yet settled into a consistent trend.
Rolfe – Modest Prices and Modest Swings in Pocahontas County
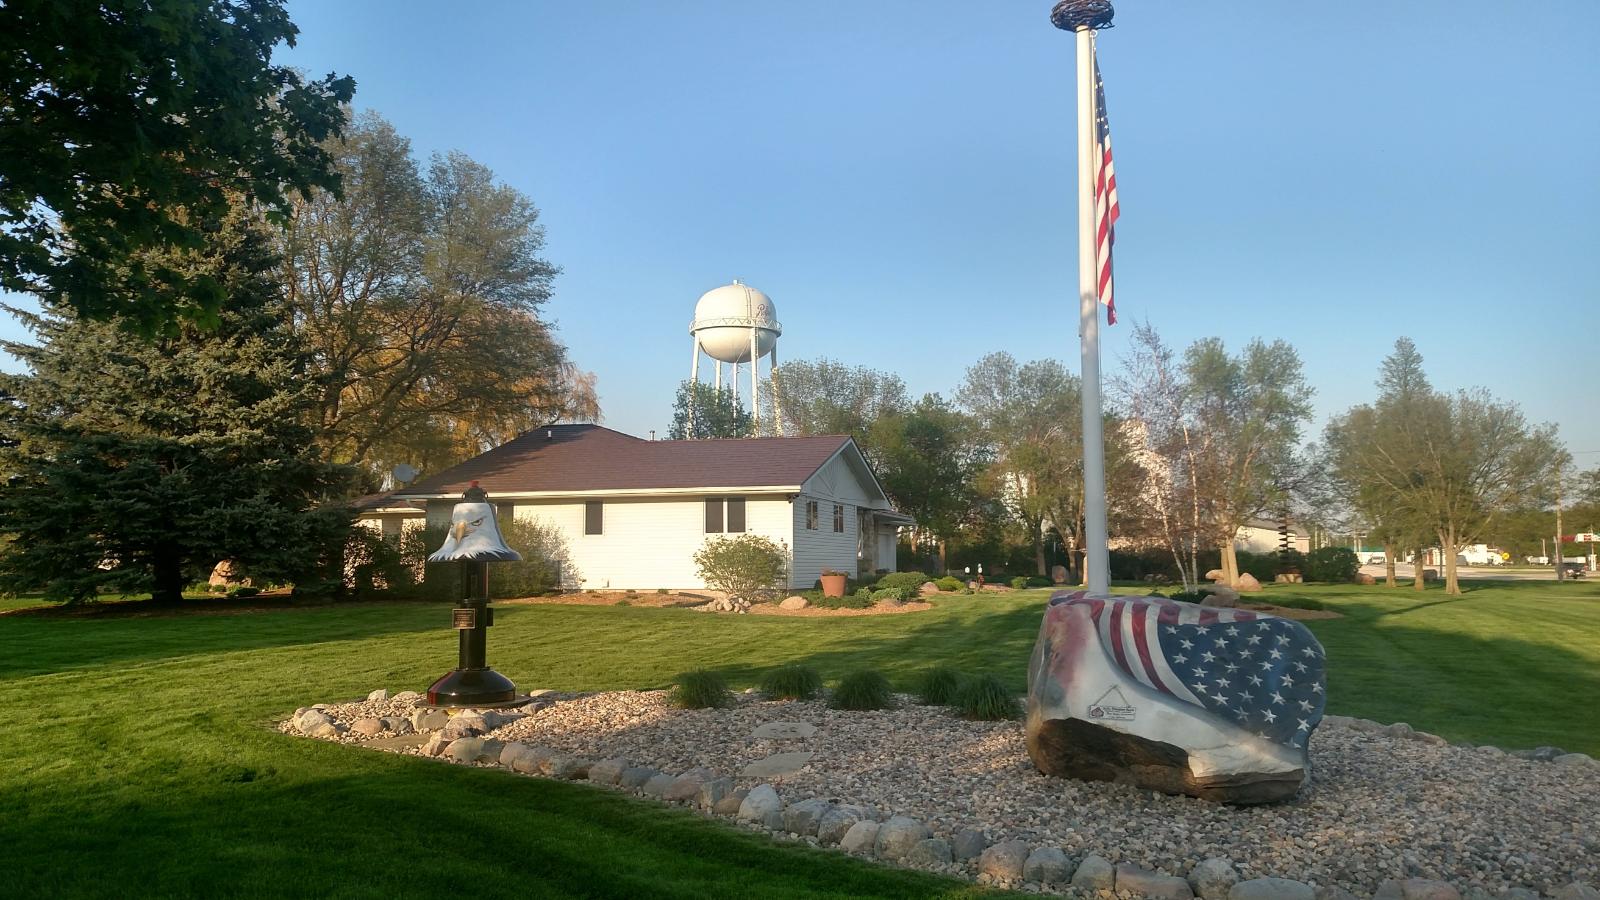
Rolfe is a small community in north-central Iowa’s Pocahontas County, known for its agricultural roots and calm, residential vibe. It sits along Highway 15, making it a reasonable location for commuters to nearby towns like Humboldt or Storm Lake. The town’s population is just over 500, and its housing stock is primarily older, single-family homes with relatively large lots. Prices here hovered in the low $80,000s for several years, and although recent fluctuations have drawn attention, the long-term average has remained stable. Rolfe is the kind of place where homes are typically owner-occupied, and price movements tend to reflect broader economic forces — like interest rates and fuel costs — rather than speculative buying. The brief spike in 2024 may have been influenced by broader regional demand, but the retreat in 2025 suggests that upward pressure was temporary.
The affordability here is compelling. At just over $82,000 in 2025, buyers can secure a home in a town with a public library, post office, and civic pride. Though employment options in Rolfe itself are limited, the surrounding region includes small businesses, farms, and public-sector jobs. For families, retirees, or investors, Rolfe offers housing stability without heavy competition. The swings in prices — though relatively minor — indicate that the market is active but not overheated. It’s ideal for cautious buyers who want affordability with a track record of resilience. Rolfe may not be Iowa’s fastest-growing town, but it remains a highly livable and economically sensible place to call home.
6. Humeston – 72.7% Home Price Increase Since 2018
- 2010: N/A
- 2011: N/A
- 2012: N/A
- 2013: N/A
- 2014: N/A
- 2015: N/A
- 2016: N/A
- 2017: N/A
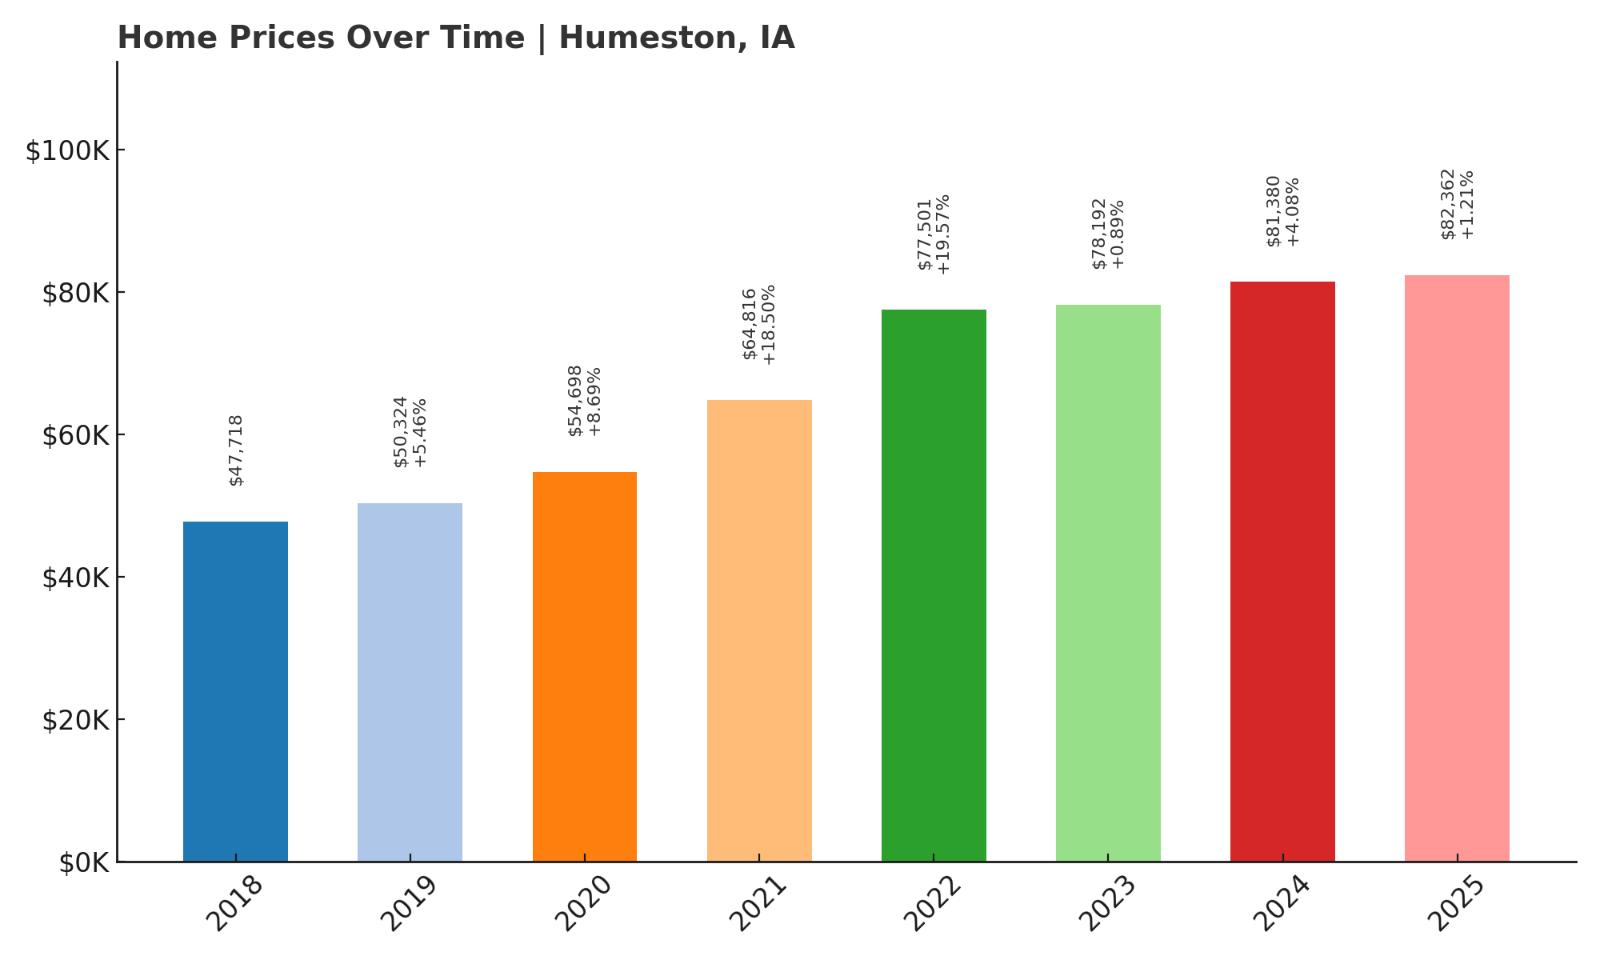
- 2018: $47,718.82
- 2019: $50,324.66 (+$2,605.83, +5.46% from previous year)
- 2020: $54,698.50 (+$4,373.85, +8.69% from previous year)
- 2021: $64,816.81 (+$10,118.31, +18.50% from previous year)
- 2022: $77,501.86 (+$12,685.05, +19.57% from previous year)
- 2023: $78,192.52 (+$690.66, +0.89% from previous year)
- 2024: $81,380.83 (+$3,188.31, +4.08% from previous year)
- 2025: $82,362.39 (+$981.56, +1.21% from previous year)
Humeston has seen an impressive 72.7% rise in home values since 2018. Growth was especially strong from 2020 to 2022, and while recent years have been more subdued, prices continue to climb. The 2025 value of $82,362 reflects a town that is still growing, though at a slower pace than during its initial boom.
Humeston – Big Appreciation in a Small Southern Iowa Town
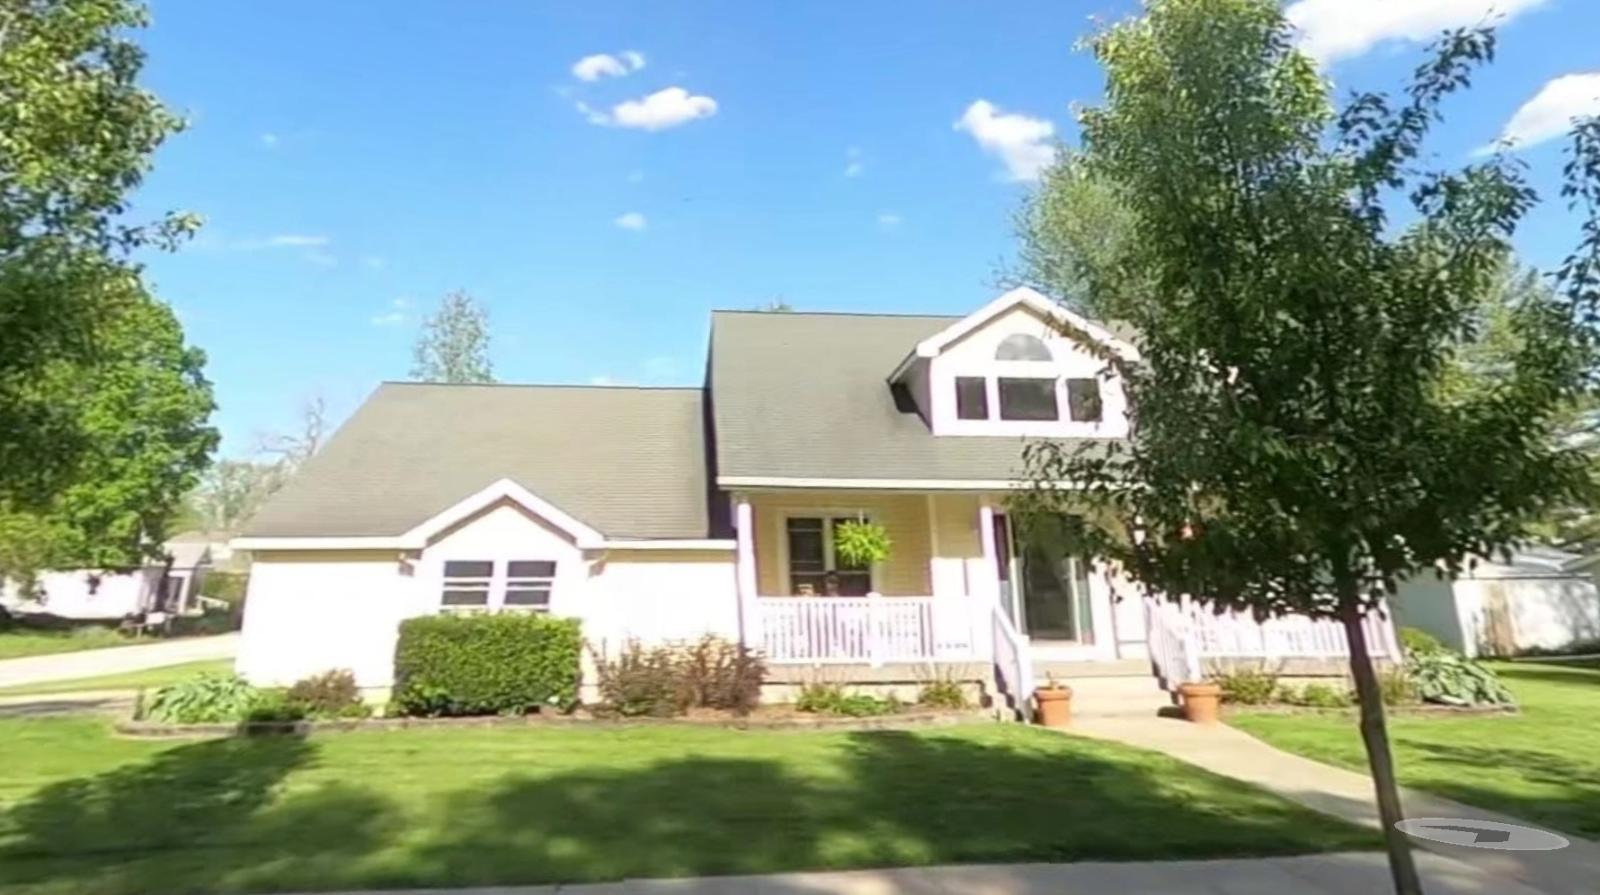
Located in Wayne County, just north of the Missouri border, Humeston is a rural Iowa town with a rich railroad history and an increasingly valuable housing stock. Though the population remains under 500, home prices have surged from the high $40Ks in 2018 to over $82K in 2025. This rapid appreciation shows that demand has found its way even into Iowa’s smallest corners. Much of the growth occurred during the pandemic housing boom, when people sought larger lots, lower prices, and quieter living. Humeston checks all those boxes. Its location along Highway 65 provides access to larger towns like Corydon and Chariton. This makes it a viable option for those willing to drive in exchange for cheaper housing. Schools are part of the Mormon Trail district, and while commercial offerings are limited, daily necessities can be found locally or in nearby cities.
The town’s built environment is a mix of modest mid-century homes, older wood-frame houses, and some newer builds on the outskirts. Its public infrastructure is adequate, and the community supports events like local fairs and town-wide yard sales. While Humeston may not be a destination town, it has proven to be a smart investment for homeowners who bought in before 2020. The steady price increases over seven years point to strong fundamentals rather than a speculative bubble. Even with growth, the market remains accessible to first-time buyers, families, or downsizers. For anyone who values long-term affordability and doesn’t mind a rural setting, Humeston is a standout performer with room to grow.
5. Rowan – 17% Home Price Decrease Since 2022
- 2010: N/A
- 2011: N/A
- 2012: N/A
- 2013: N/A
- 2014: N/A
- 2015: N/A
- 2016: N/A
- 2017: N/A
- 2018: N/A
- 2019: N/A
- 2020: N/A
- 2021: N/A
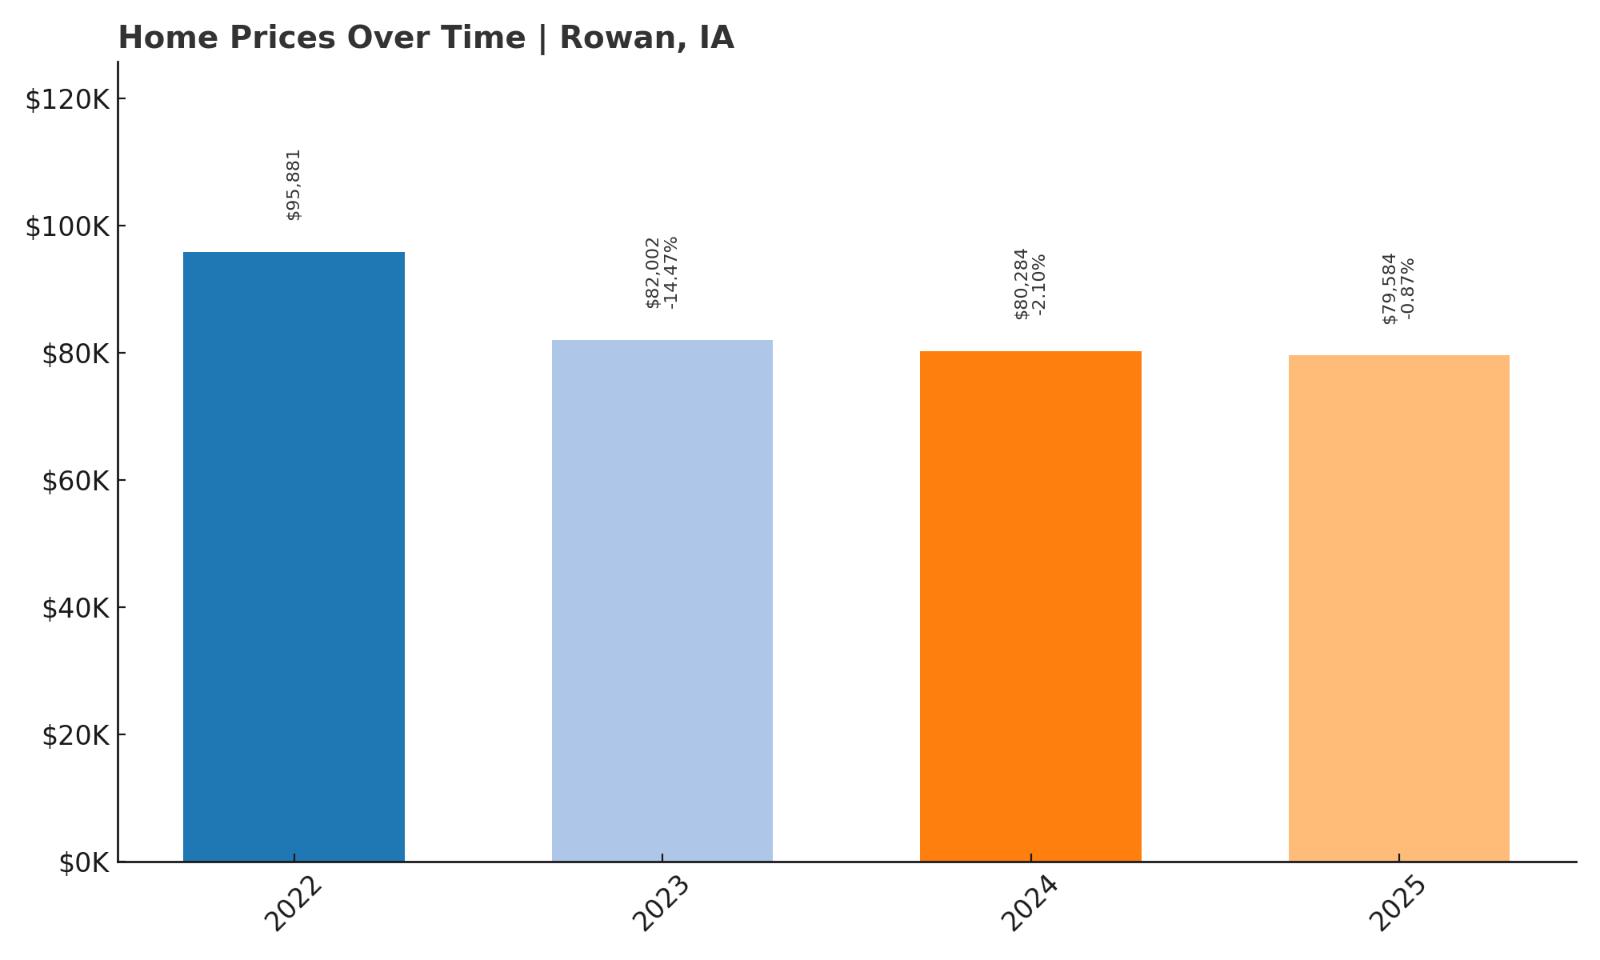
- 2022: $95,881.26
- 2023: $82,002.99 (-$13,878.28, -14.47% from previous year)
- 2024: $80,284.67 (-$1,718.32, -2.10% from previous year)
- 2025: $79,584.30 (-$700.37, -0.87% from previous year)
Rowan has seen a substantial price correction since 2022, with values falling over 17% in just three years. The most significant drop came in 2023, followed by smaller declines in the years that followed. The overall trend reflects a softening market, but current prices still hover near $80,000 — keeping Rowan well within the affordable range.
Rowan – A Cooling Market With Low Entry Points
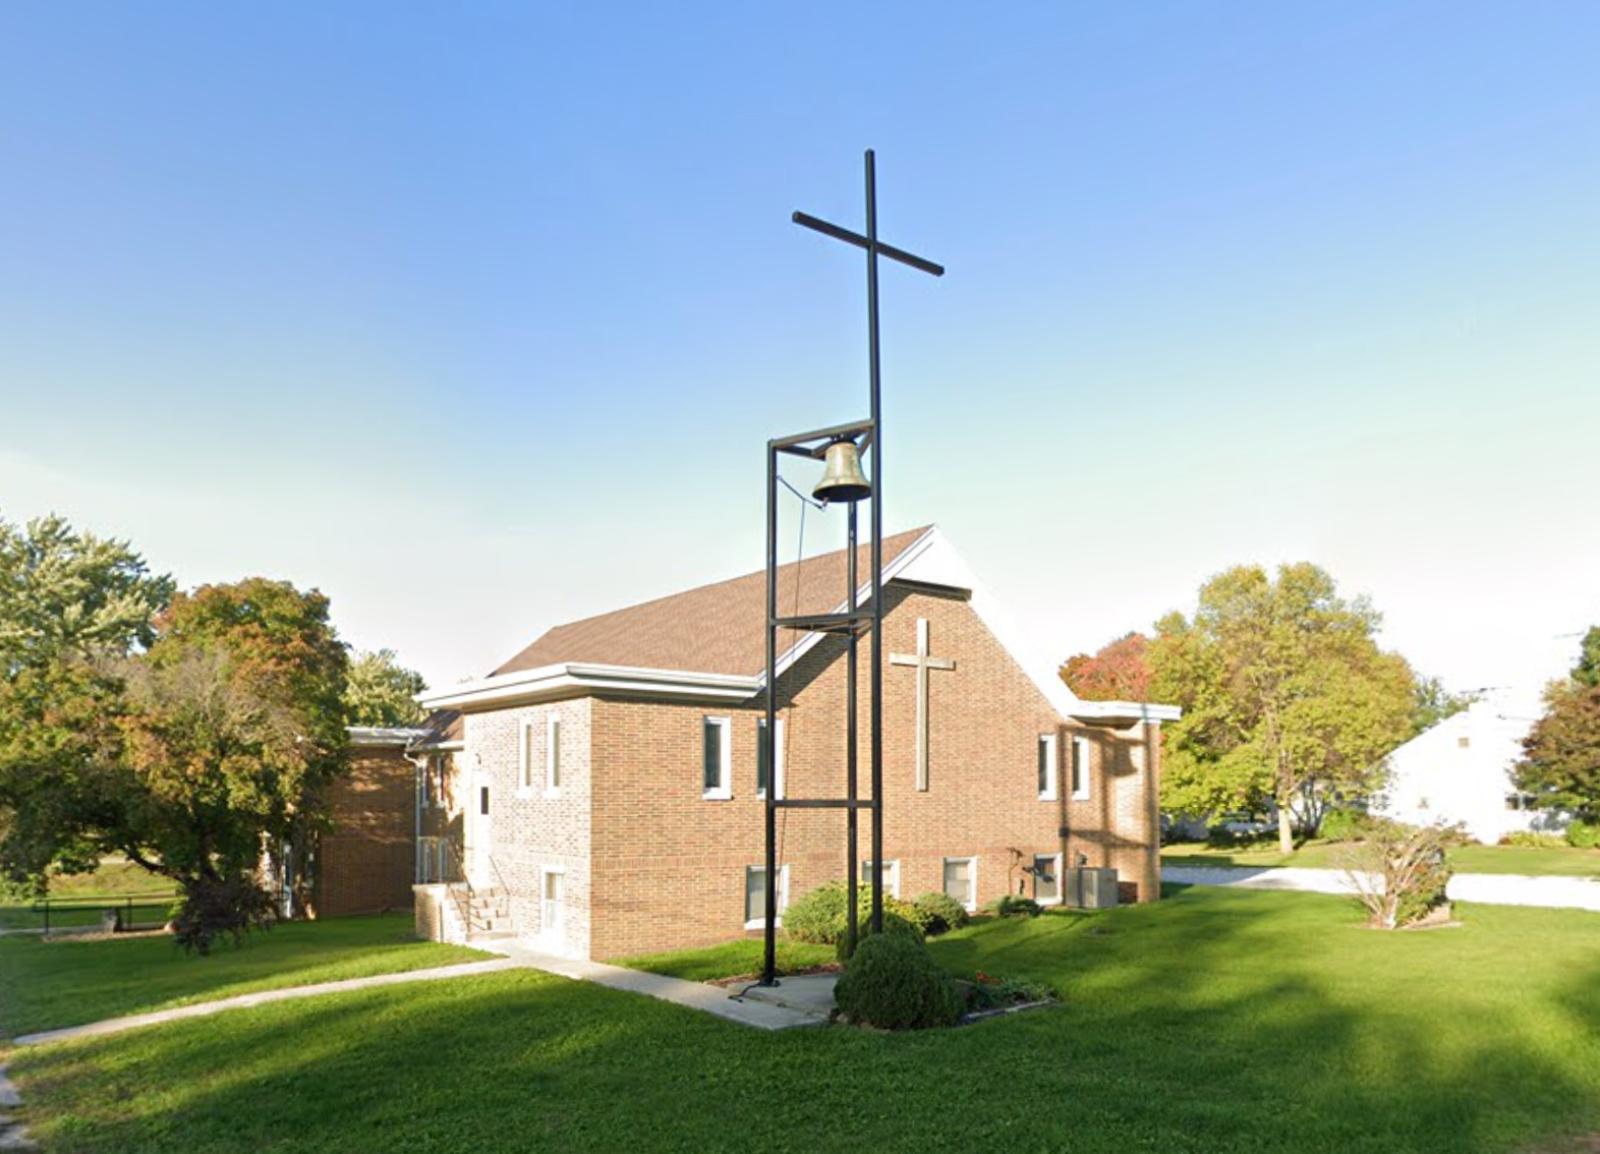
Rowan, a town of under 200 residents in Wright County, sits along the Iowa River and is surrounded by fertile farmland. It’s the kind of place where most homes are paid off, traffic is light, and community events are local staples. While it once saw home values peak close to $96,000 in 2022, the market has cooled considerably. Many factors could explain this, from declining buyer interest post-pandemic to broader economic uncertainty affecting rural Iowa markets. Rowan is not alone in this reversal, but its sharp dip is one of the more notable among towns in this roundup. Still, for a potential homeowner or investor, the price drop might be less a warning sign and more a signal of opportunity — a chance to buy in low during a natural market cycle.
Housing in Rowan consists mostly of single-story homes with ample yard space and older architecture, often requiring some renovation but offering exceptional value. The community includes a library, churches, and access to parks and riverside activities. Larger towns like Clarion or Belmond are about 15–20 minutes away by car, offering access to shopping, jobs, and healthcare. For those willing to commute, Rowan is a viable option that trades convenience for tranquility and cost savings. The decline in home prices may reflect temporary conditions rather than long-term depreciation, and the town’s low starting price means recovery — when it comes — could deliver solid value. Buyers looking for a quiet, cost-effective foothold in Iowa real estate would be wise not to overlook Rowan.
4. Cincinnati – 12.3% Home Price Decrease Since 2022
- 2010: N/A
- 2011: N/A
- 2012: N/A
- 2013: N/A
- 2014: N/A
- 2015: N/A
- 2016: N/A
- 2017: N/A
- 2018: N/A
- 2019: N/A
- 2020: N/A
- 2021: N/A
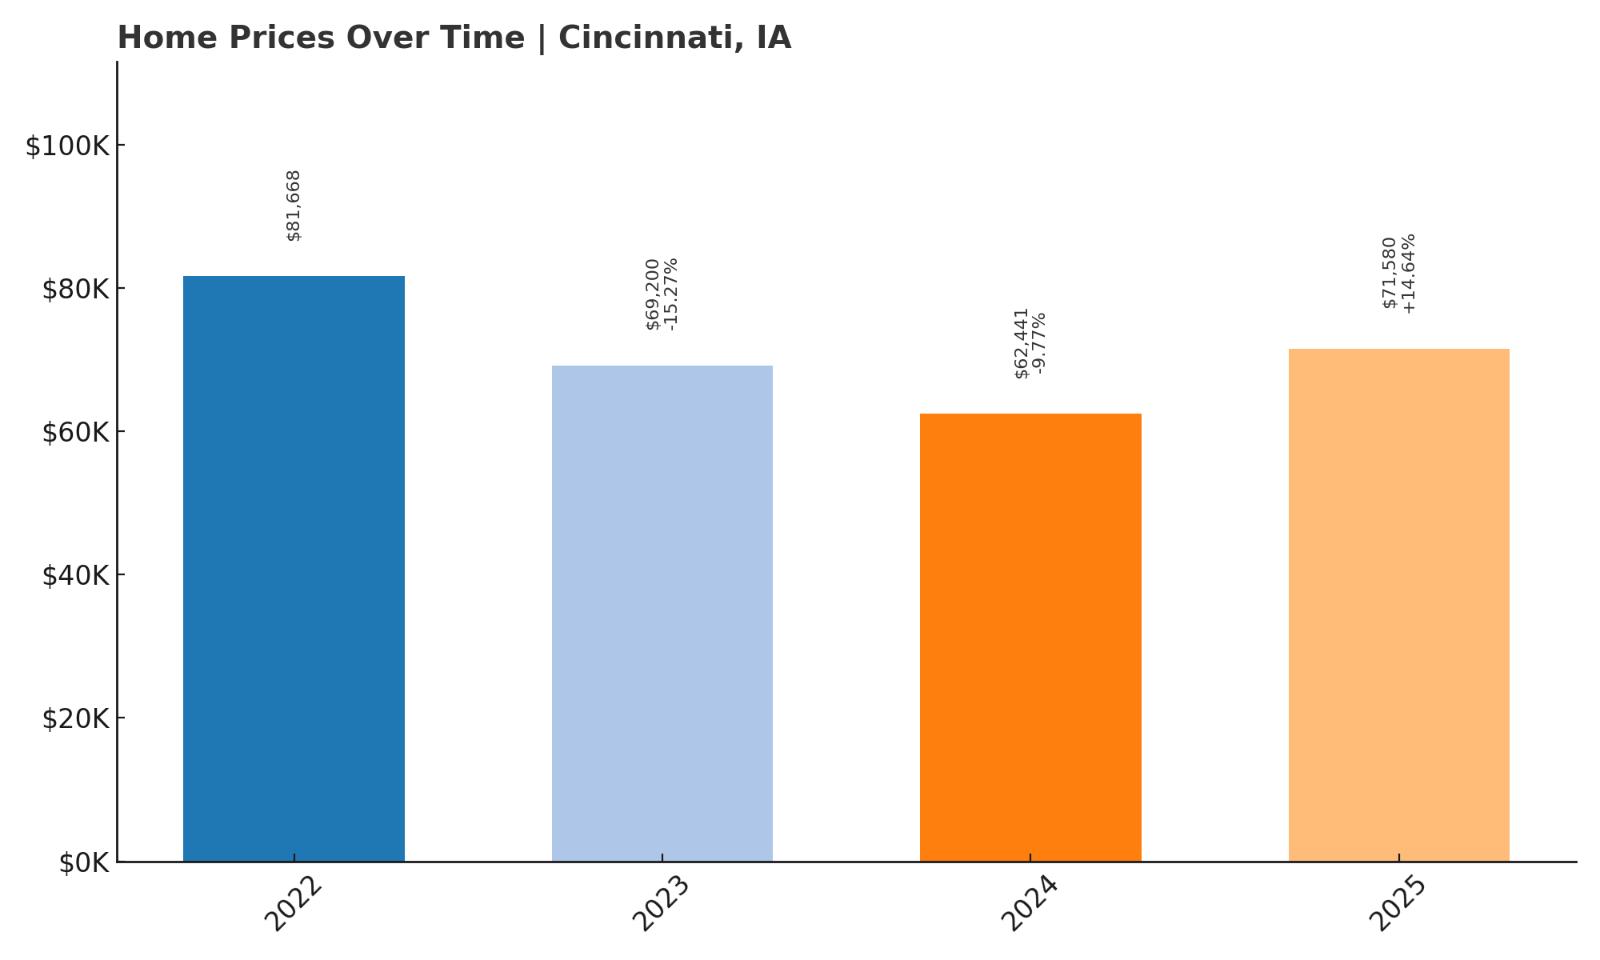
- 2022: $81,668.61
- 2023: $69,200.36 (-$12,468.25, -15.27% from previous year)
- 2024: $62,441.43 (-$6,758.93, -9.77% from previous year)
- 2025: $71,580.44 (+$9,139.01, +14.64% from previous year)
Cincinnati saw home prices fall sharply between 2022 and 2024, dropping from $81,668 to just over $62,000. But the town saw a strong rebound in 2025, with a nearly 15% price increase. Even with that recovery, home values are still down 12.3% from their 2022 peak, highlighting both volatility and affordability.
Cincinnati – A Volatile but Affordable Market in Southern Iowa
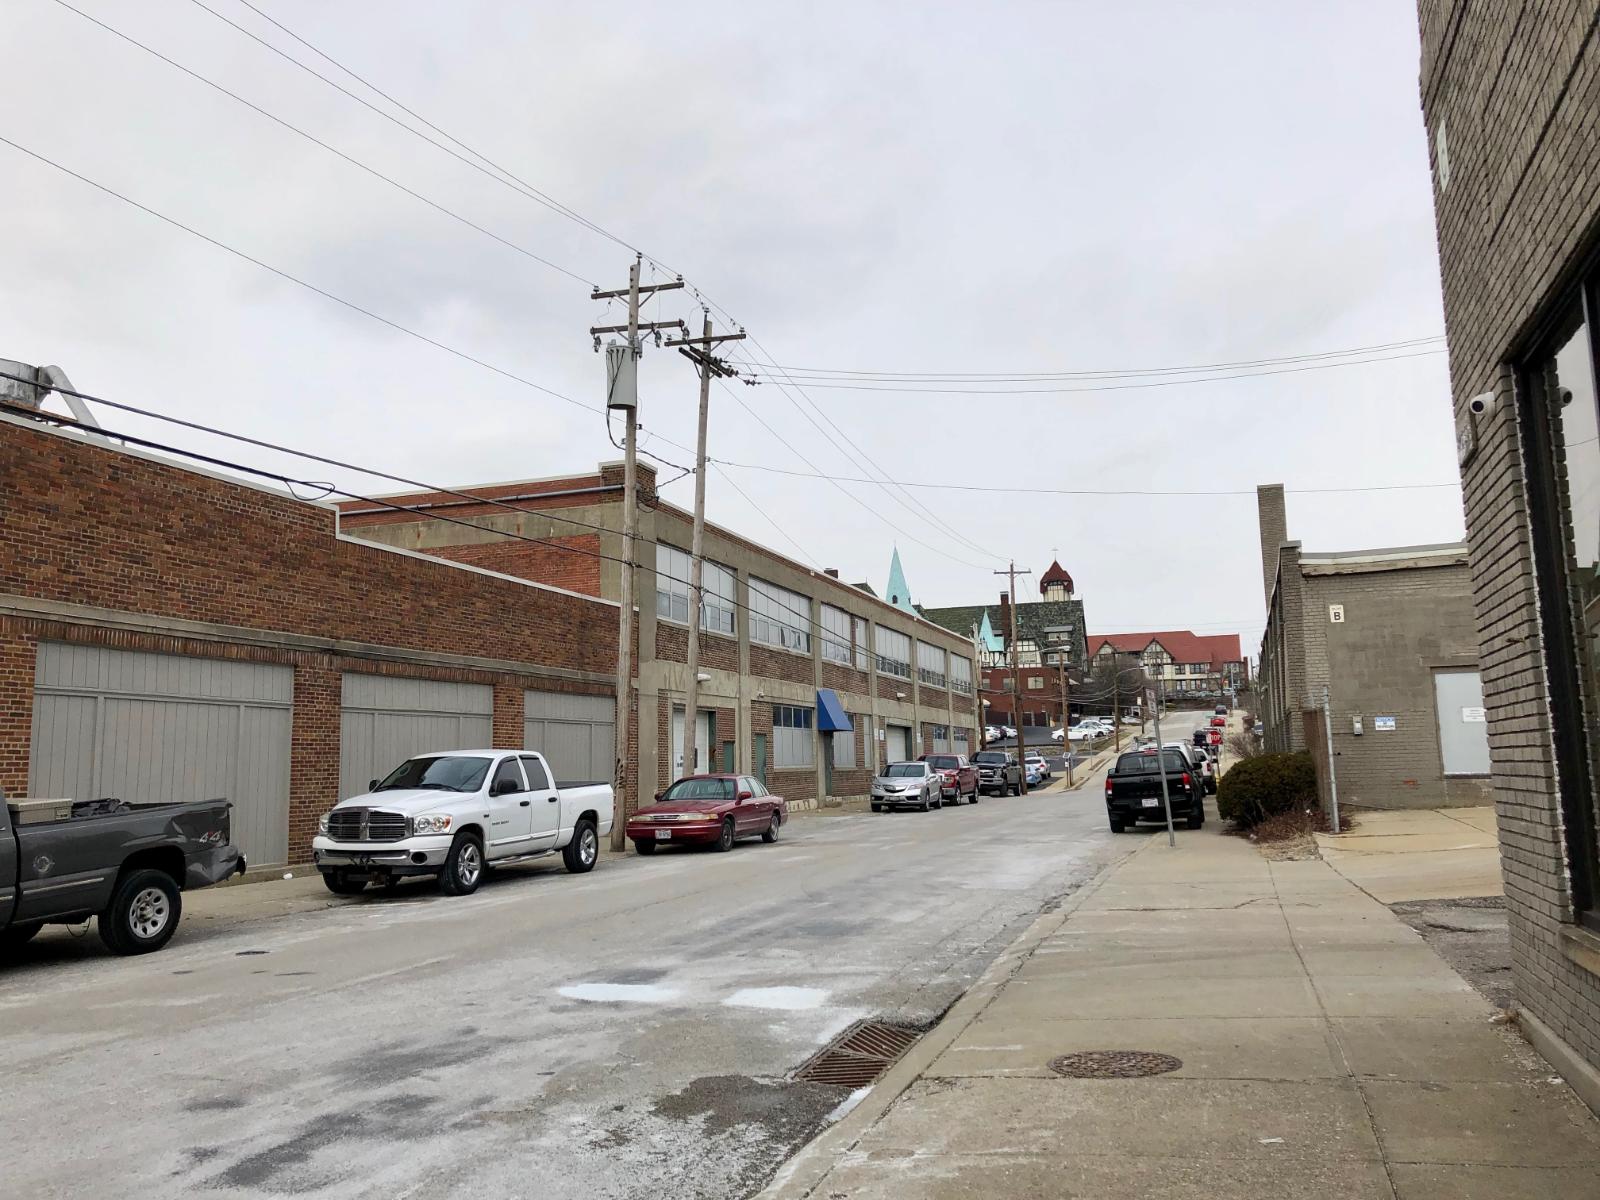
Cincinnati, Iowa, located in Appanoose County near the Missouri border, is a town with a rich coal mining history and a current population of just under 300. Like many small towns in southern Iowa, it saw a dramatic rise in home prices during the pandemic housing surge, followed by a multi-year correction. The drop between 2022 and 2024 was among the steepest in the state, but 2025 brought a surprise uptick, hinting that buyers may be circling back now that prices have reached new lows. At $71,580, the average home price remains well below the state median and offers considerable value, especially for buyers willing to accept some uncertainty in return for a low barrier to entry. Homes in Cincinnati are typically modest in size, many built before 1970, and tend to come with larger-than-average lots for gardening, pets, or additional buildings like sheds or workshops.
The town’s location near Centerville and Lake Rathbun enhances its livability. Cincinnati is close to outdoor recreation, including boating, hiking, and fishing, which adds to its appeal, particularly in the warmer months. The school system is part of the Centerville Community School District, giving residents access to more robust educational services than one might expect in a town of this size. For those considering a home here, the market’s recent turbulence is important to keep in mind — but the recent price rebound suggests resilience. If values continue to recover over the next few years, 2025 could represent a prime window to buy at a relative low. Cincinnati may not offer fast-paced growth, but for a calm lifestyle and a cheap place to live with rebound potential, it deserves a close look.
3. Gilmore City – 19.1% Home Price Increase Since 2022
- 2010: N/A
- 2011: N/A
- 2012: N/A
- 2013: N/A
- 2014: N/A
- 2015: N/A
- 2016: N/A
- 2017: N/A
- 2018: N/A
- 2019: N/A
- 2020: N/A
- 2021: N/A
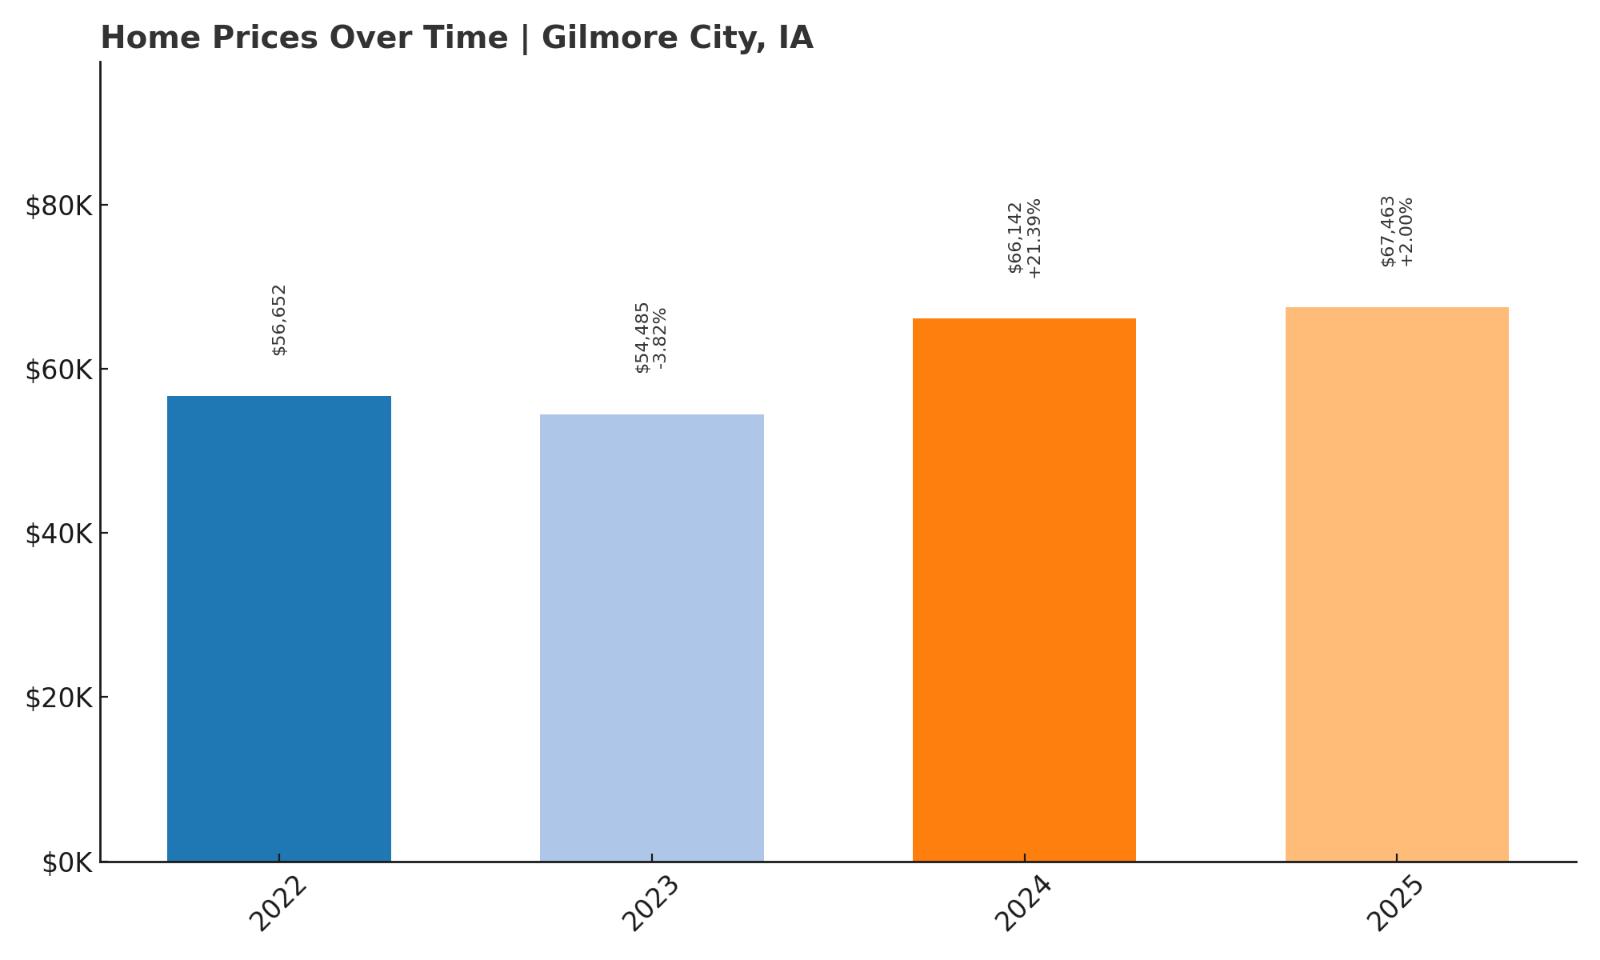
- 2022: $56,652.00
- 2023: $54,485.87 (-$2,166.13, -3.82% from previous year)
- 2024: $66,142.25 (+$11,656.39, +21.39% from previous year)
- 2025: $67,463.71 (+$1,321.46, +2.00% from previous year)
Gilmore City’s home prices have climbed more than 19% since 2022, showing a resilient rebound after a small dip in 2023. Most of the appreciation occurred in 2024, with a slight gain continuing into 2025. Prices remain under $70,000, putting it among the most affordable towns in Iowa despite recent growth.
Gilmore City – Steady Comeback in a Tiny Humboldt County Town
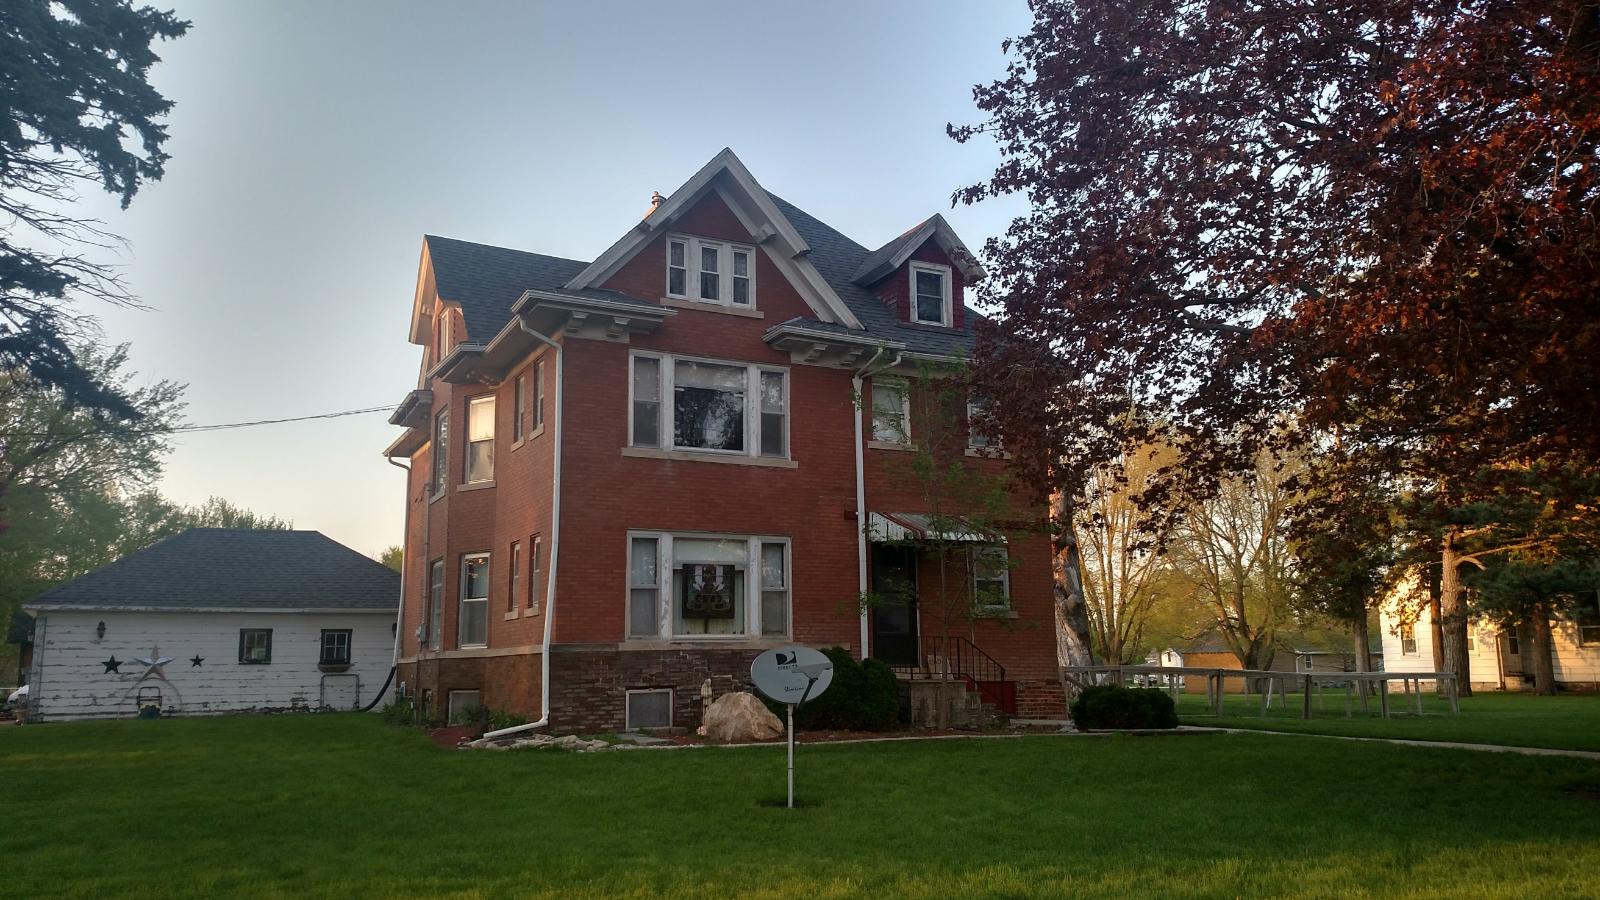
Gilmore City, straddling the border of Humboldt and Pocahontas counties, is one of Iowa’s smallest incorporated communities, with a population of around 500. It sits just west of Humboldt and north of Fort Dodge, offering modest access to commercial centers while maintaining the peace of small-town living. Once known for its gypsum mining, the town today is largely residential and agricultural. Its recent housing trends reflect a pattern seen in many rural Iowa towns — a short-lived dip in 2023 followed by a price correction driven by renewed buyer interest and continued scarcity of available listings. Despite modest gains in the last two years, homes remain priced at under $70,000 on average, making Gilmore City exceptionally affordable for nearly any buyer demographic. With a consistent history of stable ownership and minimal turnover, prices tend to move slowly, which can benefit long-term homeowners who aren’t looking to flip or trade quickly.
The town itself has limited services — a few churches, a post office, a park, and a library — but its proximity to larger regional hubs offsets some of those limitations. The community’s quiet streets and vintage homes give it a charming but no-frills atmosphere. It’s not uncommon for homes here to feature large yards, detached garages, and structures dating back to the early 20th century. Buyers looking for simplicity and privacy are likely to find both here. Gilmore City’s affordability also positions it as a potential base for retirees, remote workers, or investors interested in rural rentals. While economic expansion is unlikely to be dramatic, the recent price increases suggest a gentle upward trajectory that could continue for those willing to buy and hold. Overall, it’s a market with low cost and low volatility — ideal for budget-minded buyers who value space and stability.
2. Lohrville – 50.6% Home Price Increase Since 2018
- 2010: N/A
- 2011: N/A
- 2012: N/A
- 2013: N/A
- 2014: N/A
- 2015: N/A
- 2016: N/A
- 2017: N/A
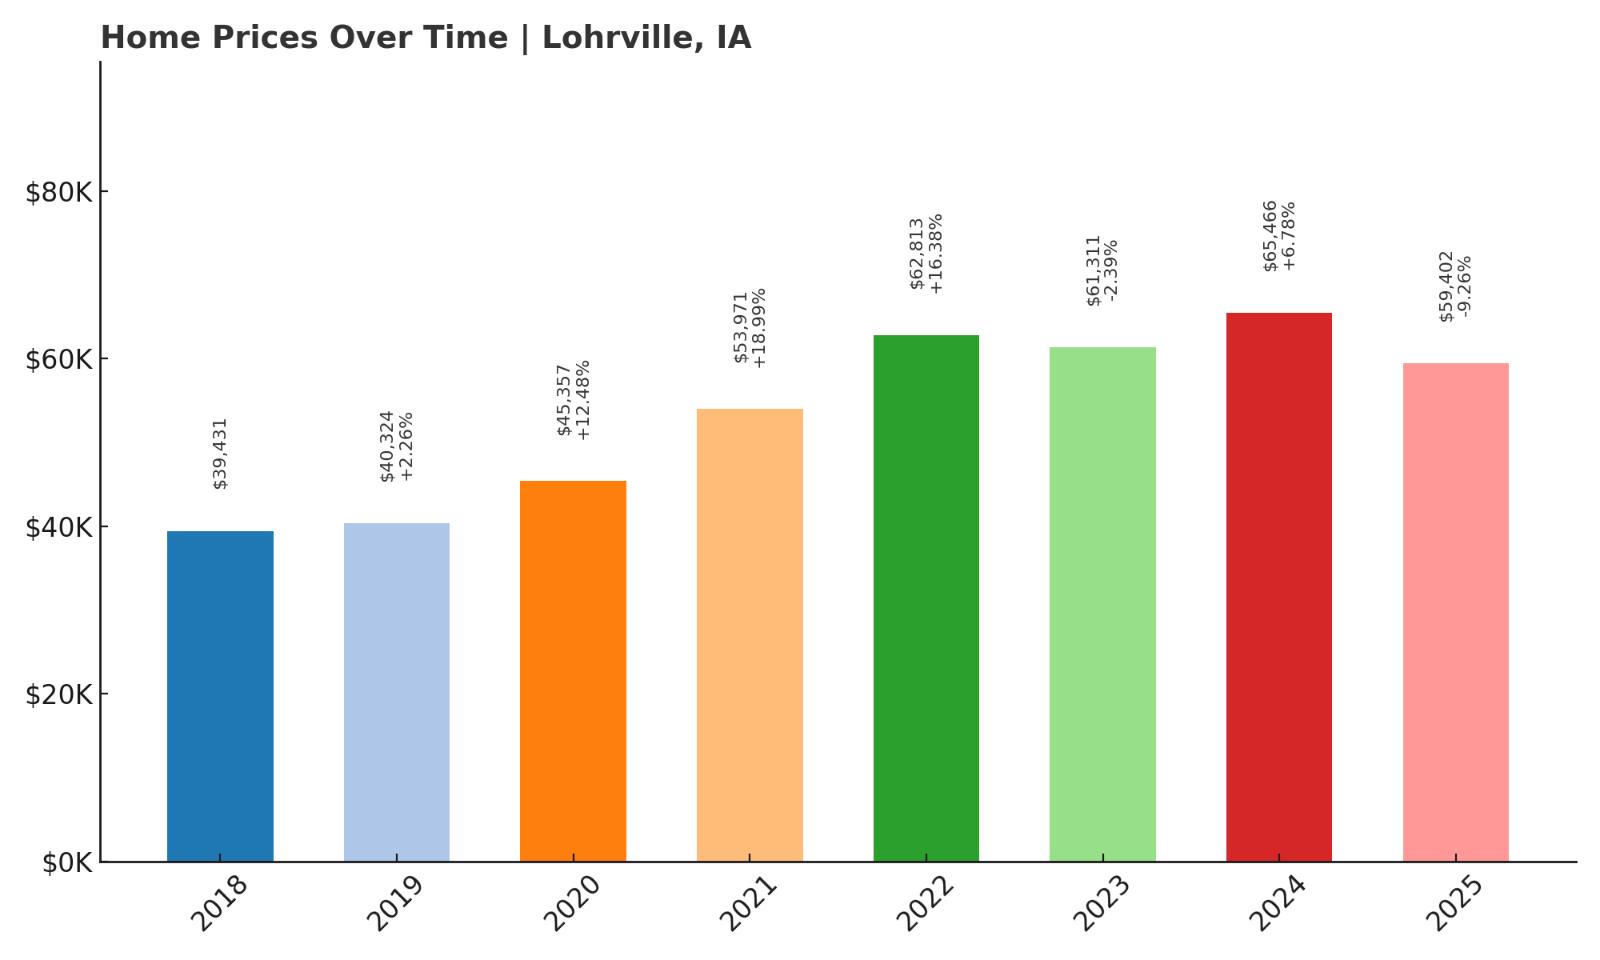
- 2018: $39,431.77
- 2019: $40,324.31 (+$892.55, +2.26% from previous year)
- 2020: $45,357.89 (+$5,033.57, +12.48% from previous year)
- 2021: $53,971.98 (+$8,614.10, +18.99% from previous year)
- 2022: $62,813.31 (+$8,841.33, +16.38% from previous year)
- 2023: $61,311.13 (-$1,502.18, -2.39% from previous year)
- 2024: $65,466.27 (+$4,155.14, +6.78% from previous year)
- 2025: $59,402.79 (-$6,063.48, -9.26% from previous year)
Lohrville’s home values rose sharply between 2018 and 2022, increasing by over 50%, but have since declined for two out of the last three years. Still, even with the recent retreat, prices remain well above their pre-pandemic levels, and average homes in 2025 cost under $60,000.
Lohrville – Affordable Homes With Room to Rebound
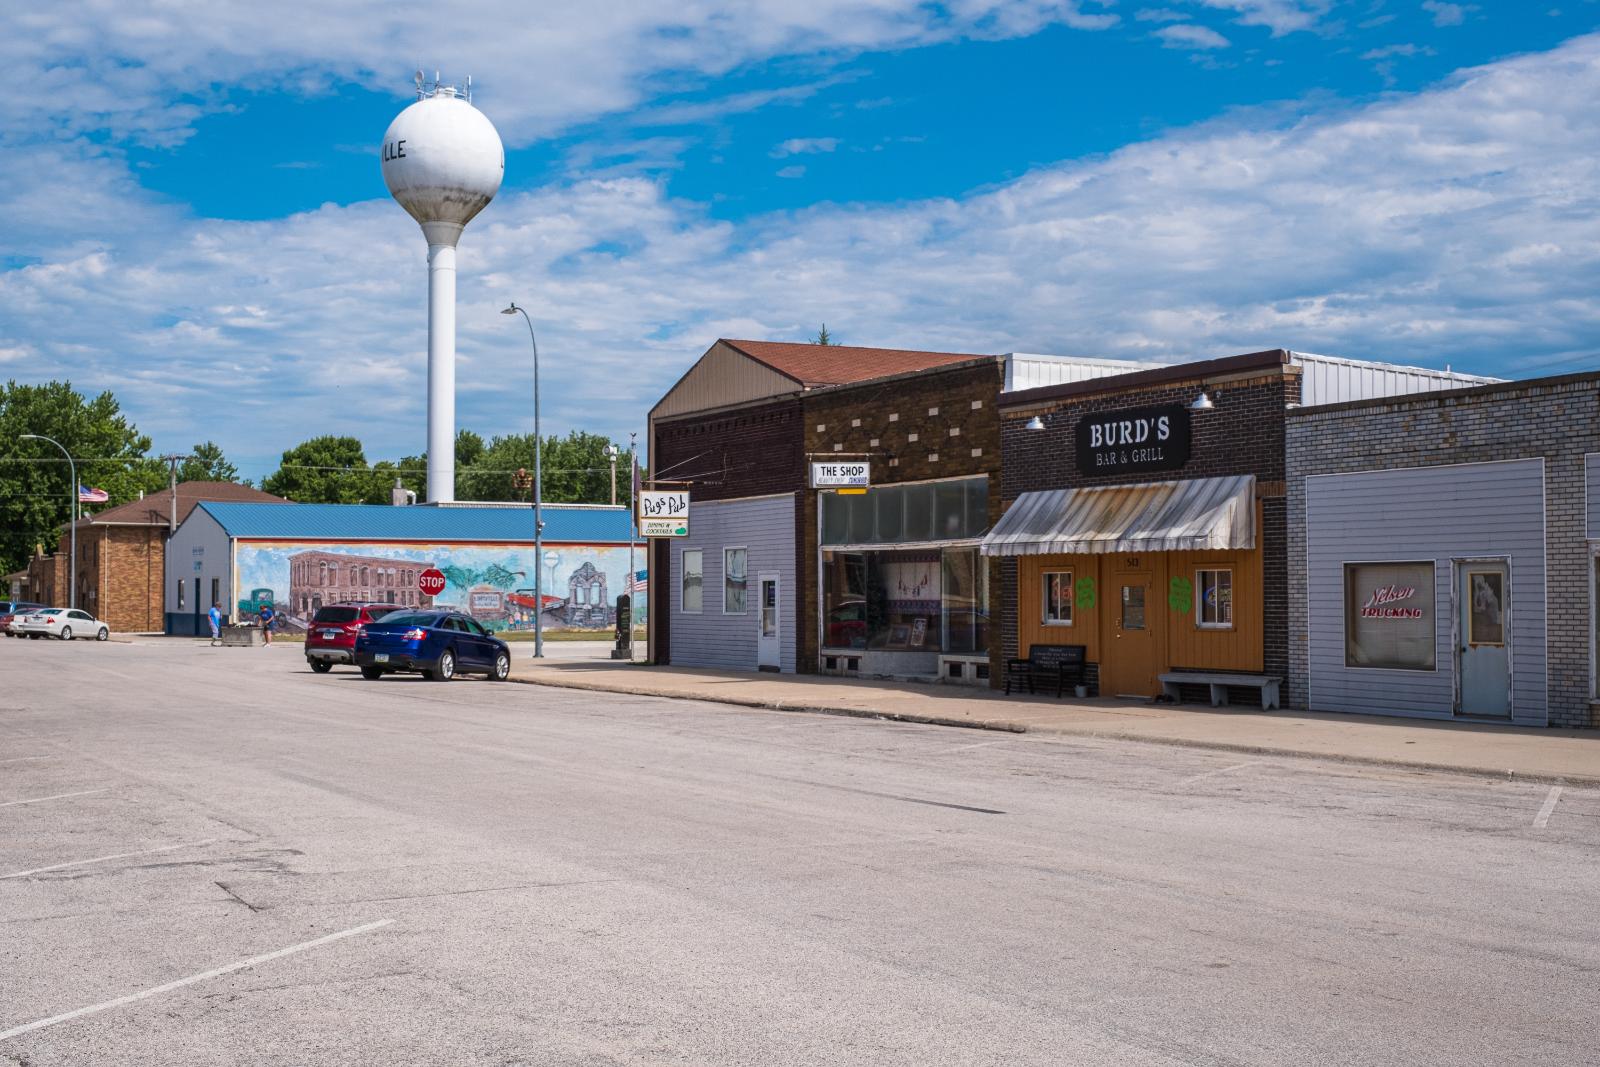
Lohrville, in Calhoun County, is a tight-knit rural town with a population under 400. Known as the “Better Backyard Town” for its generous lot sizes and quiet streets, Lohrville offers affordability that is hard to match anywhere in Iowa. The housing market here boomed between 2018 and 2022, nearly doubling in value during that time. That surge may have been fueled by interest in rural properties during the pandemic as well as limited inventory. However, prices have since cooled, dropping by 9% in 2025 after modest gains the year before. At just under $60,000, the current average price is extremely accessible for buyers who want a place of their own with plenty of space, whether they’re downsizing, starting out, or relocating from a higher-cost area.
Lohrville is located about 30 minutes southwest of Fort Dodge and offers basic amenities such as a public library, a city park, and access to the Sauk Rail Trail — a 33-mile trail system for walking and biking. While there aren’t many retail outlets within town, nearby Rockwell City and Carroll provide groceries, shopping, and health services. The housing stock consists of older single-family homes, many on quarter- or half-acre lots, and the real estate market tends to move slowly. For those with a long-term view, Lohrville’s low prices and potential for recovery make it one of the most intriguing entries in this ranking. Its gentle pace of life and strong sense of community appeal to those tired of urban congestion, and the current dip could offer a prime opportunity to buy low in a town with a record of meaningful appreciation.
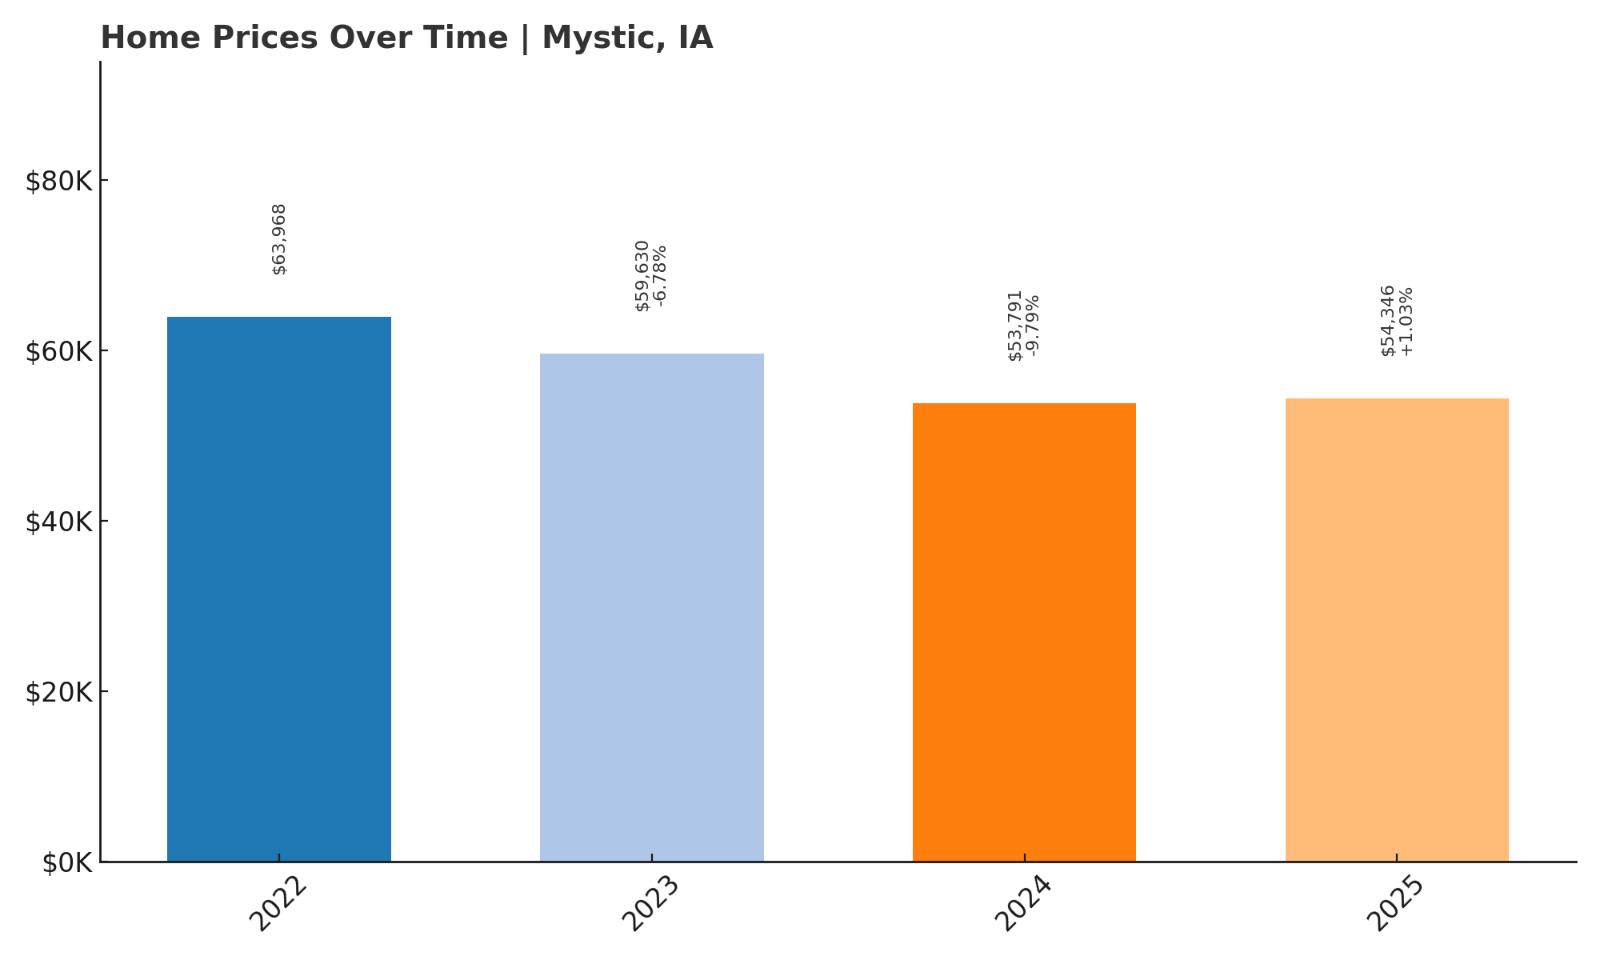
1. Mystic – 15% Home Price Decrease Since 2022
- 2010: N/A
- 2011: N/A
- 2012: N/A
- 2013: N/A
- 2014: N/A
- 2015: N/A
- 2016: N/A
- 2017: N/A
- 2018: N/A
- 2019: N/A
- 2020: N/A
- 2021: N/A
- 2022: $63,968.44
- 2023: $59,630.26 (-$4,338.17, -6.78% from previous year)
- 2024: $53,791.03 (-$5,839.23, -9.79% from previous year)
- 2025: $54,346.61 (+$555.57, +1.03% from previous year)
Mystic’s home prices have fallen about 15% since 2022, making it the most affordable town in Iowa on this list. After two consecutive years of steep declines, 2025 saw a modest uptick, suggesting that the market may be bottoming out.
Mystic – Iowa’s Cheapest Market With Deep Historical Roots
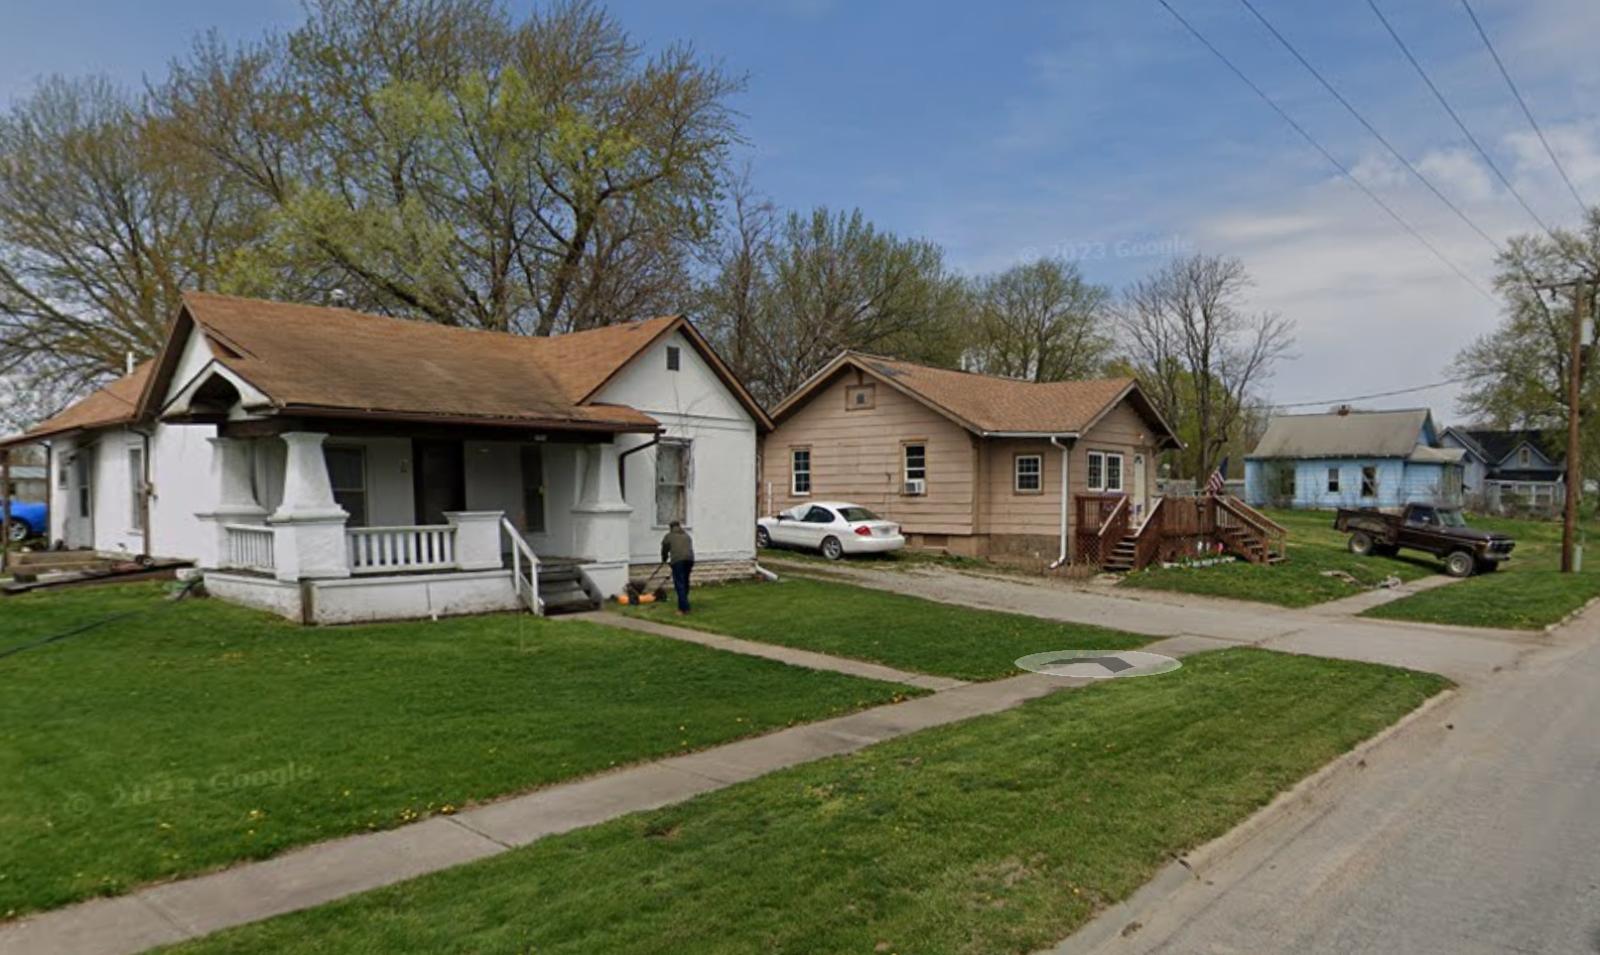
Mystic, nestled in Appanoose County in southern Iowa, was once a bustling coal mining town. Today, it’s a quiet residential community with around 400 residents, offering some of the lowest home prices in the entire state. Mystic’s affordability is unmatched — the average home price in 2025 is just over $54,000. The market has been in retreat since 2022, shedding about 15% of its value, which may reflect overcorrection after earlier gains or simply reflect regional economic challenges. Despite this downturn, Mystic offers low property taxes, large lots, and proximity to natural beauty. It’s located near Rathbun Lake and the Chariton River, which draw visitors and locals alike for fishing, boating, and camping.
While Mystic no longer enjoys the economic vibrancy of its coal mining past, it has retained many of its historic homes, some over 100 years old. These properties are often well-built but may require updates — an opportunity for buyers interested in restoration or long-term ownership. The town is within driving distance of Centerville, which offers schools, medical services, and retail options. Mystic’s housing market is not for flippers or short-term speculators — it’s a market suited to those with patience and a desire to plant roots. With prices as low as they are now, and signs that values may be stabilizing, 2025 could represent a rare entry point into homeownership for budget-conscious buyers. For those who want peace, space, and unmatched pricing, Mystic stands as the most affordable housing destination in Iowa today.