
Massachusetts doesn’t exactly have a reputation for bargain real estate—but if you know where to look, deals still exist. According to the latest data from the Zillow Home Value Index, a handful of towns across the Bay State are bucking the luxury trend. These 19 communities offer surprisingly affordable home prices in 2025, often paired with local charm, green space, and the kind of character that money can’t always buy.
19. Erving – 67% Home Price Increase Since 2010
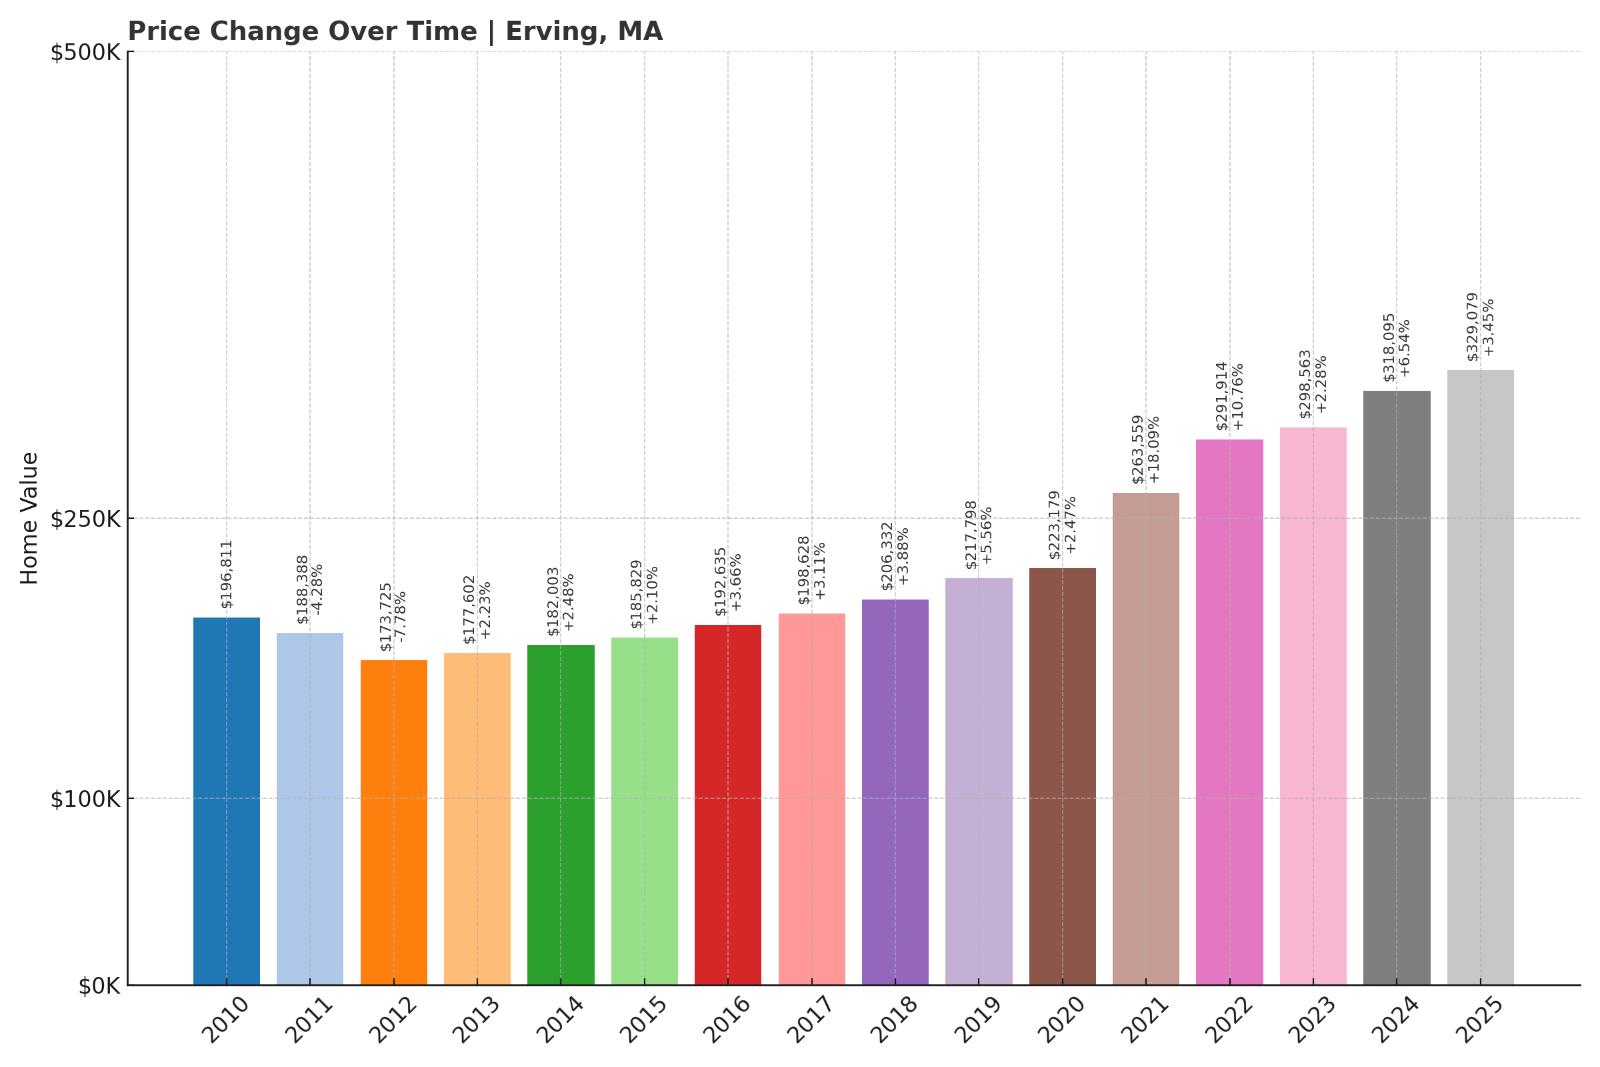
- 2010: $196,811
- 2011: $188,388 ($-8,423, -4.28% from previous year)
- 2012: $173,725 ($-14,663, -7.78% from previous year)
- 2013: $177,602 (+$3,877, +2.23% from previous year)
- 2014: $182,003 (+$4,401, +2.48% from previous year)
- 2015: $185,829 (+$3,826, +2.10% from previous year)
- 2016: $192,635 (+$6,806, +3.66% from previous year)
- 2017: $198,628 (+$5,993, +3.11% from previous year)
- 2018: $206,332 (+$7,704, +3.88% from previous year)
- 2019: $217,798 (+$11,466, +5.56% from previous year)
- 2020: $223,179 (+$5,381, +2.47% from previous year)
- 2021: $263,559 (+$40,380, +18.09% from previous year)
- 2022: $291,914 (+$28,355, +10.76% from previous year)
- 2023: $298,563 (+$6,649, +2.28% from previous year)
- 2024: $318,095 (+$19,532, +6.54% from previous year)
- 2025: $329,079 (+$10,984, +3.45% from previous year)
Erving’s housing market has grown steadily since 2010, with a 67% rise in home values over 15 years. Most of that increase came after 2020, with strong double-digit growth in 2021 and 2022. Despite this, average prices remain among the lowest in the state.
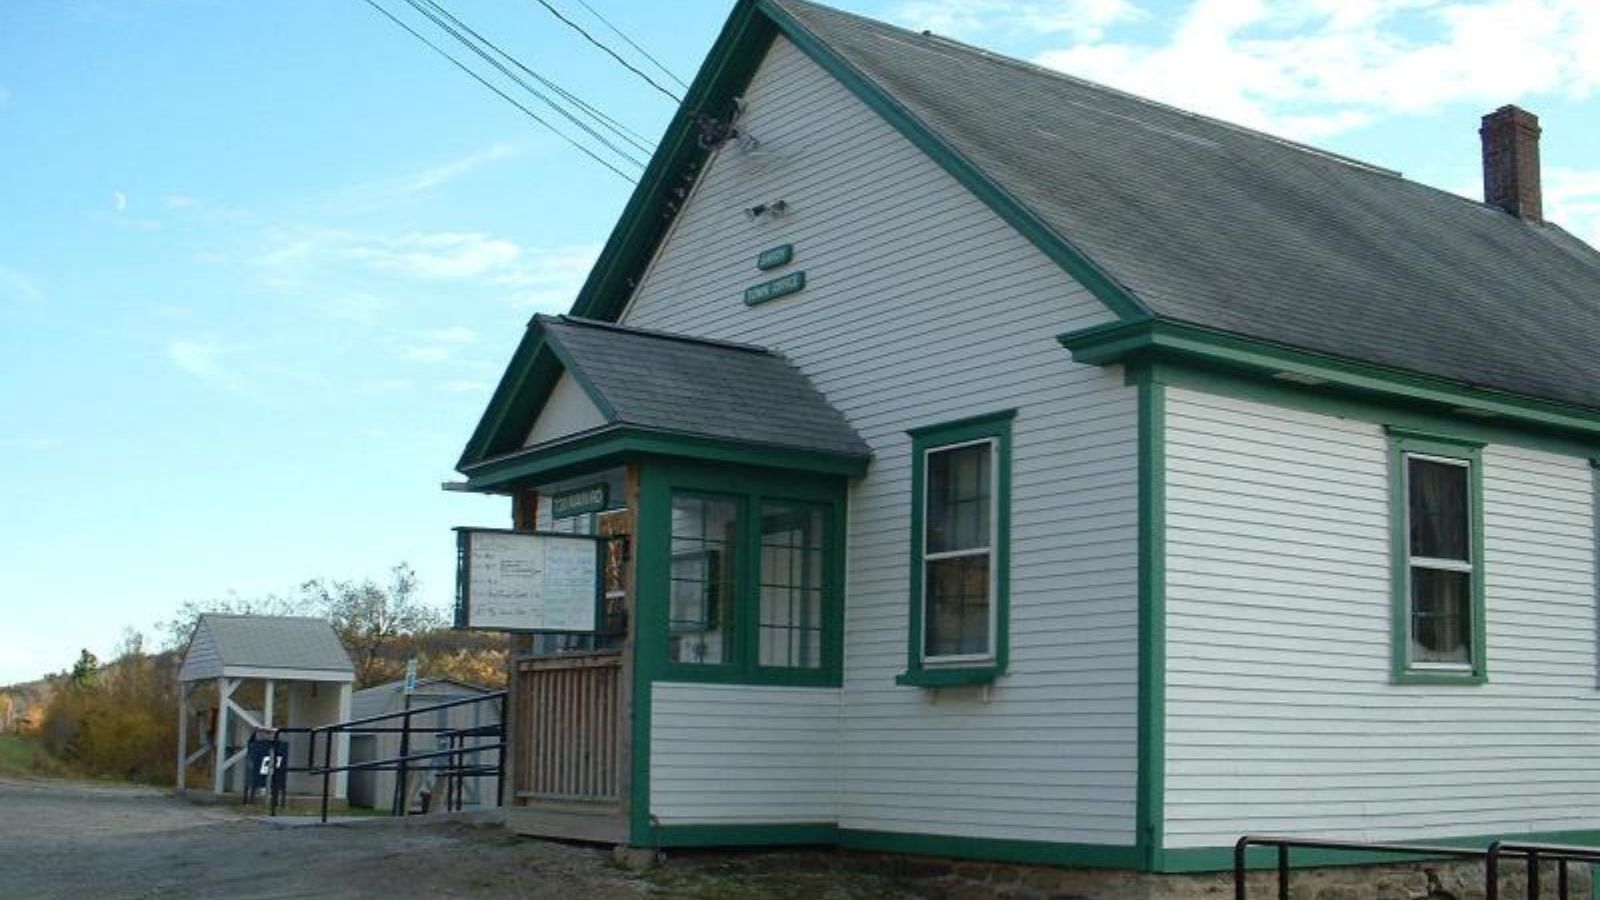
Erving – Small-Town Charm and Steady Demand
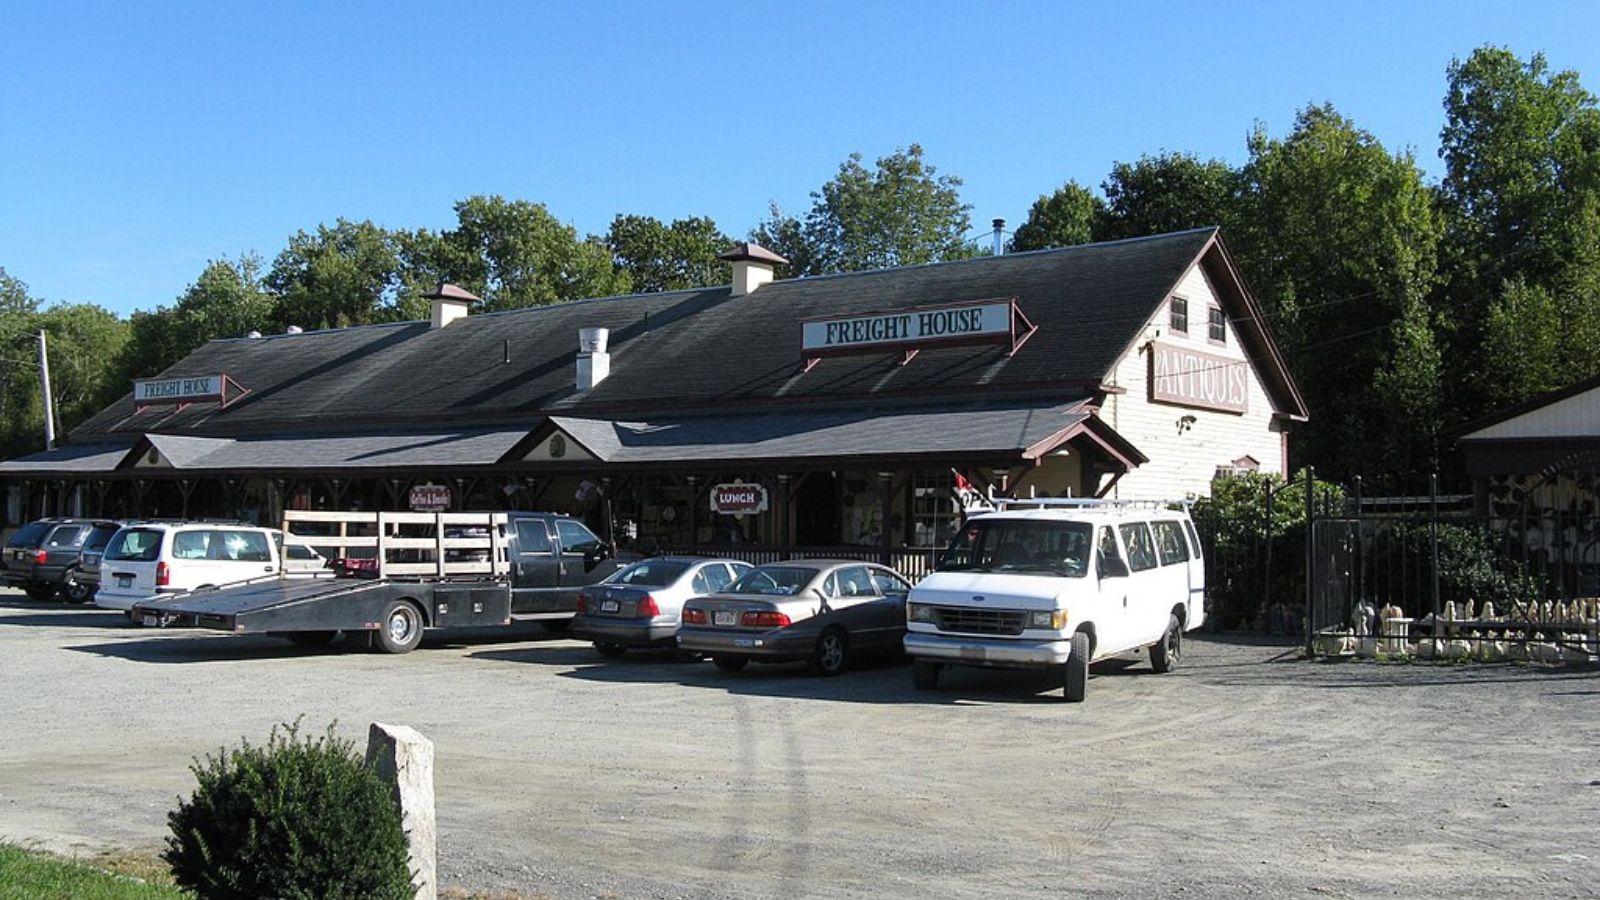
Located in Franklin County, Erving is a quiet town nestled along the Millers River. Its affordability is bolstered by modest housing stock and a rural setting that appeals to buyers seeking privacy and nature. The 2025 median price of $329,079 is still far below the state average.
With stable year-over-year increases, Erving shows how consistent demand in a desirable rural area can produce long-term appreciation without sharp spikes. Its proximity to Route 2 makes it accessible for commuters heading to Greenfield or even Worcester, helping sustain interest without pricing out buyers.
18. Savoy – 60.7% Home Price Increase Since 2020

- 2010: N/A
- 2011: N/A
- 2012: N/A
- 2013: N/A
- 2014: N/A
- 2015: N/A
- 2016: N/A
- 2017: N/A
- 2018: N/A
- 2019: N/A
- 2020: $204,076
- 2021: $253,398 (+$49,322, +24.17% from previous year)
- 2022: $292,198 (+$38,800, +15.31% from previous year)
- 2023: $294,868 (+$2,670, +0.91% from previous year)
- 2024: $310,568 (+$15,700, +5.32% from previous year)
- 2025: $327,956 (+$17,388, +5.60% from previous year)
Savoy’s home prices have risen over 60% since 2020, with most of that growth occurring between 2020 and 2022. While the pace has moderated recently, prices have continued to rise steadily through 2025.
Savoy – Rural Appeal with Growing Interest
Savoy is a small town in the Berkshires with a population of just a few hundred. Known for its state forest and mountainous terrain, it’s become increasingly popular with remote workers and second-home buyers looking for a quiet getaway.
Its 2025 median price of $327,956 remains accessible by Massachusetts standards, especially for those prioritizing space and seclusion over proximity to urban centers. Strong price growth in recent years signals rising demand in this off-the-beaten-path location.
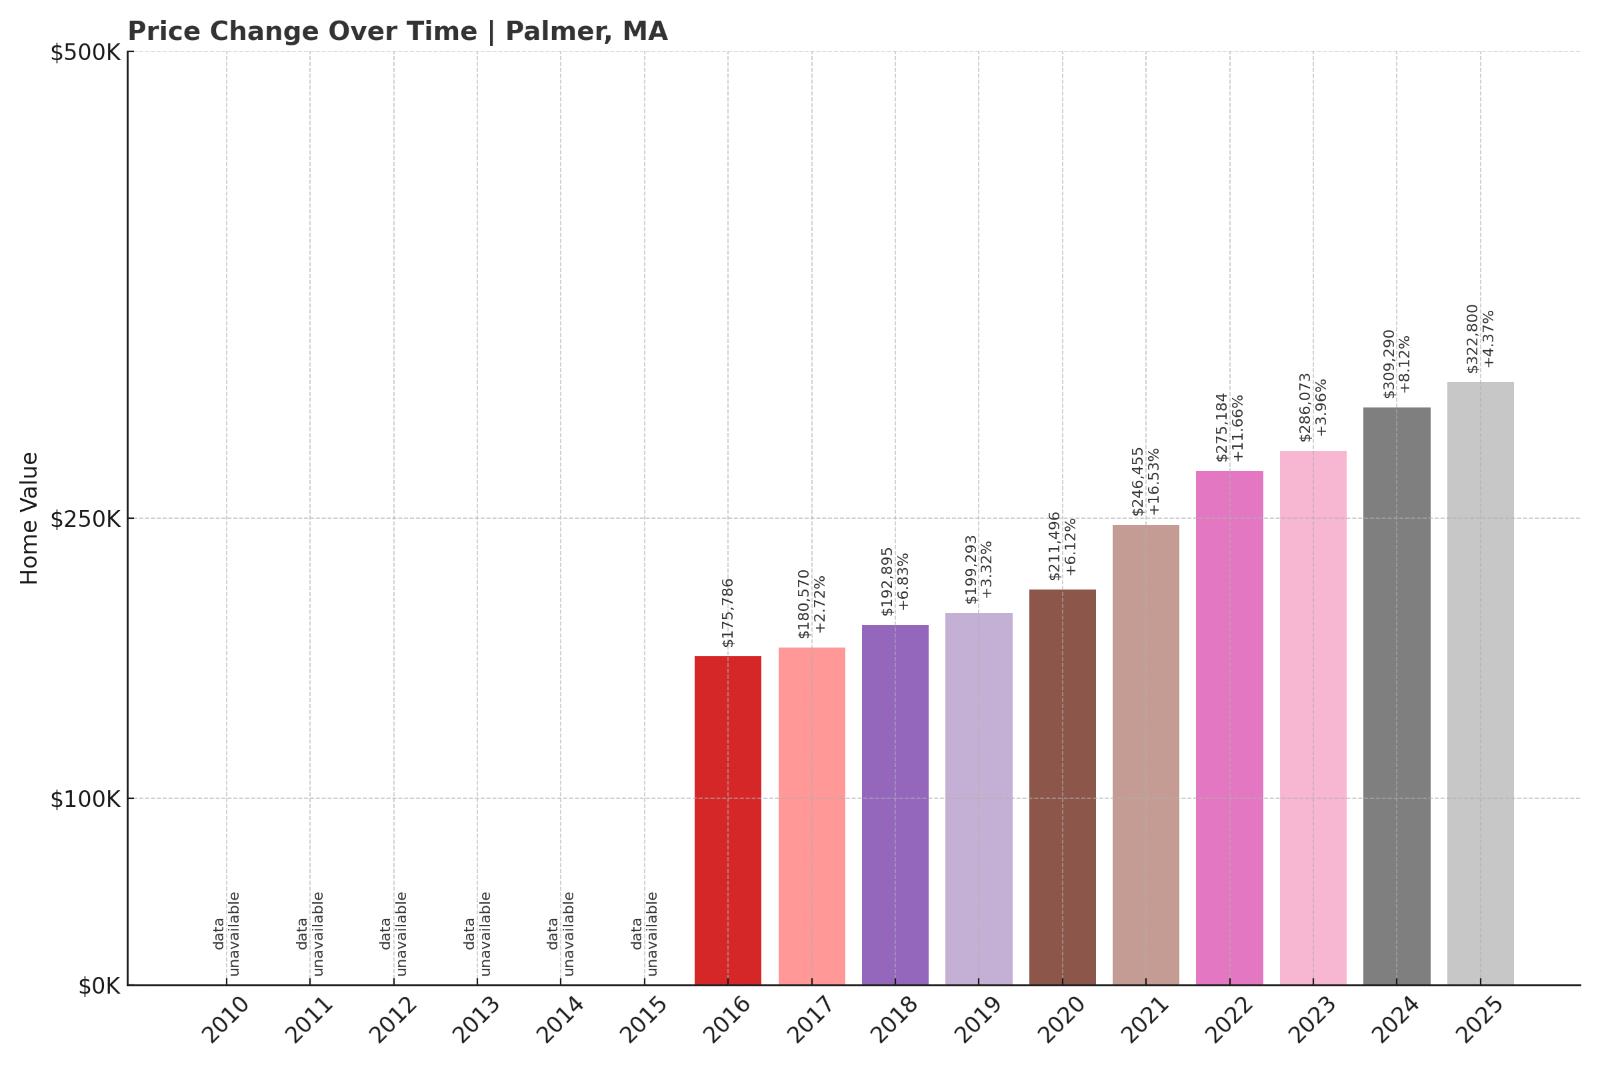
17. Palmer – 83.6% Home Price Increase Since 2016
- 2010: N/A
- 2011: N/A
- 2012: N/A
- 2013: N/A
- 2014: N/A
- 2015: N/A
- 2016: $175,786
- 2017: $180,570 (+$4,784, +2.72% from previous year)
- 2018: $192,895 (+$12,325, +6.83% from previous year)
- 2019: $199,293 (+$6,398, +3.32% from previous year)
- 2020: $211,496 (+$12,203, +6.12% from previous year)
- 2021: $246,455 (+$34,959, +16.53% from previous year)
- 2022: $275,184 (+$28,729, +11.66% from previous year)
- 2023: $286,073 (+$10,889, +3.96% from previous year)
- 2024: $309,290 (+$23,217, +8.12% from previous year)
- 2025: $322,800 (+$13,510, +4.37% from previous year)
Palmer’s average home value has jumped more than 80% since 2016, driven by robust growth between 2020 and 2022. While growth has slowed, the town remains one of the most affordable in the state as of 2025.
Palmer – Value in a Central Location
Palmer lies at the intersection of major highways including I-90 and Route 20, making it a central spot in western Massachusetts. This transportation access has helped sustain demand even as prices have risen steadily over the past several years.
The current median price of $322,800 makes Palmer an attractive choice for budget-minded buyers looking for accessibility and small-town amenities. Continued infrastructure and commuter appeal support the town’s long-term growth prospects.
16. Turners Falls – 70.1% Home Price Increase Since 2010

- 2010: $188,479
- 2011: $178,850 ($-9,629, -5.11% from previous year)
- 2012: $165,070 ($-13,780, -7.70% from previous year)
- 2013: $166,215 (+$1,145, +0.69% from previous year)
- 2014: $171,034 (+$4,819, +2.90% from previous year)
- 2015: $172,632 (+$1,598, +0.93% from previous year)
- 2016: $177,644 (+$5,012, +2.90% from previous year)
- 2017: $183,202 (+$5,558, +3.13% from previous year)
- 2018: $193,172 (+$9,970, +5.44% from previous year)
- 2019: $197,522 (+$4,350, +2.25% from previous year)
- 2020: $204,639 (+$7,117, +3.60% from previous year)
- 2021: $240,077 (+$35,438, +17.32% from previous year)
- 2022: $269,058 (+$28,981, +12.07% from previous year)
- 2023: $286,429 (+$17,371, +6.46% from previous year)
- 2024: $306,946 (+$20,517, +7.16% from previous year)
- 2025: $320,543 (+$13,597, +4.43% from previous year)
Turners Falls has seen consistent home value growth, with prices up over 70% since 2010. The sharpest increase came between 2020 and 2022, reflecting a broader trend of rural housing demand during and after the pandemic.
Turners Falls – Revitalized and Budget-Friendly
As a village within Montague, Turners Falls has a growing arts community and a scenic location along the Connecticut River. The town’s mill-town heritage and recent revitalization efforts have helped spur demand while keeping prices reasonable.
With a 2025 median value of $320,543, Turners Falls offers affordability without sacrificing access to culture, outdoor recreation, and walkable neighborhoods. Its steady growth and local appeal make it a favorite for those priced out of larger Pioneer Valley towns.
15. Holyoke – 78.5% Home Price Increase Since 2010

- 2010: $178,790
- 2011: $166,130 ($-12,660, -7.08% from previous year)
- 2012: $163,840 ($-2,290, -1.38% from previous year)
- 2013: $166,588 (+$2,748, +1.68% from previous year)
- 2014: $172,216 (+$5,628, +3.38% from previous year)
- 2015: $174,479 (+$2,263, +1.31% from previous year)
- 2016: $180,535 (+$6,056, +3.47% from previous year)
- 2017: $187,468 (+$6,933, +3.84% from previous year)
- 2018: $195,980 (+$8,512, +4.54% from previous year)
- 2019: $208,735 (+$12,755, +6.51% from previous year)
- 2020: $220,488 (+$11,753, +5.63% from previous year)
- 2021: $255,949 (+$35,461, +16.08% from previous year)
- 2022: $279,456 (+$23,507, +9.18% from previous year)
- 2023: $291,520 (+$12,064, +4.32% from previous year)
- 2024: $307,702 (+$16,182, +5.55% from previous year)
- 2025: $319,156 (+$11,454, +3.72% from previous year)
Holyoke’s home values have increased nearly 80% since 2010. After gradual growth throughout the 2010s, the town saw major jumps from 2020 to 2022, mirroring price surges across the state during that period.
Holyoke – Urban Access at Affordable Prices
Once a booming industrial city, Holyoke is reinventing itself as a hub for startups, artists, and young families priced out of nearby Northampton and Amherst. It’s one of the few urban centers in Massachusetts still offering sub-$325K housing in 2025.
Located along the Connecticut River with solid transportation links and ongoing redevelopment projects, Holyoke is well-positioned for continued growth. Its affordability is attracting new residents while long-term investments are reshaping its neighborhoods.
14. Orange – 109.3% Home Price Increase Since 2010
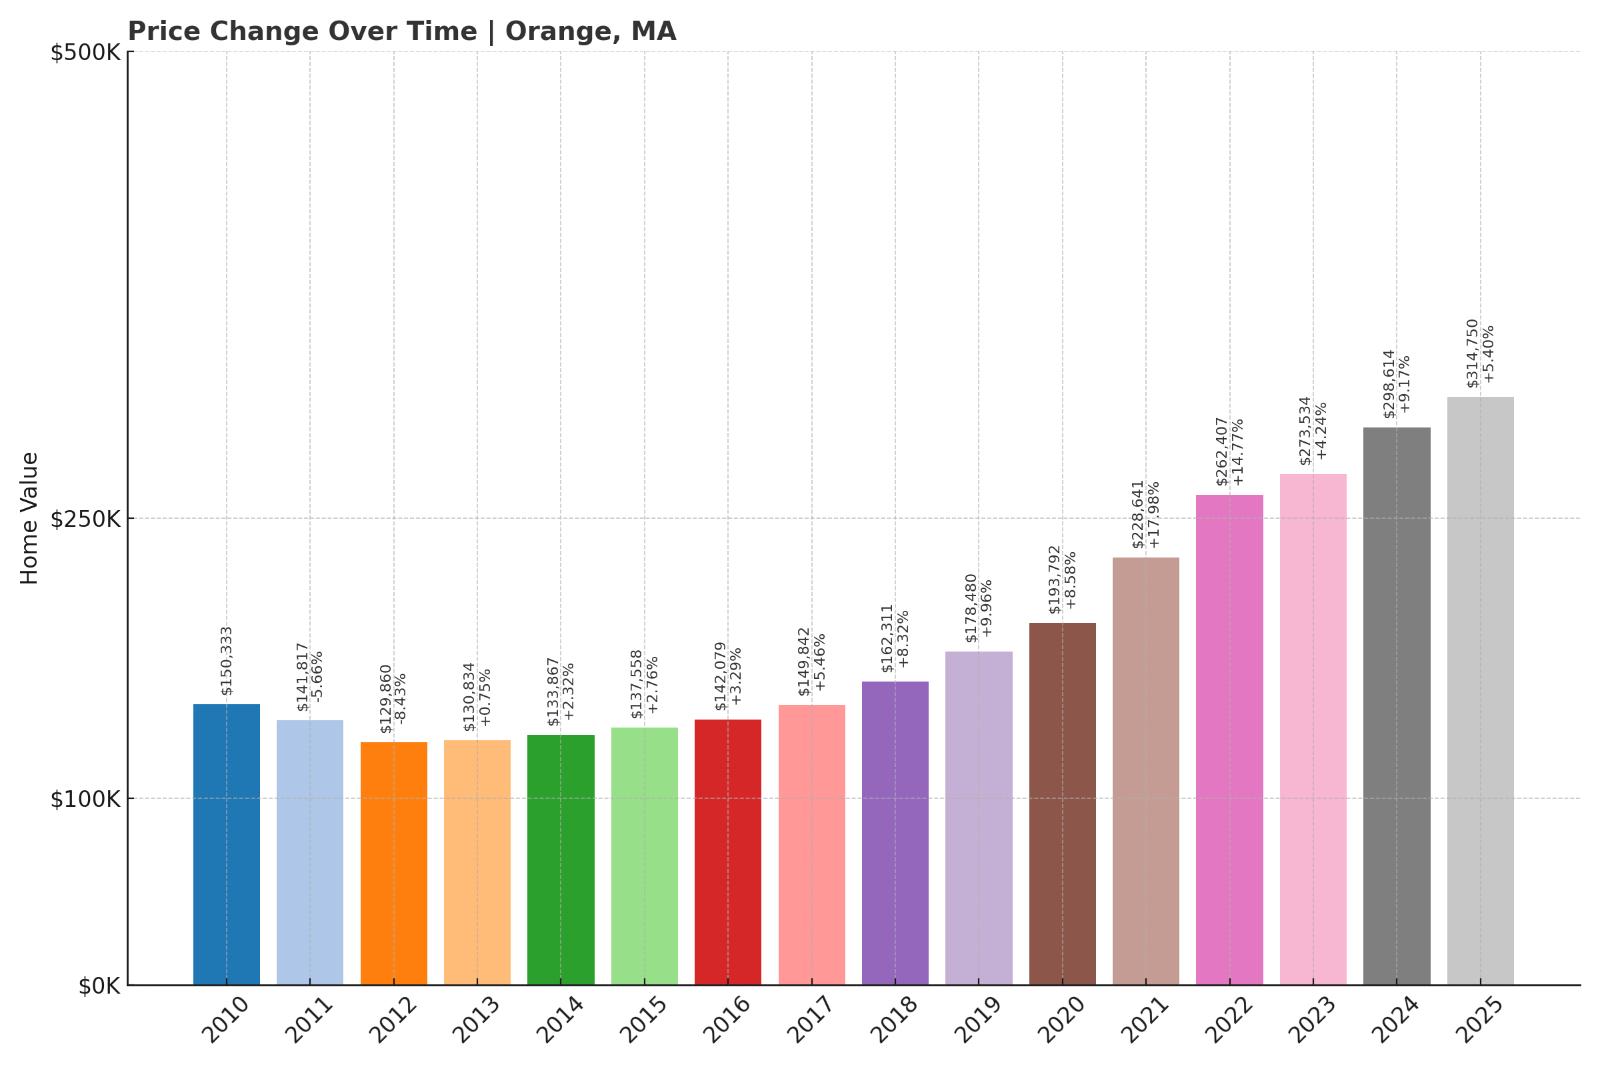
- 2010: $150,333
- 2011: $141,817 ($-8,516, -5.66% from previous year)
- 2012: $129,860 ($-11,957, -8.43% from previous year)
- 2013: $130,834 (+$974, +0.75% from previous year)
- 2014: $133,867 (+$3,033, +2.32% from previous year)
- 2015: $137,558 (+$3,691, +2.76% from previous year)
- 2016: $142,079 (+$4,521, +3.29% from previous year)
- 2017: $149,842 (+$7,763, +5.46% from previous year)
- 2018: $162,311 (+$12,469, +8.32% from previous year)
- 2019: $178,480 (+$16,169, +9.96% from previous year)
- 2020: $193,792 (+$15,312, +8.58% from previous year)
- 2021: $228,641 (+$34,849, +17.98% from previous year)
- 2022: $262,407 (+$33,766, +14.77% from previous year)
- 2023: $273,534 (+$11,127, +4.24% from previous year)
- 2024: $298,614 (+$25,080, +9.17% from previous year)
- 2025: $314,750 (+$16,136, +5.40% from previous year)
Home prices in Orange have more than doubled since 2010, with the biggest surges coming between 2020 and 2022. Even with continued growth, the average home value of $314,750 in 2025 still ranks among the lowest in the state. Strong interest from remote workers has helped sustain demand in this affordable North Quabbin town.
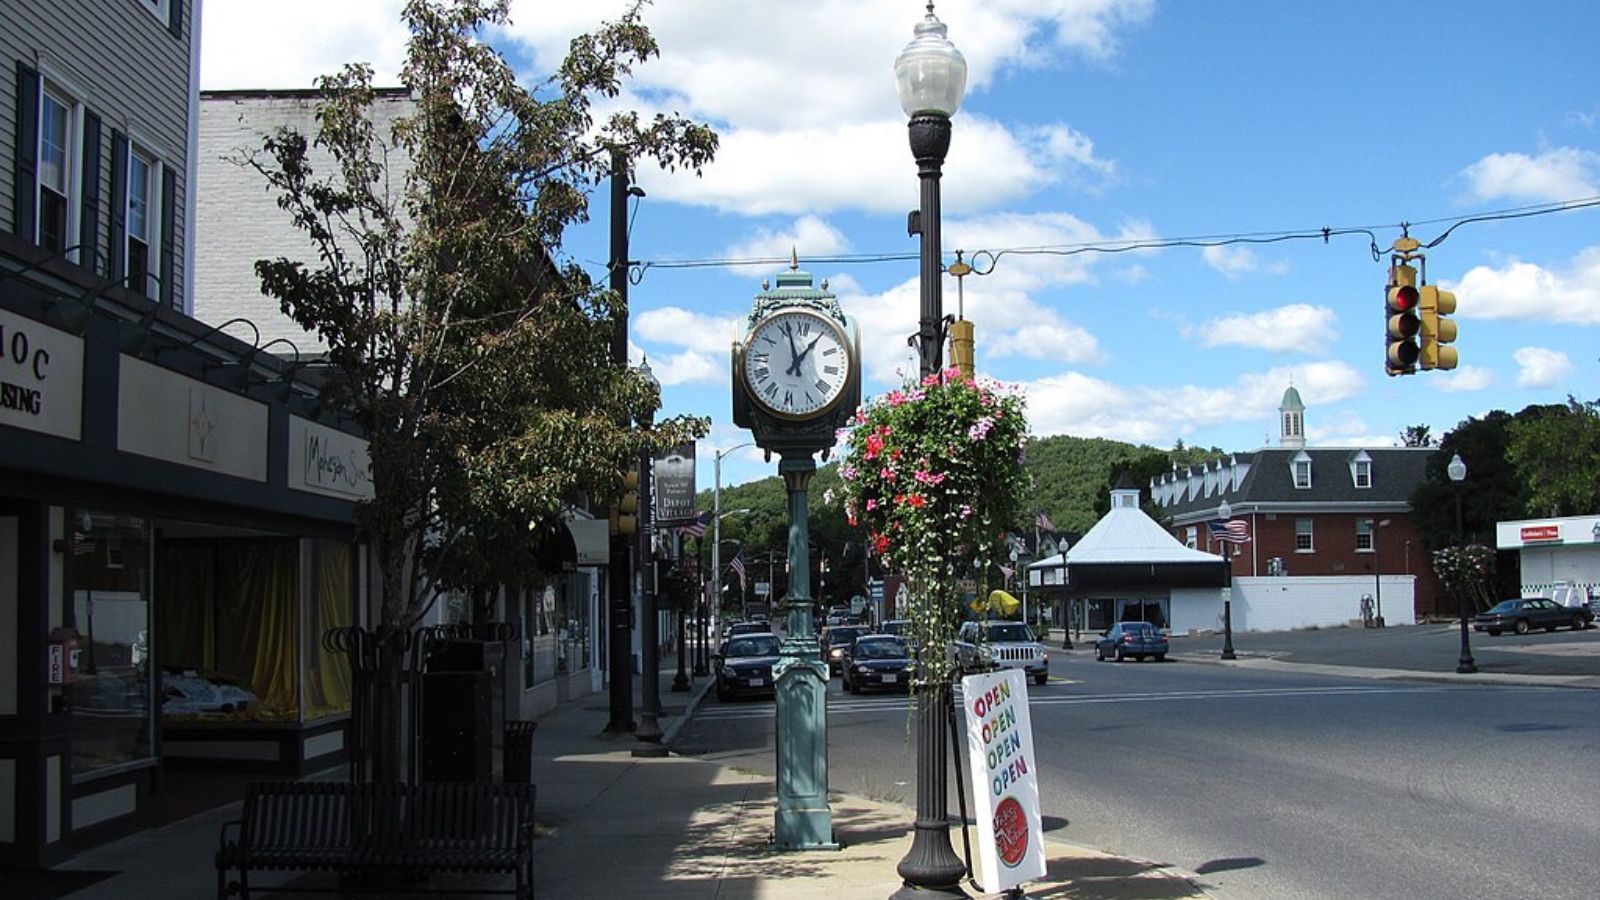
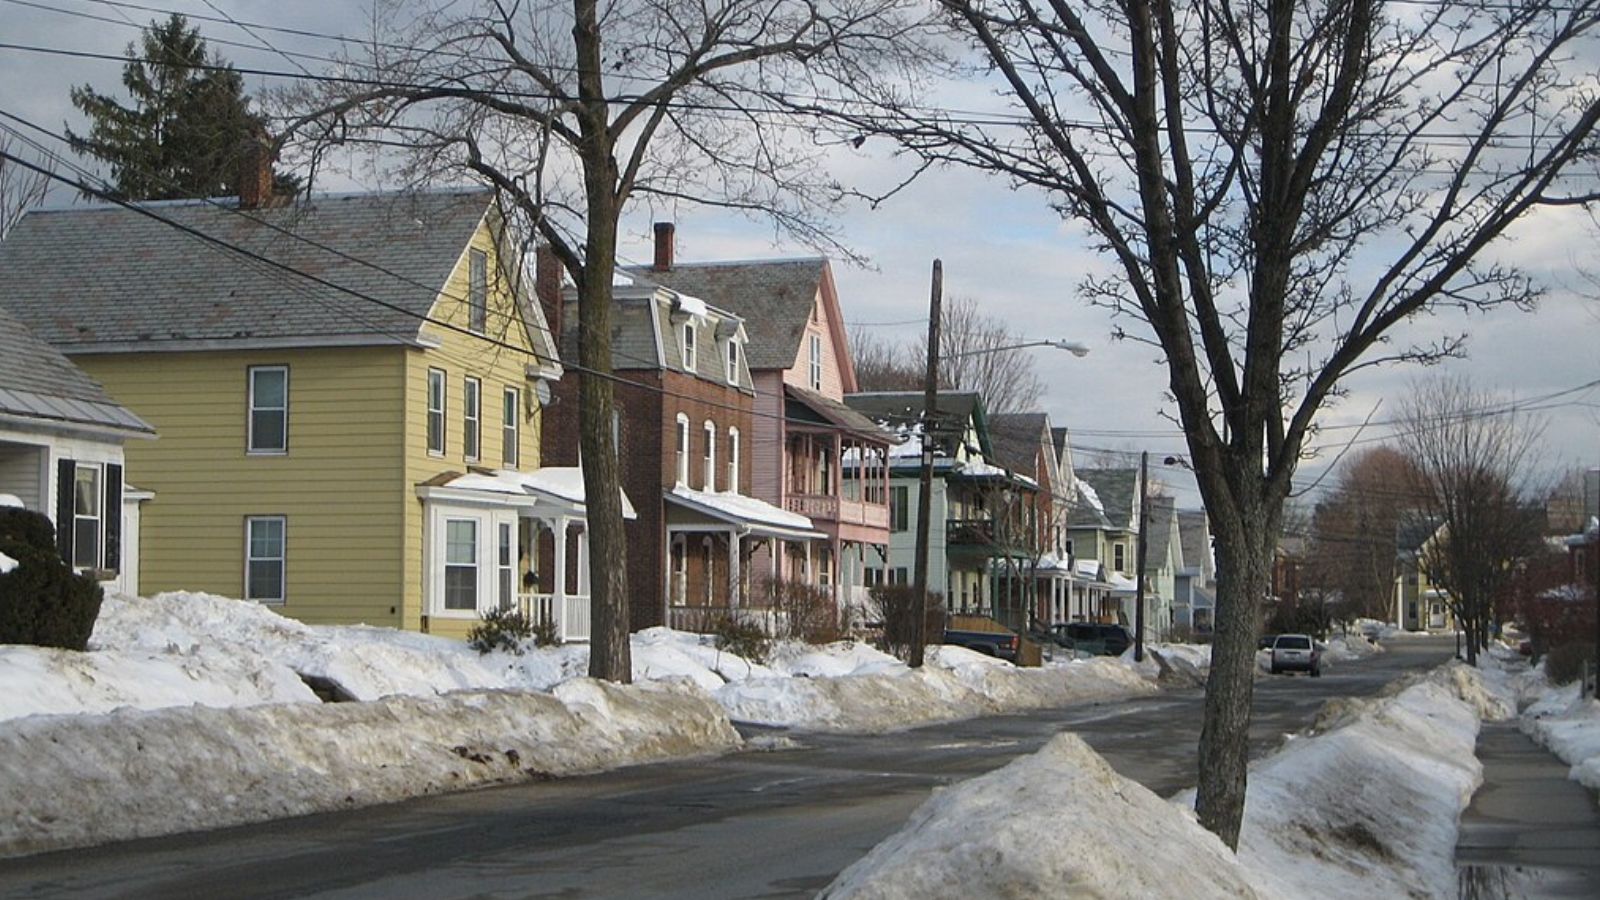
Orange – Affordable Living in the North Quabbin Region
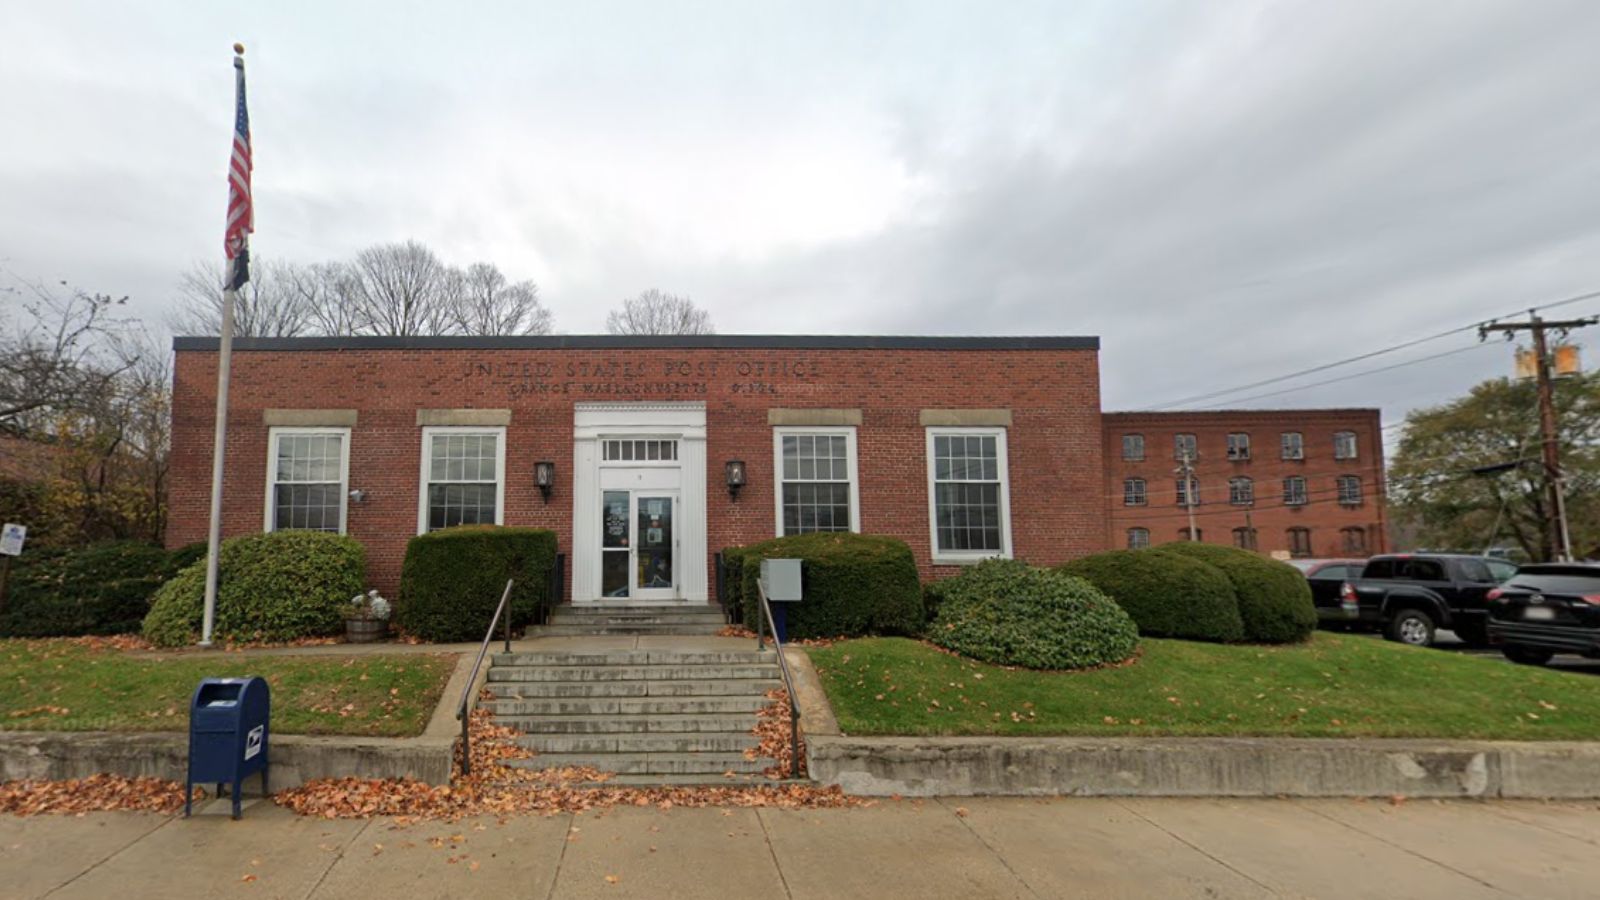
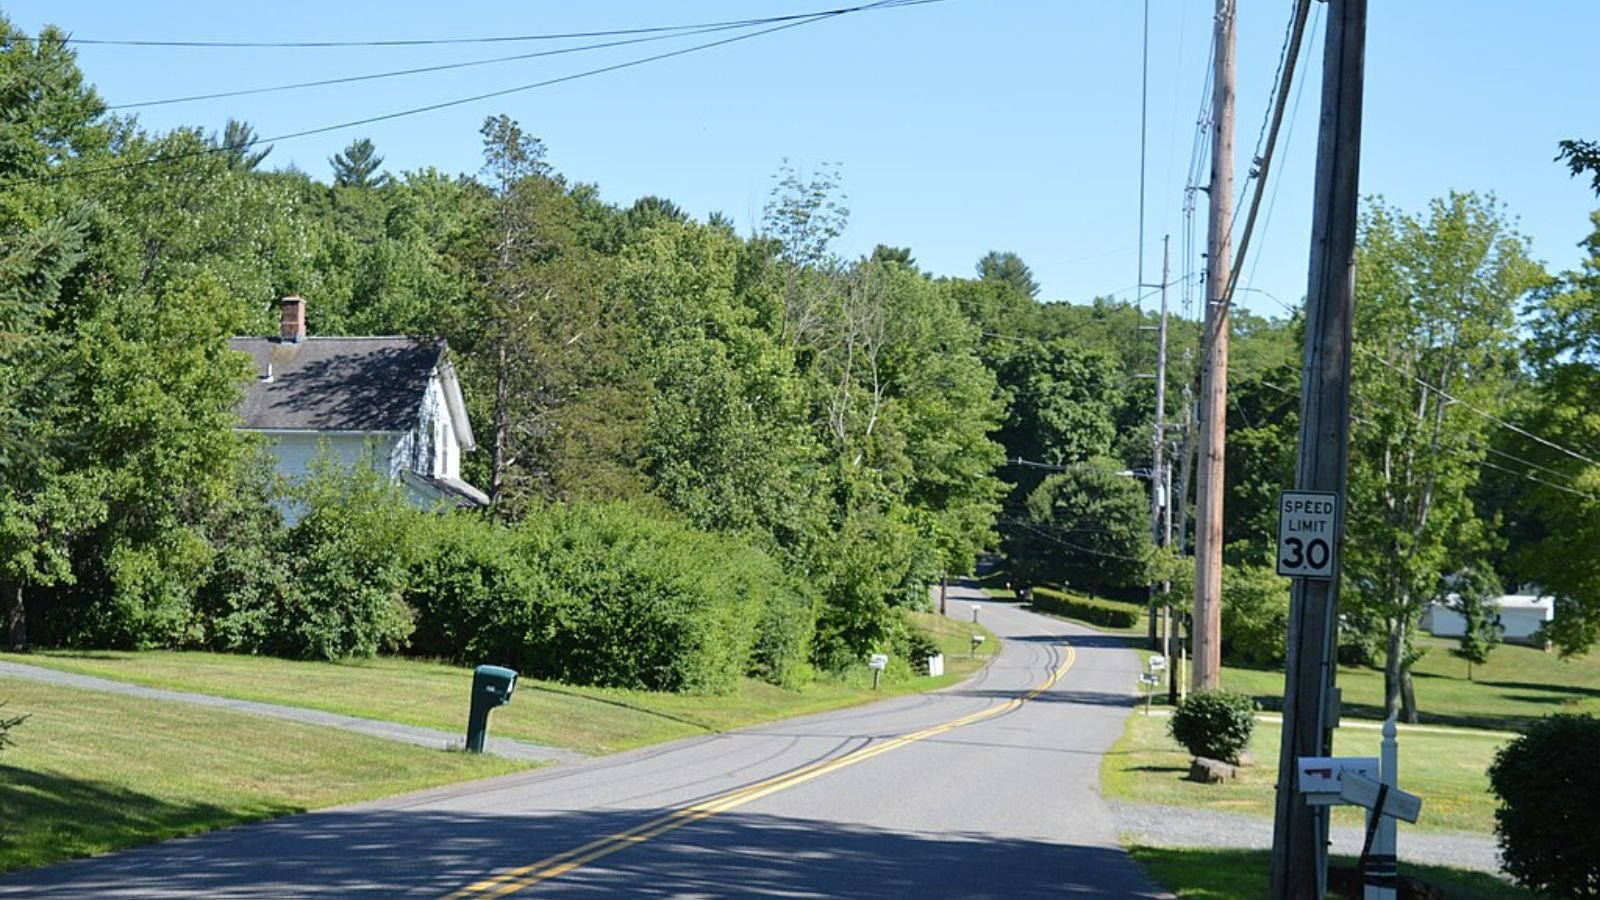
Orange sits in north-central Massachusetts, bordered by rivers and forestland, and offers access to the Quabbin Reservoir and Route 2. This location provides a rural atmosphere while still maintaining proximity to Greenfield and other employment hubs. The area has benefited from renewed interest during the pandemic as buyers looked beyond Greater Boston for value.
The town’s modest housing stock and past disinvestment helped keep values low for decades. As interest in affordable, spacious living has grown, Orange has seen significant price growth, particularly from 2020 to 2022. Despite that, prices remain low compared to most of the state, making it a compelling option for value-driven buyers.
13. Colrain – 66.2% Home Price Increase Since 2010
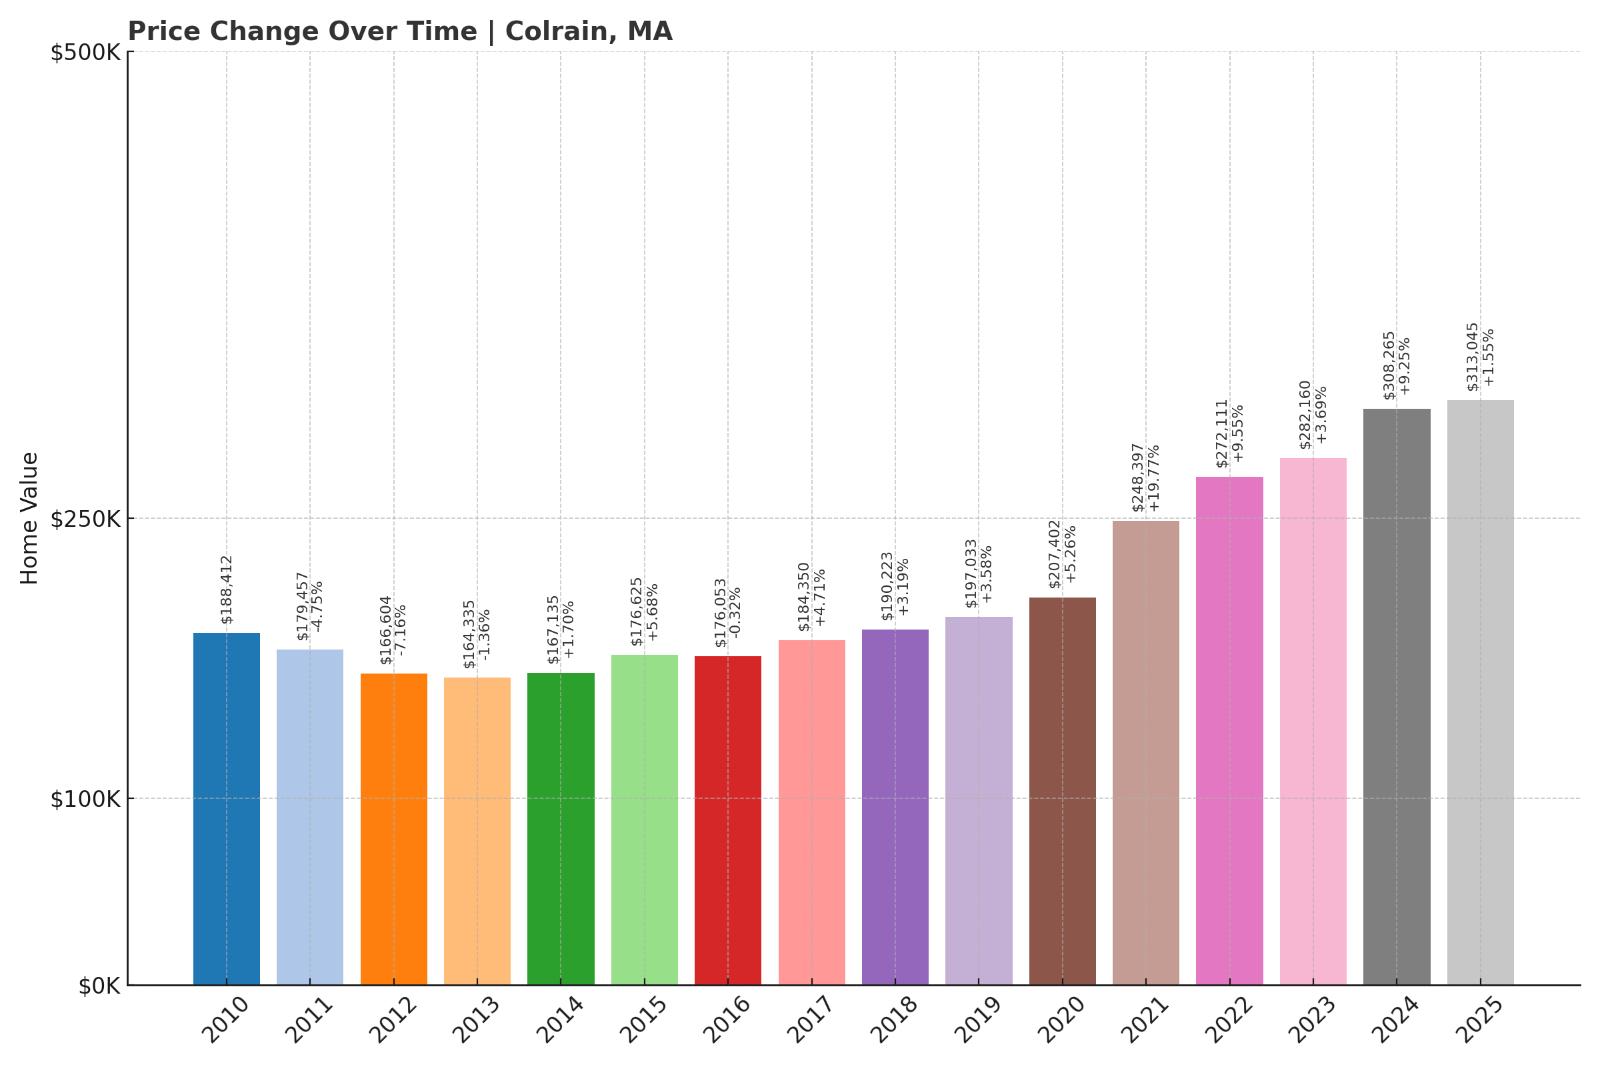
- 2010: $188,412
- 2011: $179,457 ($-8,955, -4.75% from previous year)
- 2012: $166,604 ($-12,853, -7.16% from previous year)
- 2013: $164,335 ($-2,269, -1.36% from previous year)
- 2014: $167,135 (+$2,800, +1.70% from previous year)
- 2015: $176,625 (+$9,490, +5.68% from previous year)
- 2016: $176,053 ($-572, -0.32% from previous year)
- 2017: $184,350 (+$8,297, +4.71% from previous year)
- 2018: $190,223 (+$5,873, +3.19% from previous year)
- 2019: $197,033 (+$6,810, +3.58% from previous year)
- 2020: $207,402 (+$10,369, +5.26% from previous year)
- 2021: $248,397 (+$40,995, +19.77% from previous year)
- 2022: $272,111 (+$23,714, +9.55% from previous year)
- 2023: $282,160 (+$10,049, +3.69% from previous year)
- 2024: $308,265 (+$26,105, +9.25% from previous year)
- 2025: $313,045 (+$4,780, +1.55% from previous year)
Colrain’s home values have grown more than 66% since 2010, with some of the most dramatic increases happening after 2020. Prices reached $313,045 in 2025, after surging nearly 20% in 2021 alone. While growth has cooled since then, the trend remains positive.
Colrain – Hilltown Living with Steady Growth
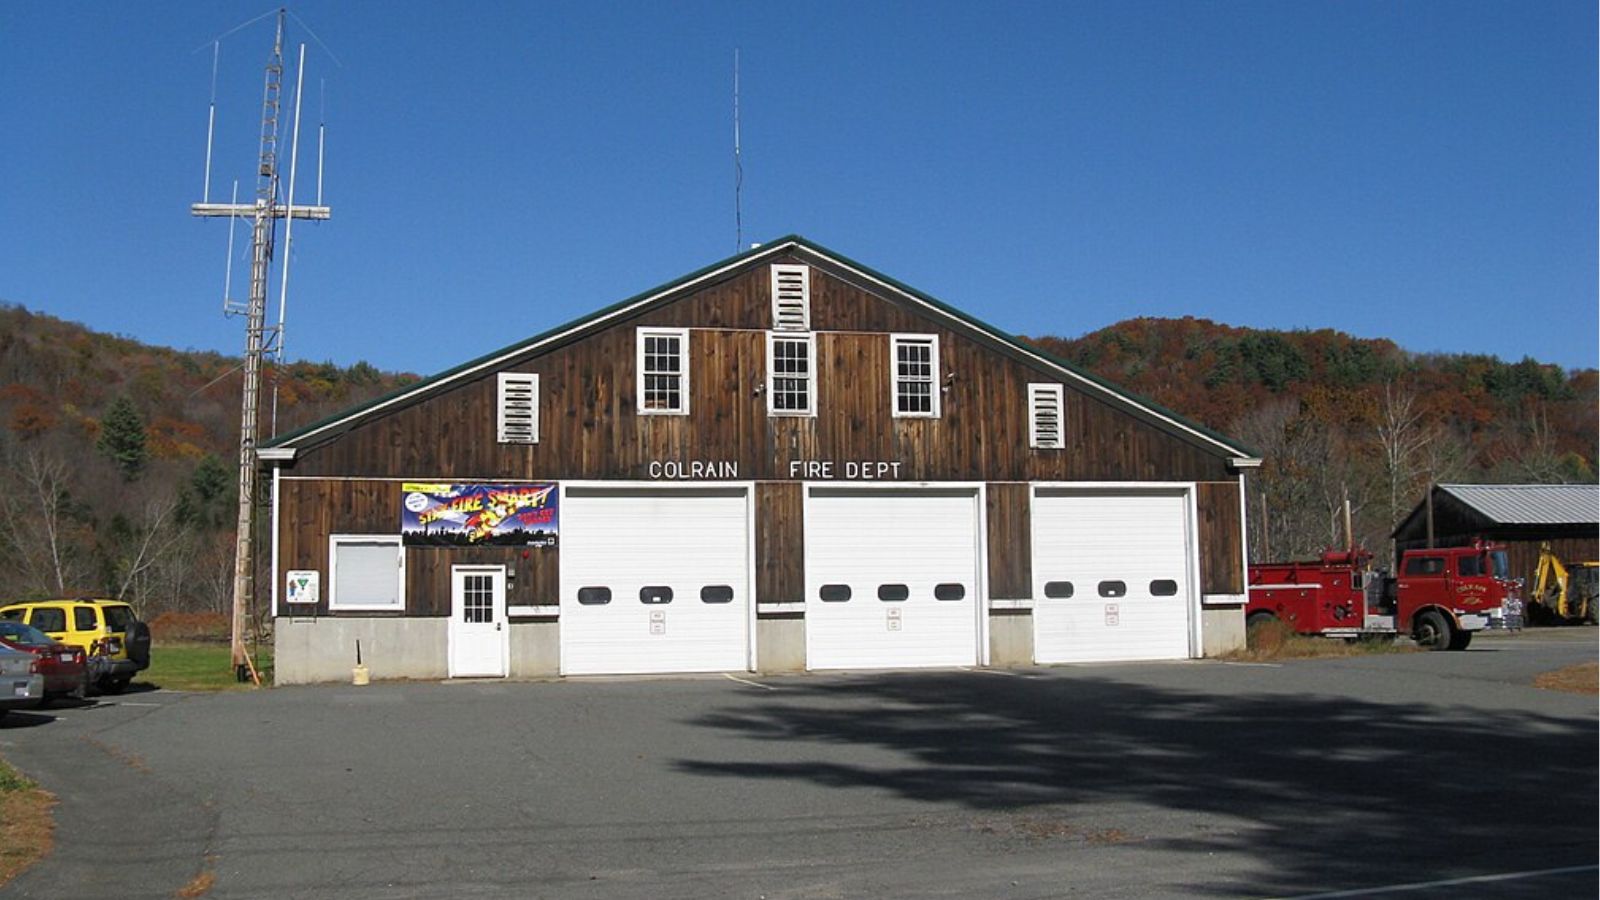
Colrain is a quiet, hilltop town along the Vermont border known for scenic views, farmland, and stone walls. It has long attracted residents looking for privacy and self-sufficiency, especially those priced out of more populous towns in Franklin County. Home prices have increased steadily but remain affordable thanks to its remote setting.
Buyers drawn to sustainability and rural independence have helped shape Colrain’s housing market. The pandemic-era interest in space and solitude gave the town a boost, particularly between 2020 and 2022. Even with recent cooling, it remains a solid value in western Massachusetts.
12. Chicopee – 77.8% Home Price Increase Since 2010
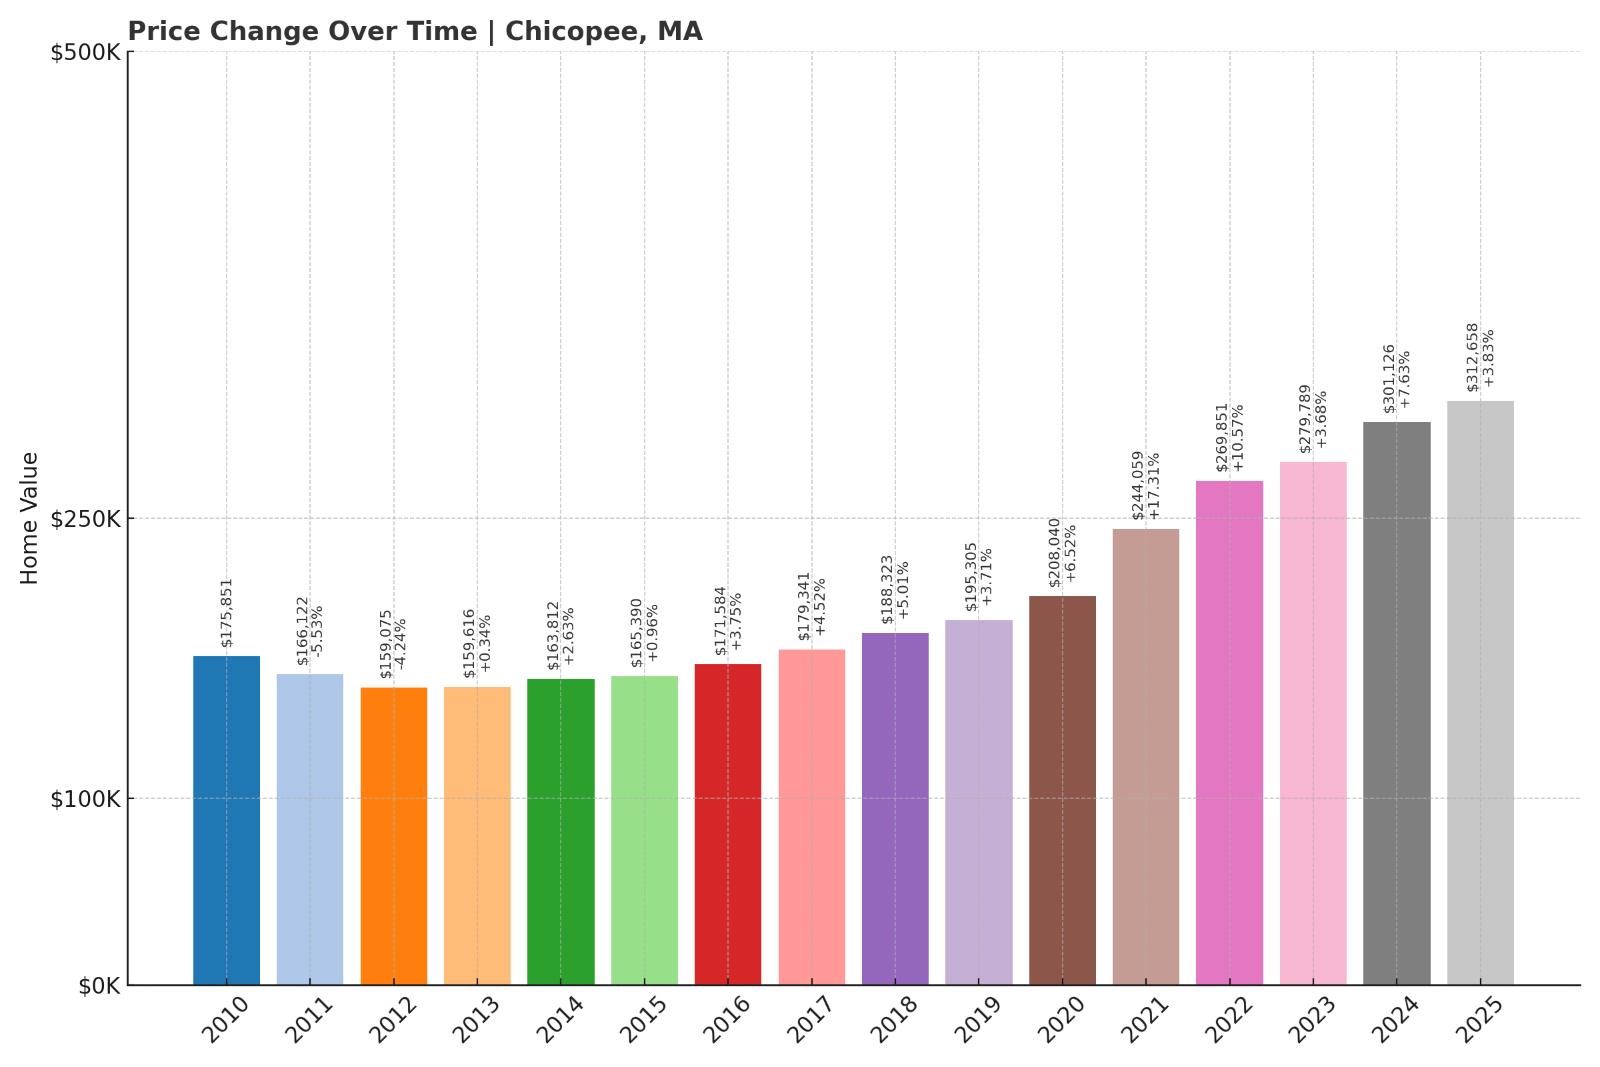
- 2010: $175,851
- 2011: $166,122 ($-9,729, -5.53% from previous year)
- 2012: $159,075 ($-7,047, -4.24% from previous year)
- 2013: $159,616 (+$541, +0.34% from previous year)
- 2014: $163,812 (+$4,196, +2.63% from previous year)
- 2015: $165,390 (+$1,578, +0.96% from previous year)
- 2016: $171,584 (+$6,194, +3.75% from previous year)
- 2017: $179,341 (+$7,757, +4.52% from previous year)
- 2018: $188,323 (+$8,982, +5.01% from previous year)
- 2019: $195,305 (+$6,982, +3.71% from previous year)
- 2020: $208,040 (+$12,735, +6.52% from previous year)
- 2021: $244,059 (+$36,019, +17.31% from previous year)
- 2022: $269,851 (+$25,792, +10.57% from previous year)
- 2023: $279,789 (+$9,938, +3.68% from previous year)
- 2024: $301,126 (+$21,337, +7.63% from previous year)
- 2025: $312,658 (+$11,532, +3.83% from previous year)
Chicopee has seen a nearly 78% increase in home prices since 2010, with a noticeable boom from 2020 to 2022. Values jumped over 17% in 2021 alone and have continued climbing since. The 2025 average stands at $312,658, still among the lowest for an urban center.
Chicopee – Affordability Near the City Core
Chicopee offers proximity to Springfield and I-91, making it a commuter-friendly and budget-conscious choice. The city includes a mix of residential neighborhoods, industrial parks, and green spaces like Chicopee Memorial State Park. It continues to attract buyers who want city infrastructure without the high costs of Boston or Worcester.
In recent years, growth has been driven by demand for starter homes and investment properties. With prices rising steadily yet remaining accessible, Chicopee strikes a balance that appeals to many buyer types. Strong fundamentals and location help support ongoing interest.
11. Plainfield – 46.8% Home Price Increase Since 2010
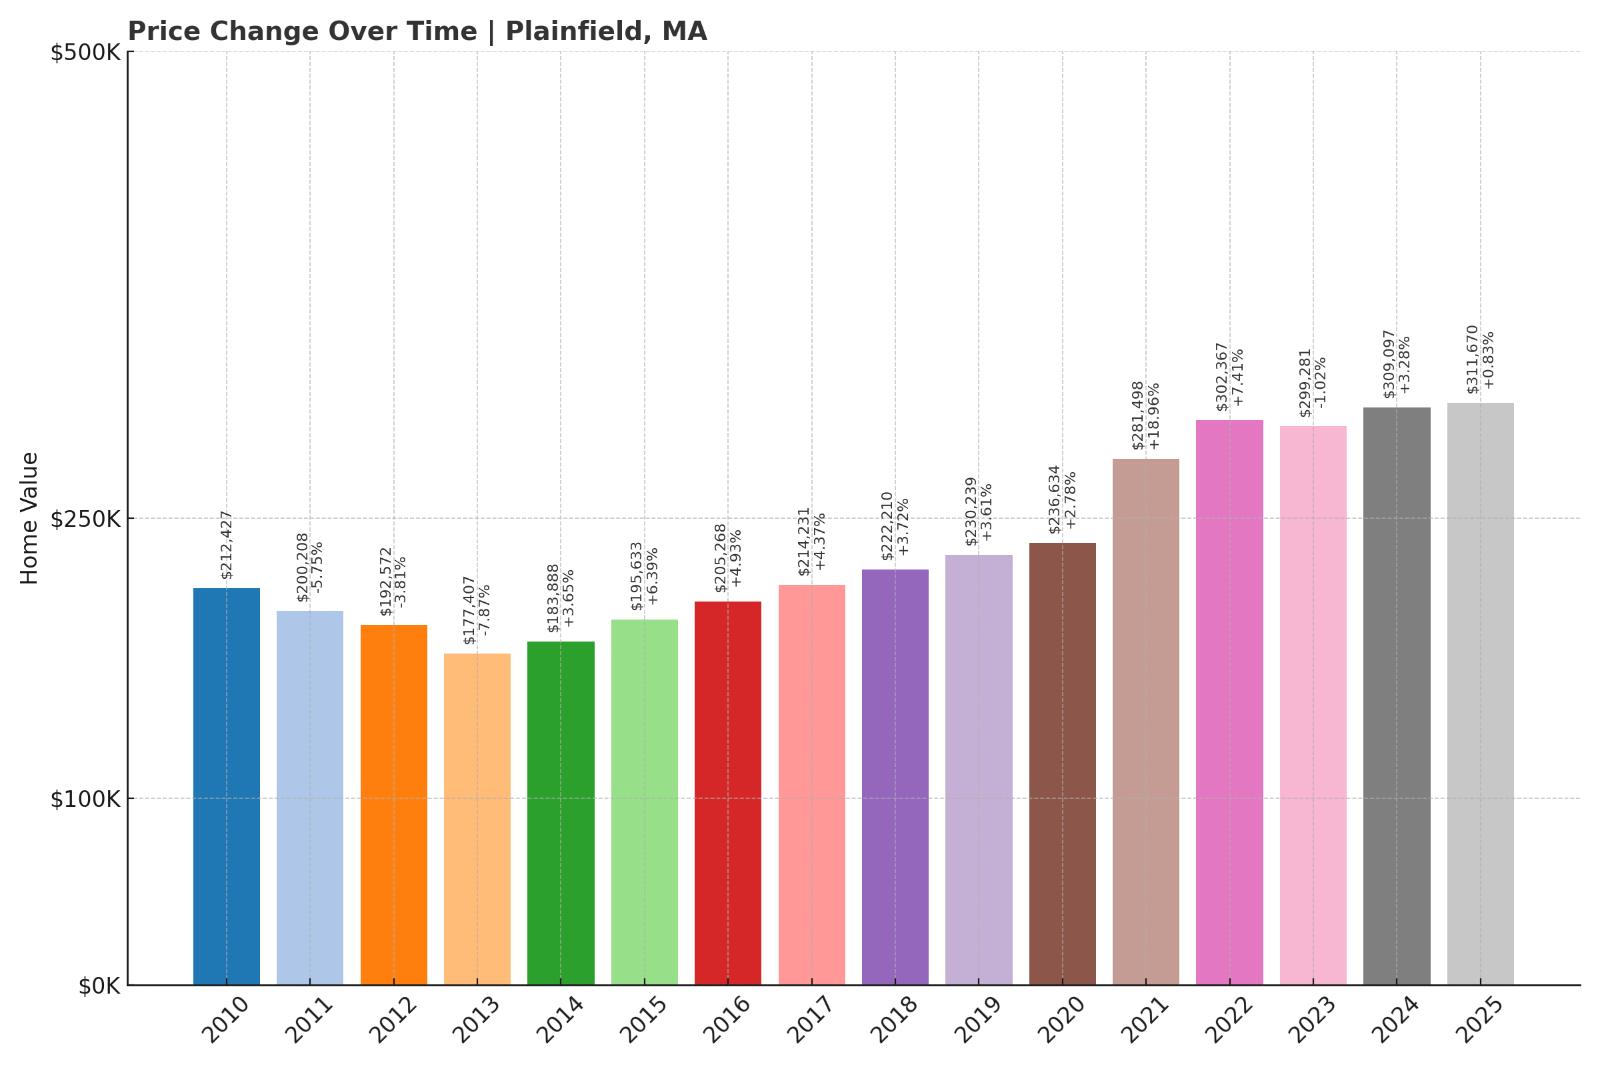
- 2010: $212,427
- 2011: $200,208 ($-12,219, -5.75% from previous year)
- 2012: $192,572 ($-7,636, -3.81% from previous year)
- 2013: $177,407 ($-15,165, -7.87% from previous year)
- 2014: $183,888 (+$6,481, +3.65% from previous year)
- 2015: $195,633 (+$11,745, +6.39% from previous year)
- 2016: $205,268 (+$9,635, +4.93% from previous year)
- 2017: $214,231 (+$8,963, +4.37% from previous year)
- 2018: $222,210 (+$7,979, +3.72% from previous year)
- 2019: $230,239 (+$8,029, +3.61% from previous year)
- 2020: $236,634 (+$6,395, +2.78% from previous year)
- 2021: $281,498 (+$44,864, +18.96% from previous year)
- 2022: $302,367 (+$20,869, +7.41% from previous year)
- 2023: $299,281 ($-3,086, -1.02% from previous year)
- 2024: $309,097 (+$9,816, +3.28% from previous year)
- 2025: $311,670 (+$2,573, +0.83% from previous year)
Plainfield’s home prices have risen nearly 47% since 2010, with a major spike in 2021. Prices dipped slightly in 2023 but have since recovered, reaching $311,670 in 2025. The market here is stable but limited by low turnover.
Plainfield – Remote Elevation, Reliable Demand
Plainfield is one of the highest towns in the state, located in the hills of Hampshire County. The town’s isolation has kept demand modest but steady, with buyers often seeking off-grid potential and open land. Its limited inventory helps keep values from falling even during market slowdowns.
It remains attractive to artists, homesteaders, and those seeking self-sufficiency far from suburban sprawl. The large lots and scenic views provide long-term value that doesn’t always reflect in raw numbers. That quiet resilience is part of what keeps Plainfield appealing year after year.
10. Millers Falls – 102.8% Home Price Increase Since 2010
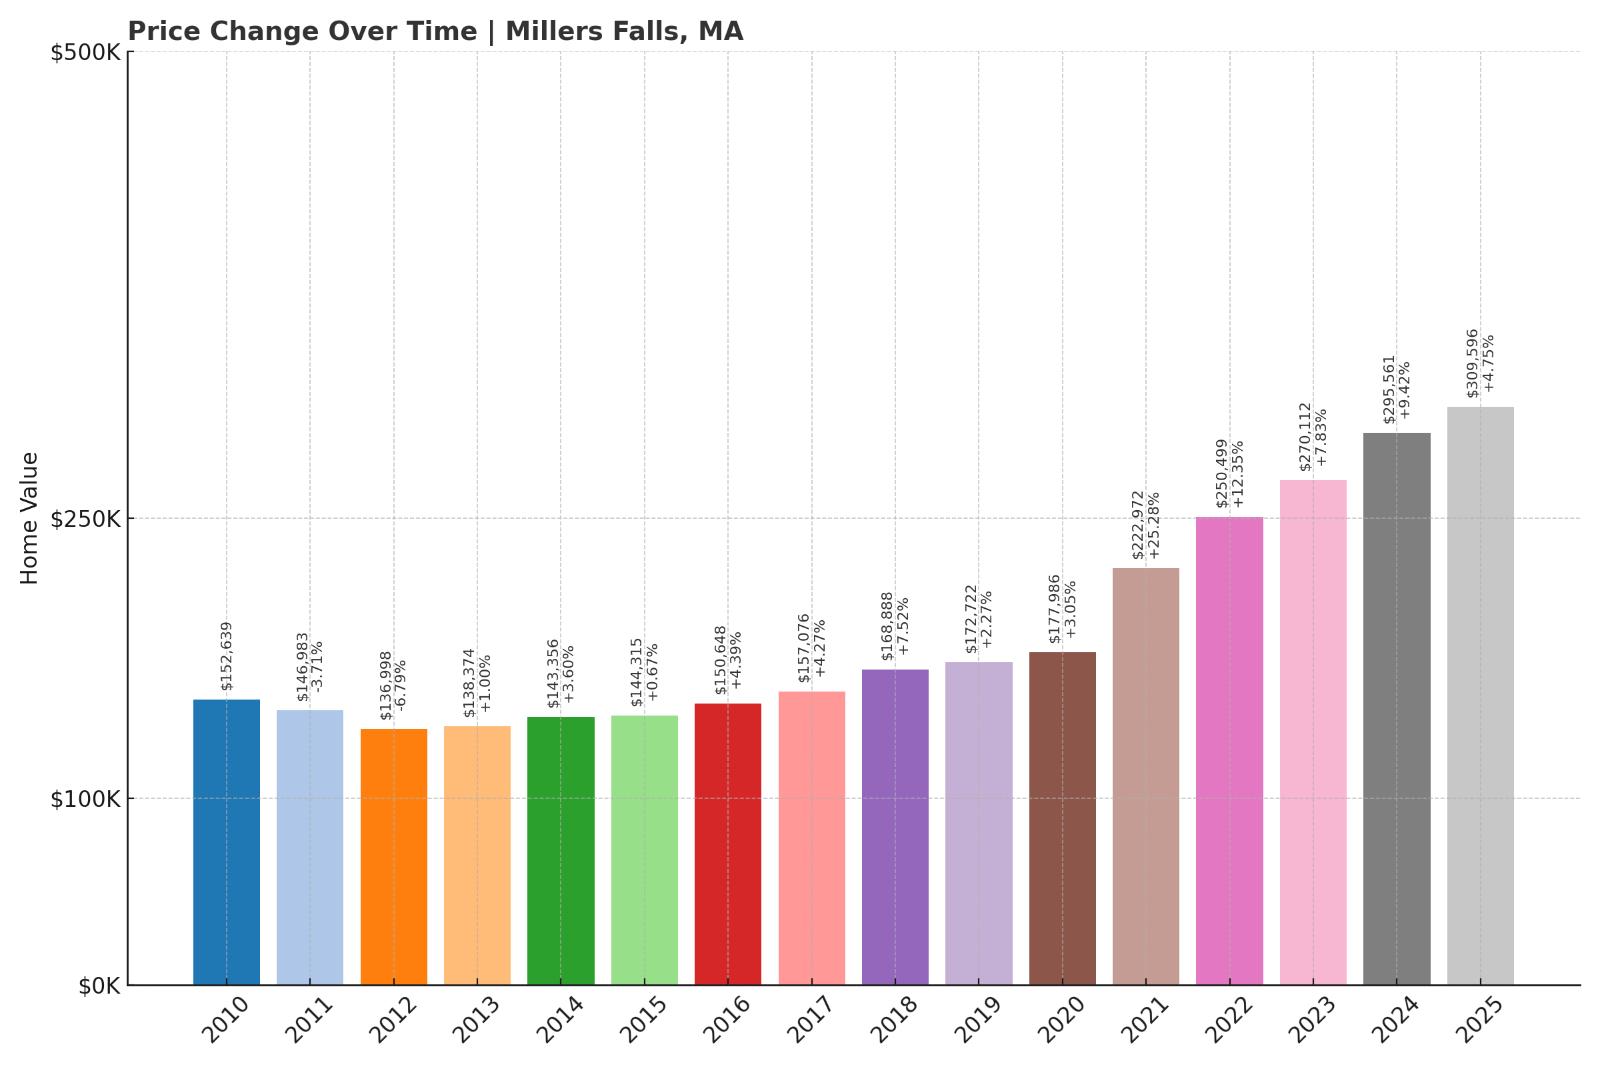
- 2010: $152,639
- 2011: $146,983 ($-5,656, -3.71% from previous year)
- 2012: $136,998 ($-9,985, -6.79% from previous year)
- 2013: $138,374 (+$1,376, +1.00% from previous year)
- 2014: $143,356 (+$4,982, +3.60% from previous year)
- 2015: $144,315 (+$959, +0.67% from previous year)
- 2016: $150,648 (+$6,333, +4.39% from previous year)
- 2017: $157,076 (+$6,428, +4.27% from previous year)
- 2018: $168,888 (+$11,812, +7.52% from previous year)
- 2019: $172,722 (+$3,834, +2.27% from previous year)
- 2020: $177,986 (+$5,264, +3.05% from previous year)
- 2021: $222,972 (+$44,986, +25.28% from previous year)
- 2022: $250,499 (+$27,527, +12.35% from previous year)
- 2023: $270,112 (+$19,613, +7.83% from previous year)
- 2024: $295,561 (+$25,449, +9.42% from previous year)
- 2025: $309,596 (+$14,035, +4.75% from previous year)
Millers Falls has more than doubled in value since 2010, with the biggest leap occurring in 2021. Prices have continued rising steadily since, reaching $309,596 in 2025. The pattern shows strong demand for affordable housing near larger towns like Greenfield.
Millers Falls – Small Village, Big Momentum
This former mill village within Montague has become a magnet for buyers seeking low costs and access to the Pioneer Valley. It offers a walkable core and close proximity to the Connecticut River, along with a mix of modest housing options. Growth here reflects both spillover demand and renewed local interest.
Despite limited services, Millers Falls benefits from nearby amenities in Turners Falls and Greenfield. Many buyers are drawn by the balance between affordability and location. As prices across Franklin County continue to rise, this village remains a bright spot for value-focused buyers.
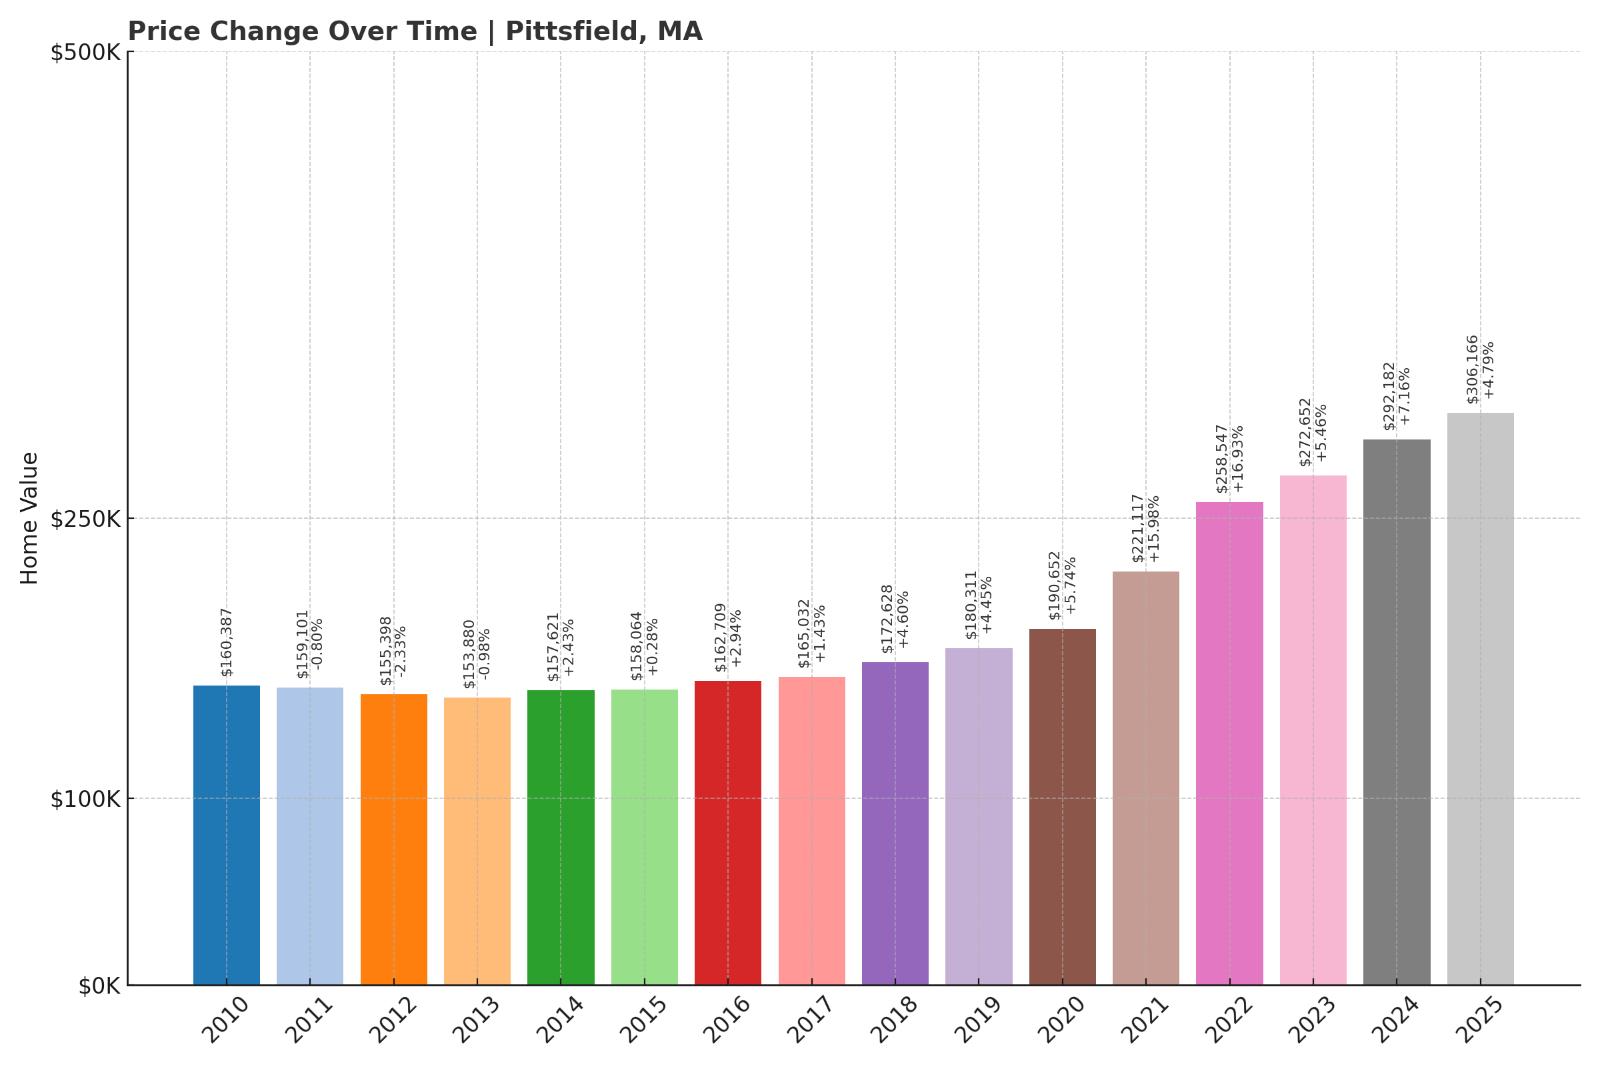
9. Pittsfield – 90.9% Home Price Increase Since 2010
- 2010: $160,387
- 2011: $159,101 ($-1,286, -0.80% from previous year)
- 2012: $155,398 ($-3,703, -2.33% from previous year)
- 2013: $153,880 ($-1,518, -0.98% from previous year)
- 2014: $157,621 (+$3,741, +2.43% from previous year)
- 2015: $158,064 (+$443, +0.28% from previous year)
- 2016: $162,709 (+$4,645, +2.94% from previous year)
- 2017: $165,032 (+$2,323, +1.43% from previous year)
- 2018: $172,628 (+$7,596, +4.60% from previous year)
- 2019: $180,311 (+$7,683, +4.45% from previous year)
- 2020: $190,652 (+$10,341, +5.74% from previous year)
- 2021: $221,117 (+$30,465, +15.98% from previous year)
- 2022: $258,547 (+$37,430, +16.93% from previous year)
- 2023: $272,652 (+$14,105, +5.46% from previous year)
- 2024: $292,182 (+$19,530, +7.16% from previous year)
- 2025: $306,166 (+$13,984, +4.79% from previous year)
Pittsfield’s home values rose steadily from just over $160,000 in 2010 to $306,166 in 2025—an increase of nearly 91%. Most of the growth came after 2020, with especially sharp spikes in 2021 and 2022. The market has continued to grow, albeit more slowly, in recent years.
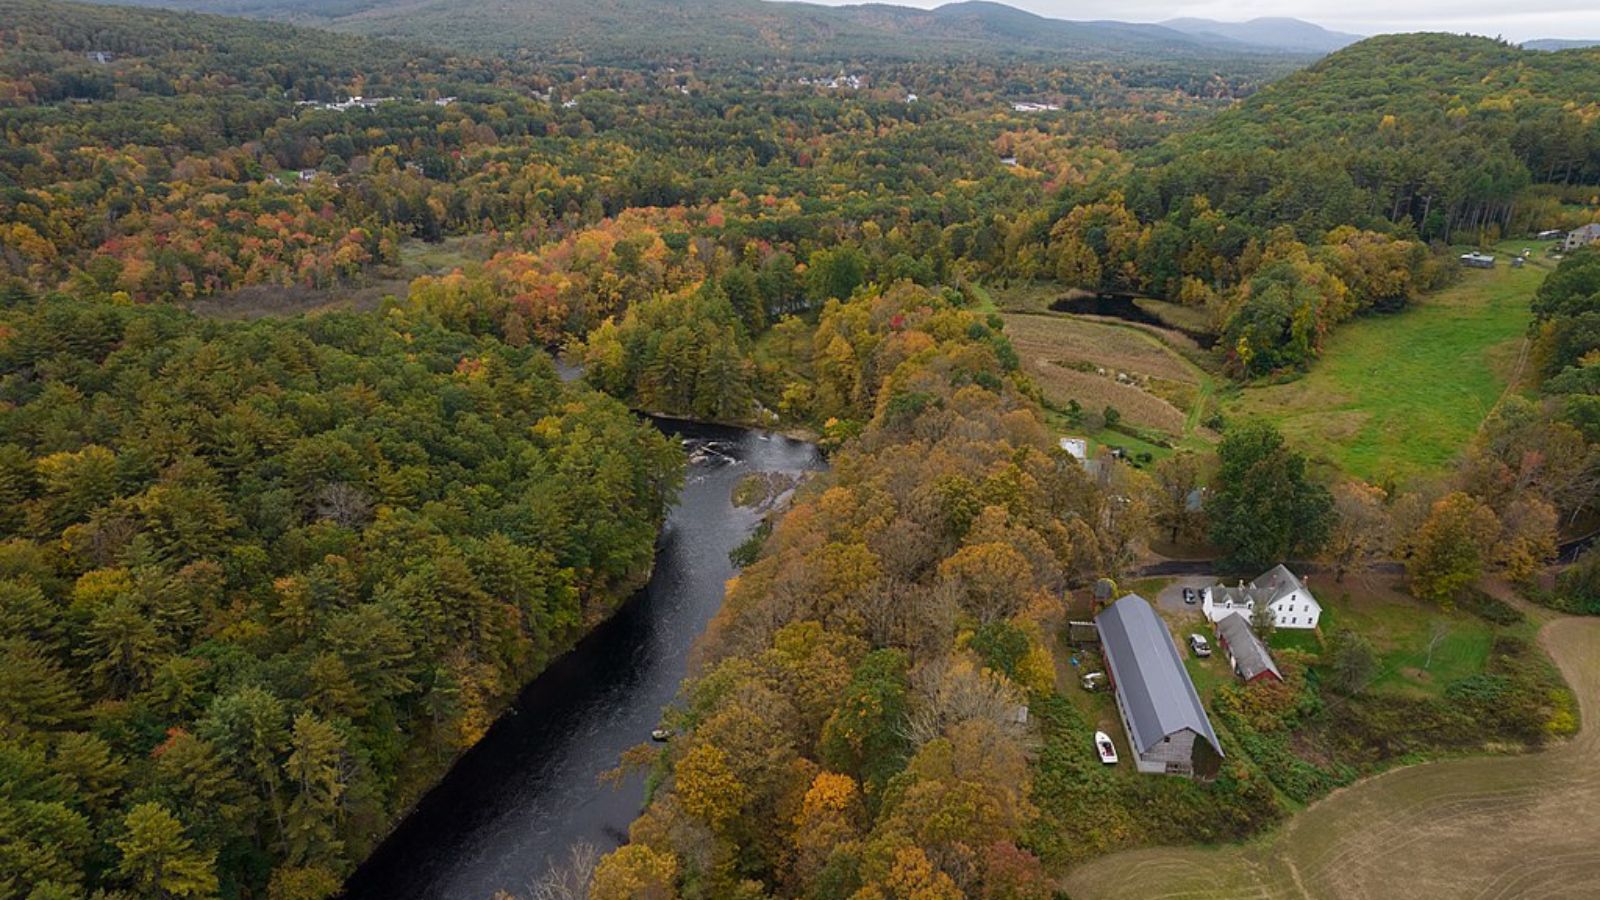
Pittsfield – Steady Growth in the Berkshires
As the largest city in Berkshire County, Pittsfield serves as a commercial and cultural hub for western Massachusetts. Its affordability relative to nearby markets and scenic setting make it attractive to first-time buyers and retirees alike. Continued investment in downtown revitalization and local industry has helped sustain demand.
Home values surged during the pandemic and kept rising through 2025, though recent gains have leveled off. Pittsfield offers a unique mix of small-city amenities and access to the outdoors, which supports consistent buyer interest. That balance keeps the market strong even in slower periods.
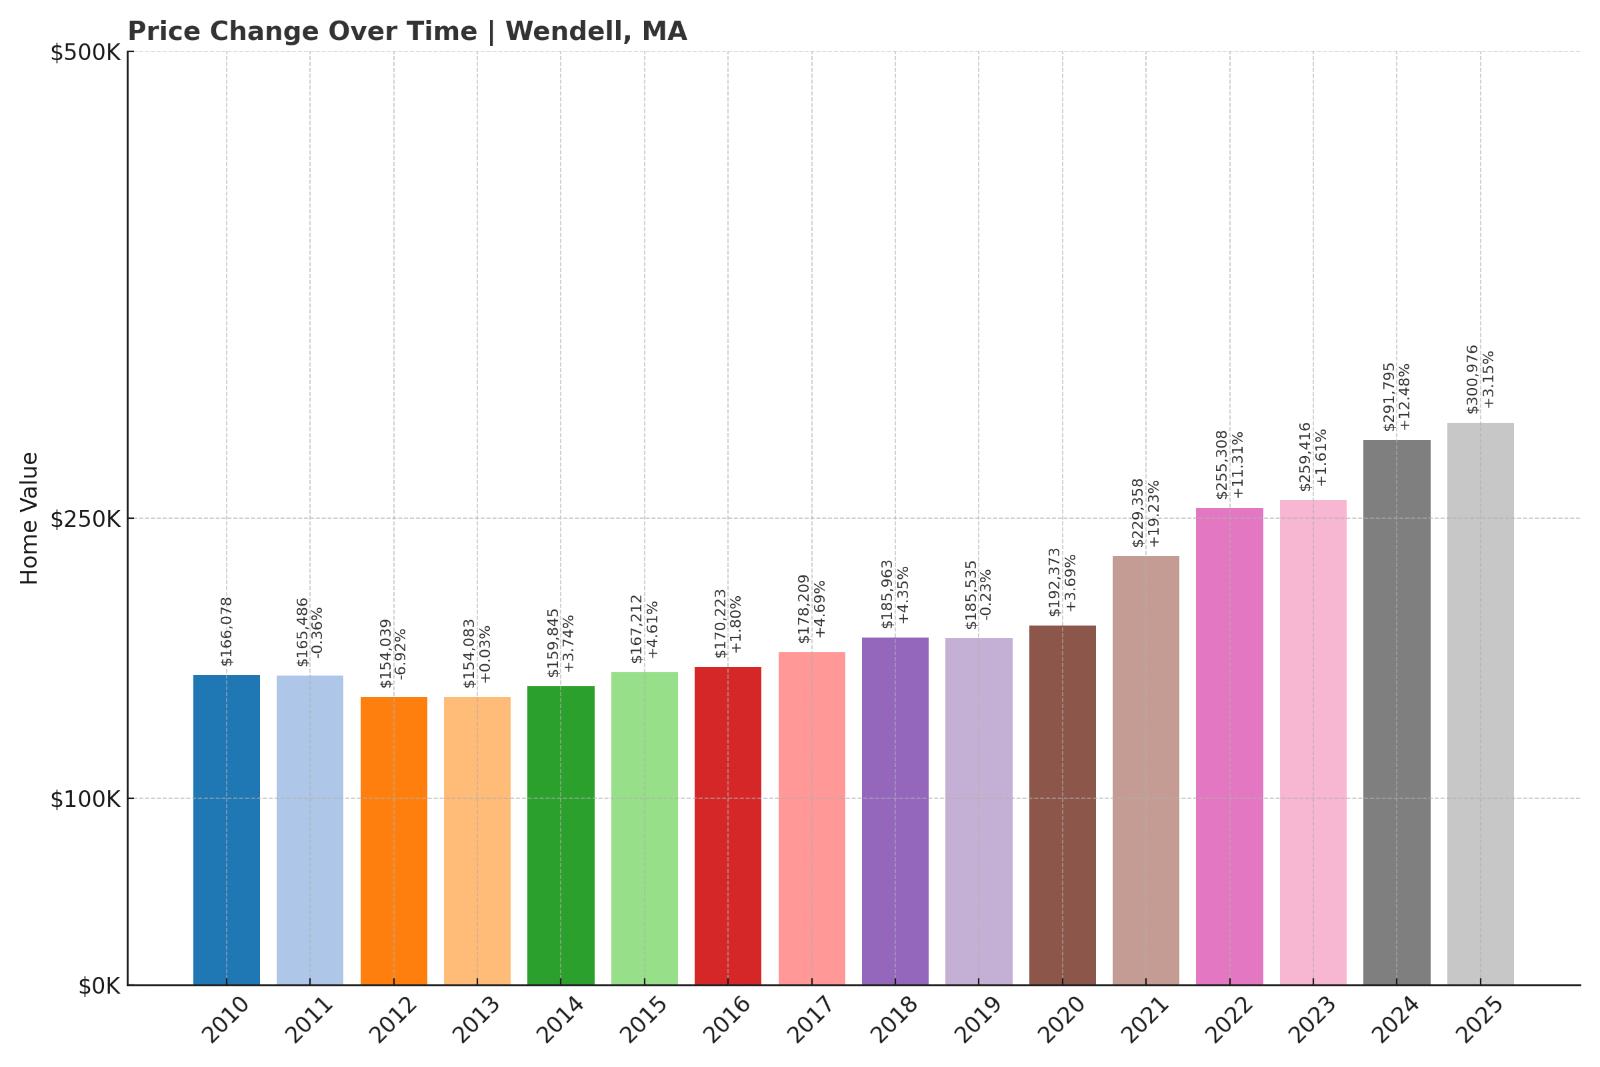
8. Wendell – 81.2% Home Price Increase Since 2010
- 2010: $166,078
- 2011: $165,486 ($-592, -0.36% from previous year)
- 2012: $154,039 ($-11,447, -6.92% from previous year)
- 2013: $154,083 (+$44, +0.03% from previous year)
- 2014: $159,845 (+$5,762, +3.74% from previous year)
- 2015: $167,212 (+$7,367, +4.61% from previous year)
- 2016: $170,223 (+$3,011, +1.80% from previous year)
- 2017: $178,209 (+$7,986, +4.69% from previous year)
- 2018: $185,963 (+$7,754, +4.35% from previous year)
- 2019: $185,535 ($-428, -0.23% from previous year)
- 2020: $192,373 (+$6,838, +3.69% from previous year)
- 2021: $229,358 (+$36,985, +19.23% from previous year)
- 2022: $255,308 (+$25,950, +11.31% from previous year)
- 2023: $259,416 (+$4,108, +1.61% from previous year)
- 2024: $291,795 (+$32,379, +12.48% from previous year)
- 2025: $300,976 (+$9,181, +3.15% from previous year)
Wendell’s home values climbed from $166,078 in 2010 to over $300,000 by 2025. The sharpest increases occurred between 2020 and 2022, when demand for rural homes skyrocketed. Even with some cooling since then, values have held steady and remain much higher than a decade ago.
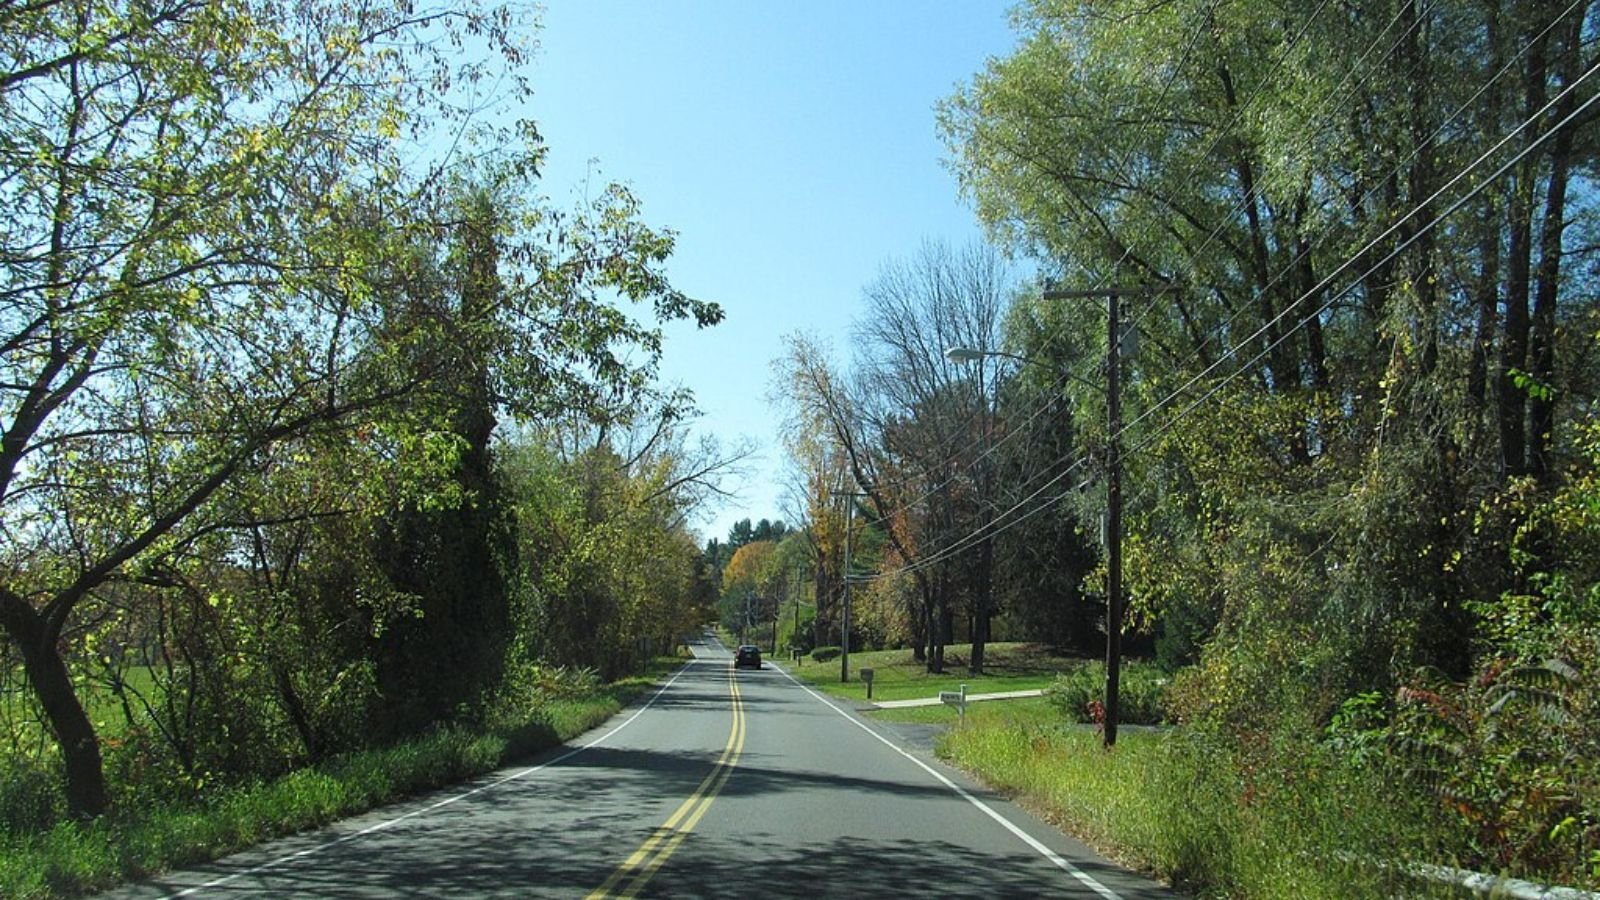
Wendell – Rural Appeal and Resilient Demand
Wendell is a small, forested town in Franklin County known for its off-grid living, creative community, and environmental focus. Its remote charm and proximity to conservation land make it an appealing retreat for buyers looking to escape city life. The town saw increased demand during the pandemic as remote work made rural life more practical.
Price growth has slowed in the last two years, but Wendell continues to command higher values than much of the region. The limited housing supply and tight-knit character contribute to the stability in prices. Buyers seeking solitude, space, and a self-sustaining lifestyle continue to show interest here.
7. Chester – 69.6% Home Price Increase Since 2010

- 2010: $175,135
- 2011: $167,947 ($-7,188, -4.10% from previous year)
- 2012: $144,869 ($-23,078, -13.74% from previous year)
- 2013: $151,378 (+$6,509, +4.49% from previous year)
- 2014: $156,073 (+$4,695, +3.10% from previous year)
- 2015: $159,052 (+$2,979, +1.91% from previous year)
- 2016: $166,856 (+$7,804, +4.91% from previous year)
- 2017: $174,138 (+$7,282, +4.36% from previous year)
- 2018: $176,328 (+$2,190, +1.26% from previous year)
- 2019: $184,005 (+$7,677, +4.35% from previous year)
- 2020: $194,279 (+$10,274, +5.58% from previous year)
- 2021: $227,063 (+$32,784, +16.87% from previous year)
- 2022: $255,134 (+$28,071, +12.36% from previous year)
- 2023: $259,240 (+$4,106, +1.61% from previous year)
- 2024: $284,802 (+$25,562, +9.86% from previous year)
- 2025: $296,941 (+$12,139, +4.26% from previous year)
Chester saw modest gains in the 2010s, with most of its price growth occurring between 2020 and 2022. Overall, home values increased by nearly 70% over 15 years. Recent years have brought smaller but steady increases, pushing the average price to just under $297,000 in 2025.
Chester – Affordable Gateway to the Hilltowns

Located in Hampden County on the western edge of the Pioneer Valley, Chester offers access to both the Berkshires and Springfield. Its setting on the edge of the Hilltowns gives buyers scenic views and a slower pace without losing reach of urban job centers. Interest in affordable, scenic towns has grown significantly since the pandemic.
Chester’s home prices began rising rapidly as more buyers were priced out of nearby regions. Its accessibility via Route 20 adds to its appeal, especially for those seeking a mix of affordability and natural beauty. Inventory remains tight, keeping prices on an upward trend.
6. Springfield – 108.9% Home Price Increase Since 2010
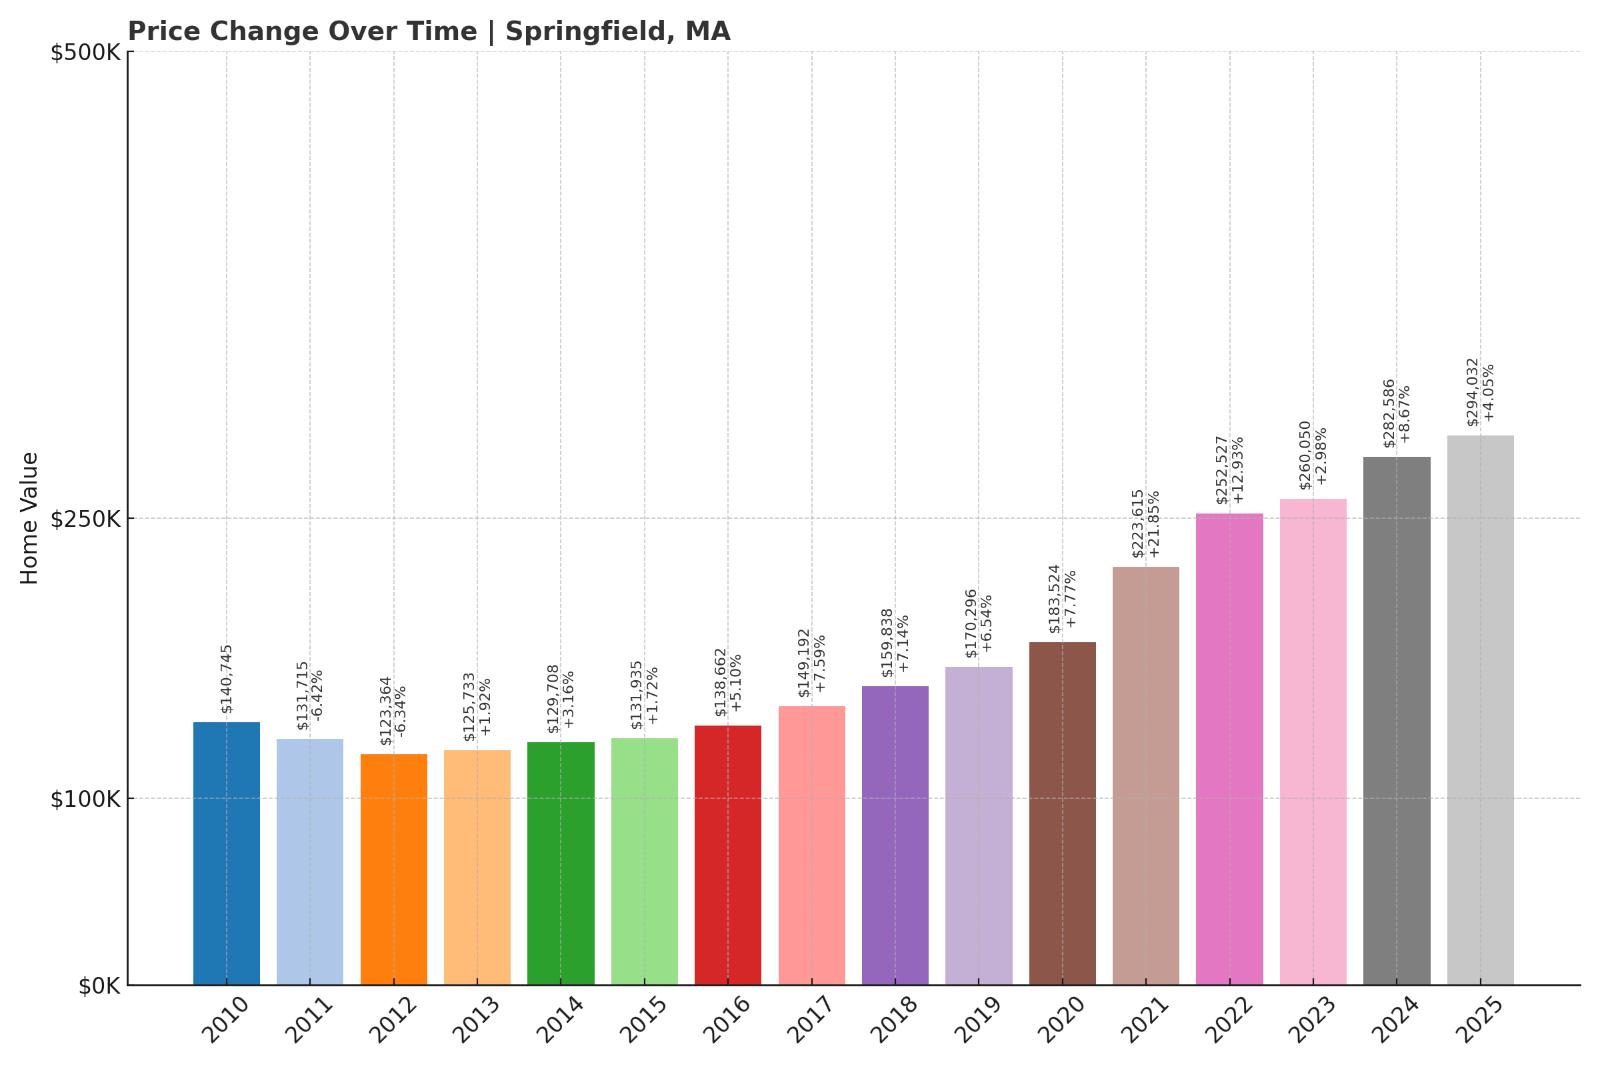
- 2010: $140,745
- 2011: $131,715 ($-9,030, -6.42% from previous year)
- 2012: $123,364 ($-8,351, -6.34% from previous year)
- 2013: $125,733 (+$2,369, +1.92% from previous year)
- 2014: $129,708 (+$3,975, +3.16% from previous year)
- 2015: $131,935 (+$2,227, +1.72% from previous year)
- 2016: $138,662 (+$6,727, +5.10% from previous year)
- 2017: $149,192 (+$10,530, +7.59% from previous year)
- 2018: $159,838 (+$10,646, +7.14% from previous year)
- 2019: $170,296 (+$10,458, +6.54% from previous year)
- 2020: $183,524 (+$13,228, +7.77% from previous year)
- 2021: $223,615 (+$40,091, +21.85% from previous year)
- 2022: $252,527 (+$28,912, +12.93% from previous year)
- 2023: $260,050 (+$7,523, +2.98% from previous year)
- 2024: $282,586 (+$22,536, +8.67% from previous year)
- 2025: $294,032 (+$11,446, +4.05% from previous year)
Springfield’s home prices have more than doubled since 2010, rising from just under $141,000 to over $294,000 in 2025. Gains have been especially strong since 2020, with huge jumps in 2021 and 2022. The city remains one of the more affordable options in the state despite the price growth.
Springfield – Urban Value with Room to Grow
Springfield is Massachusetts’ third-largest city and serves as a regional economic and cultural hub. It offers more housing stock and job diversity than many smaller towns, helping drive sustained demand. Buyers are drawn by relative affordability, even as prices climb steadily.
Revitalization efforts downtown and improved access via rail and highways have kept interest strong. The city’s growth is partly driven by buyers priced out of eastern Massachusetts markets. With a robust rental market and active local economy, Springfield is still considered a solid value buy in 2025.
5. Clarksburg – 73.6% Home Price Increase Since 2010
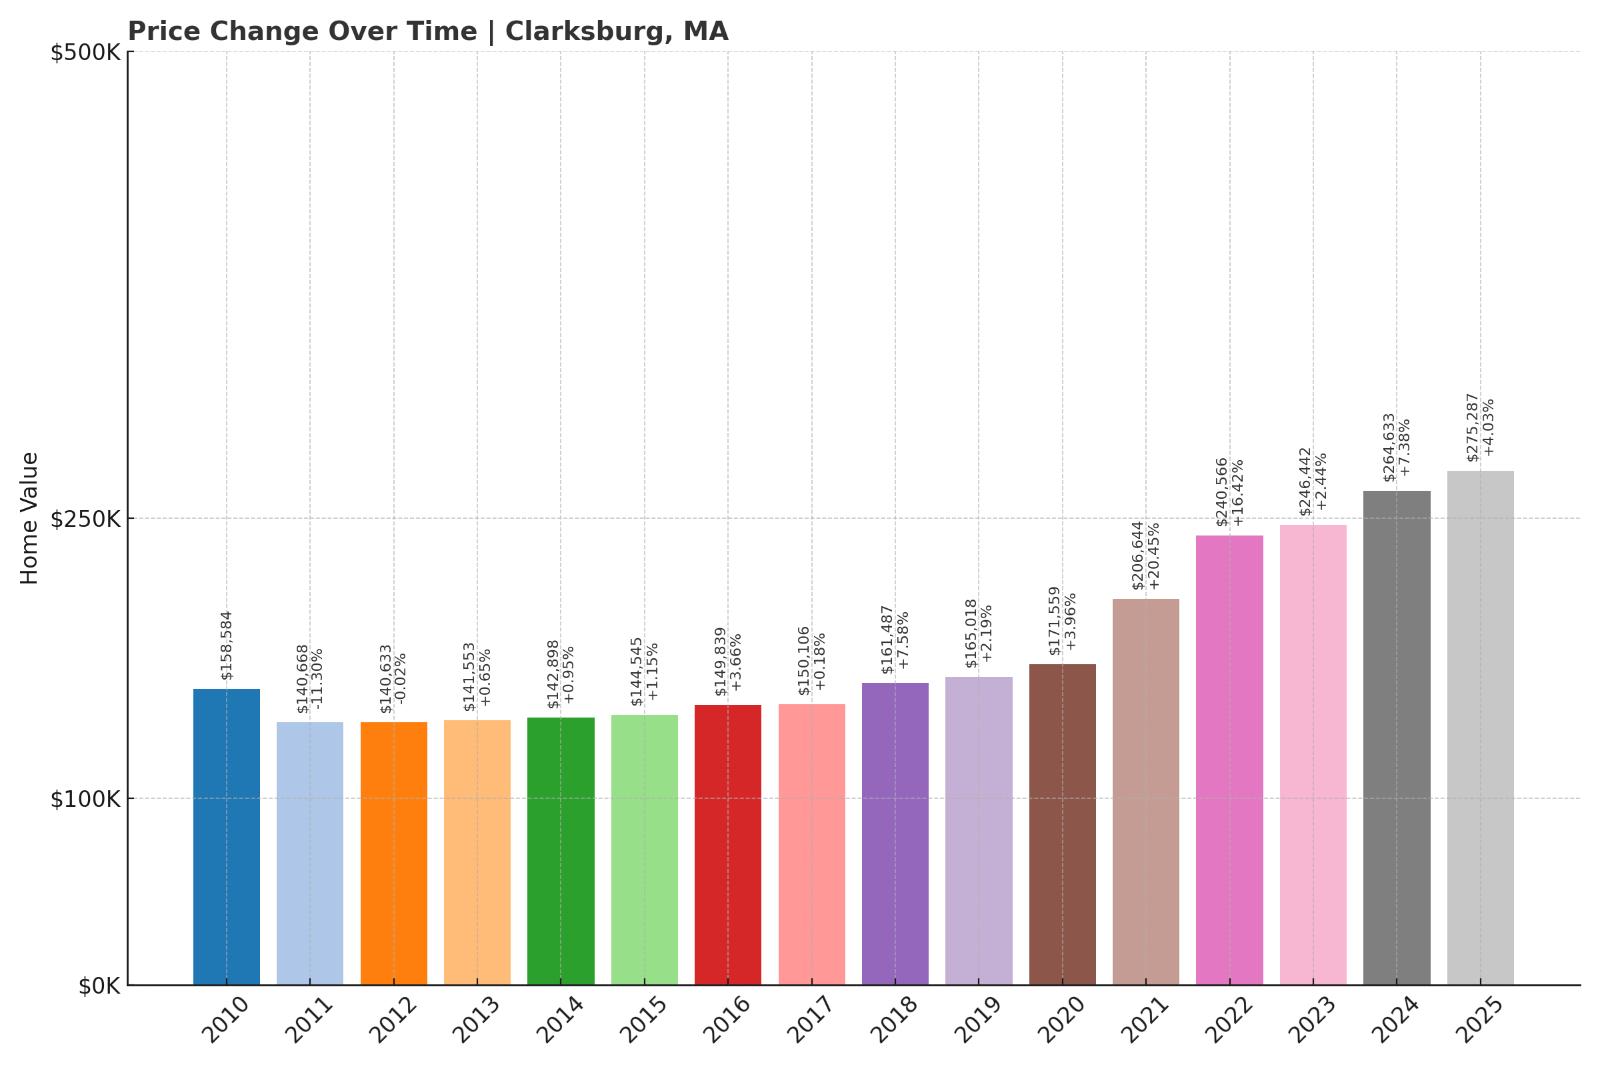
- 2010: $158,584
- 2011: $140,668 ($-17,916, -11.30% from previous year)
- 2012: $140,633 ($-35, -0.02% from previous year)
- 2013: $141,553 (+$920, +0.65% from previous year)
- 2014: $142,898 (+$1,345, +0.95% from previous year)
- 2015: $144,545 (+$1,647, +1.15% from previous year)
- 2016: $149,839 (+$5,294, +3.66% from previous year)
- 2017: $150,106 (+$267, +0.18% from previous year)
- 2018: $161,487 (+$11,381, +7.58% from previous year)
- 2019: $165,018 (+$3,531, +2.19% from previous year)
- 2020: $171,559 (+$6,541, +3.96% from previous year)
- 2021: $206,644 (+$35,085, +20.45% from previous year)
- 2022: $240,566 (+$33,922, +16.42% from previous year)
- 2023: $246,442 (+$5,876, +2.44% from previous year)
- 2024: $264,633 (+$18,191, +7.38% from previous year)
- 2025: $275,287 (+$10,654, +4.03% from previous year)
Clarksburg’s home prices grew from $158,584 in 2010 to $275,287 in 2025, a nearly 74% increase. Much of the increase occurred after 2020, with double-digit gains in 2021 and 2022. Though gains have tapered off, home values continue rising modestly.
Clarksburg – Scenic, Affordable, and Climbing
Situated on the Vermont border, Clarksburg is a small, rural town known for natural beauty and proximity to North Adams. Its quiet atmosphere and affordable homes attract both full-time residents and second-home buyers. The town’s seclusion and scenery are strong selling points.
Clarksburg’s limited inventory has contributed to rising values, especially post-pandemic. Buyers seeking space and peace have driven up demand, particularly among those looking outside of major metro areas. The town continues to offer value compared to statewide averages.
4. Adams – 97.1% Home Price Increase Since 2010

- 2010: $132,261
- 2011: $130,452 ($-1,809, -1.37% from previous year)
- 2012: $127,667 ($-2,785, -2.13% from previous year)
- 2013: $126,017 ($-1,650, -1.29% from previous year)
- 2014: $129,514 (+$3,497, +2.78% from previous year)
- 2015: $129,025 ($-489, -0.38% from previous year)
- 2016: $136,517 (+$7,492, +5.81% from previous year)
- 2017: $138,863 (+$2,346, +1.72% from previous year)
- 2018: $145,540 (+$6,677, +4.81% from previous year)
- 2019: $148,728 (+$3,188, +2.19% from previous year)
- 2020: $156,314 (+$7,586, +5.10% from previous year)
- 2021: $183,461 (+$27,147, +17.37% from previous year)
- 2022: $212,349 (+$28,888, +15.75% from previous year)
- 2023: $222,867 (+$10,518, +4.95% from previous year)
- 2024: $242,147 (+$19,280, +8.65% from previous year)
- 2025: $260,681 (+$18,534, +7.65% from previous year)
Adams has seen its average home price nearly double since 2010, with values jumping from $132,261 to $260,681. The most dramatic increases came after 2020, particularly in 2021 and 2022. Price growth has remained strong through 2025, driven by demand for affordability in Berkshire County.
Adams – Revitalizing with Value
Located at the base of Mount Greylock, Adams is a small Berkshire town with historic roots and a growing reputation. Its downtown has undergone revitalization in recent years, drawing both investors and residents. Outdoor access and affordability make it especially attractive for younger buyers and second-home seekers.
Home prices surged during the post-pandemic boom and have continued rising steadily. Despite nearly doubling in value, Adams remains far less expensive than surrounding tourist-heavy towns. Its balance of charm, community, and cost continues to appeal to value-focused buyers.
3. Florida – 92.9% Home Price Increase Since 2010
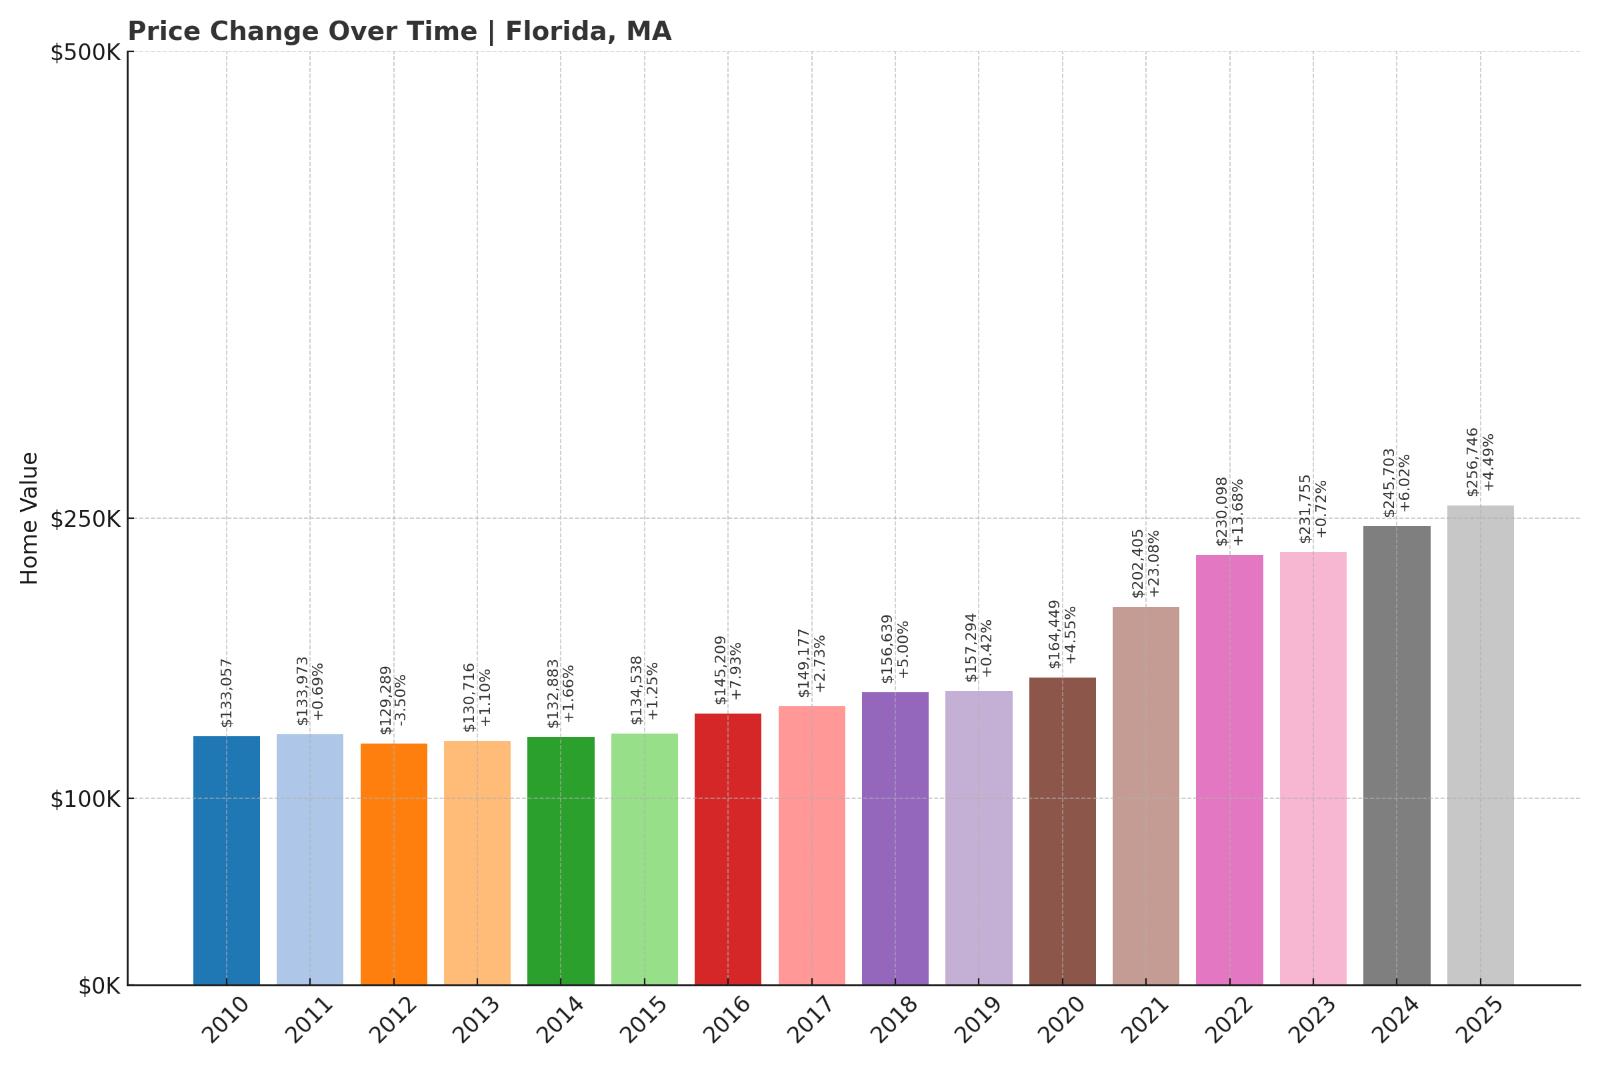
- 2010: $133,057
- 2011: $133,973 (+$916, +0.69% from previous year)
- 2012: $129,289 ($-4,684, -3.50% from previous year)
- 2013: $130,716 (+$1,427, +1.10% from previous year)
- 2014: $132,883 (+$2,167, +1.66% from previous year)
- 2015: $134,538 (+$1,655, +1.25% from previous year)
- 2016: $145,209 (+$10,671, +7.93% from previous year)
- 2017: $149,177 (+$3,968, +2.73% from previous year)
- 2018: $156,639 (+$7,462, +5.00% from previous year)
- 2019: $157,294 (+$655, +0.42% from previous year)
- 2020: $164,449 (+$7,155, +4.55% from previous year)
- 2021: $202,405 (+$37,956, +23.08% from previous year)
- 2022: $230,098 (+$27,693, +13.68% from previous year)
- 2023: $231,755 (+$1,657, +0.72% from previous year)
- 2024: $245,703 (+$13,948, +6.02% from previous year)
- 2025: $256,746 (+$11,043, +4.49% from previous year)
Florida, Massachusetts has seen nearly 93% home price growth since 2010, rising from $133,057 to $256,746 in 2025. Most of the increase happened after 2020, with particularly steep jumps in 2021 and 2022. More modest gains since then suggest a stabilizing but resilient market.
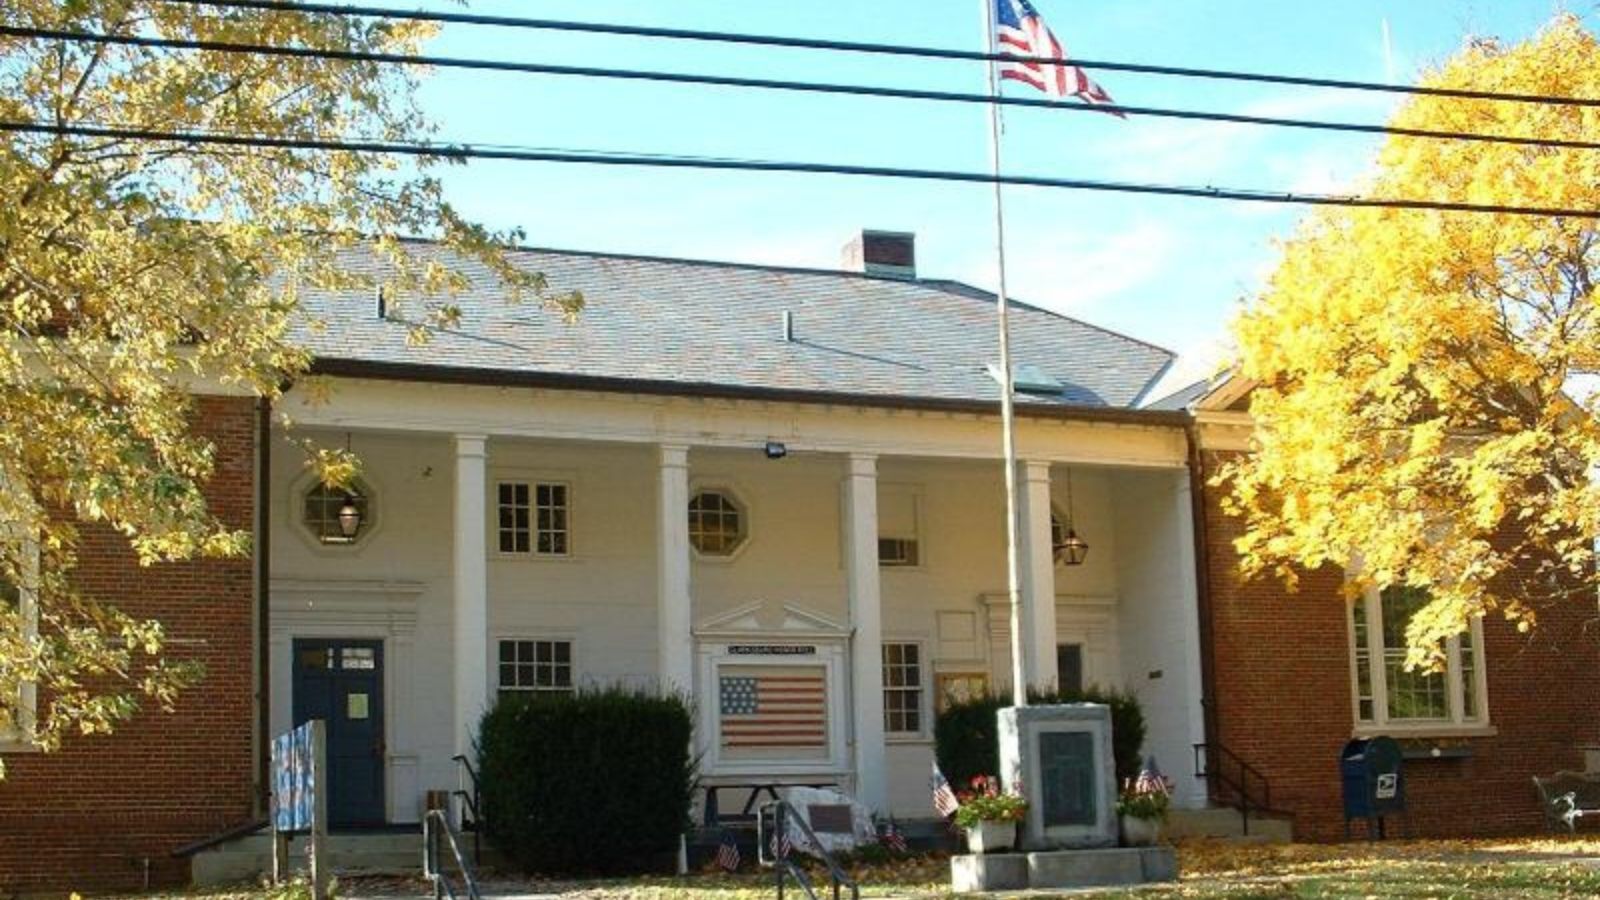
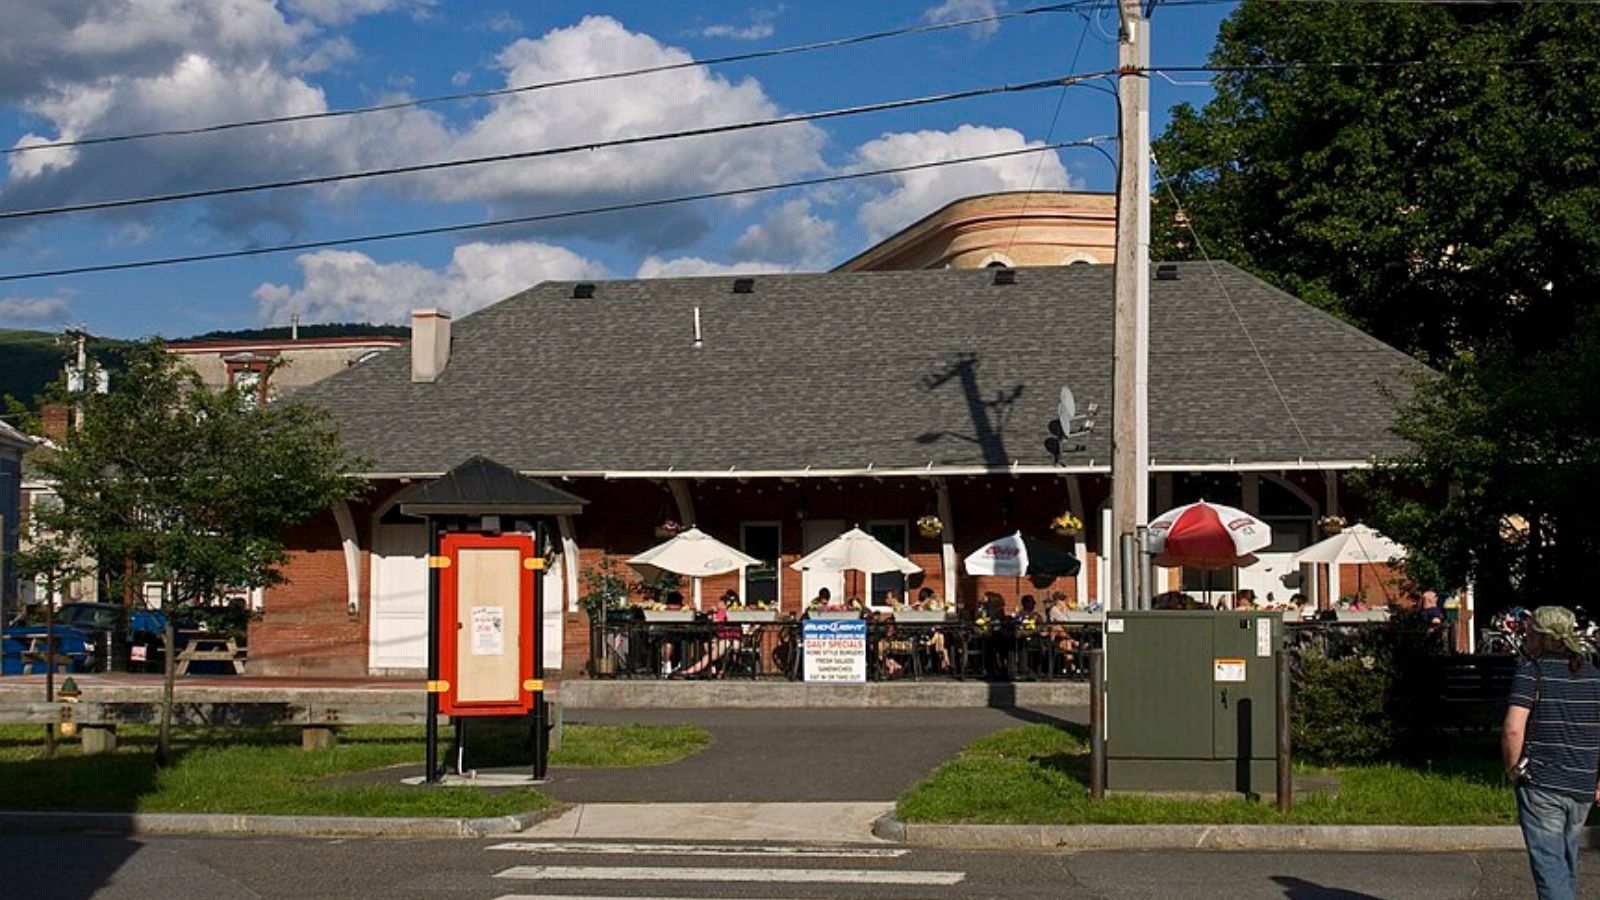
Florida – Hilltop Affordability in the Berkshires
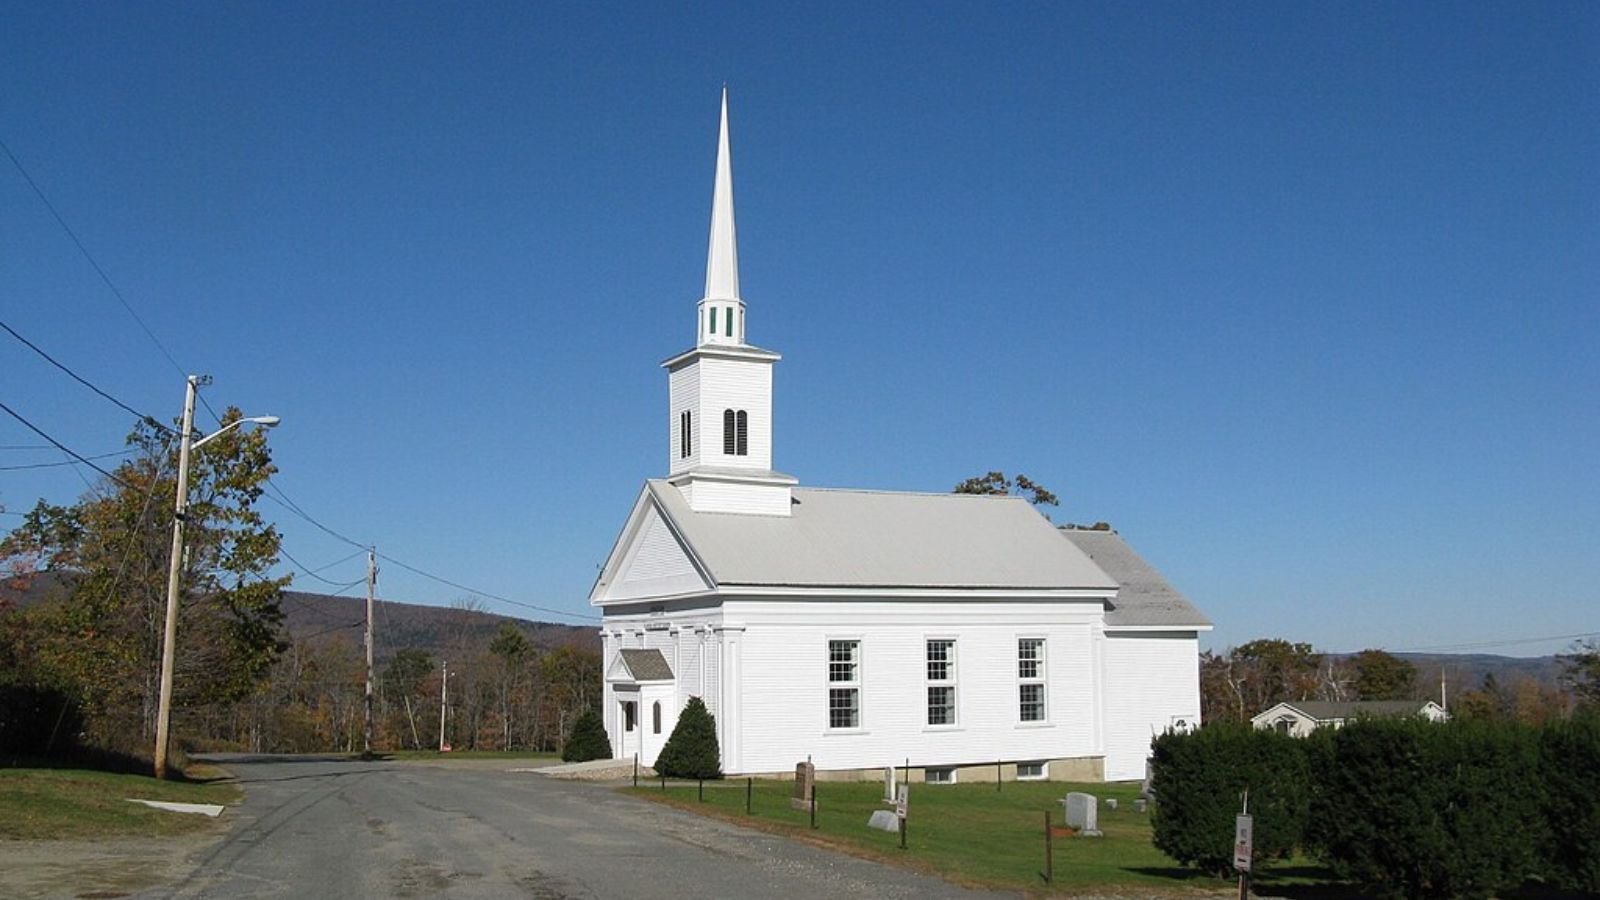
Perched along the Mohawk Trail, Florida is a small hilltown offering sweeping views and quiet surroundings. The town remains one of the most affordable in the region, despite strong price gains in recent years. Buyers value its peace, low taxes, and access to outdoor recreation.
Florida’s small housing stock means even small changes in demand can influence prices. As more people looked west for affordability during the pandemic, demand surged. The town’s unique mix of seclusion and scenery keeps it appealing for both seasonal and full-time residents.
2. North Adams – 105.5% Home Price Increase Since 2010
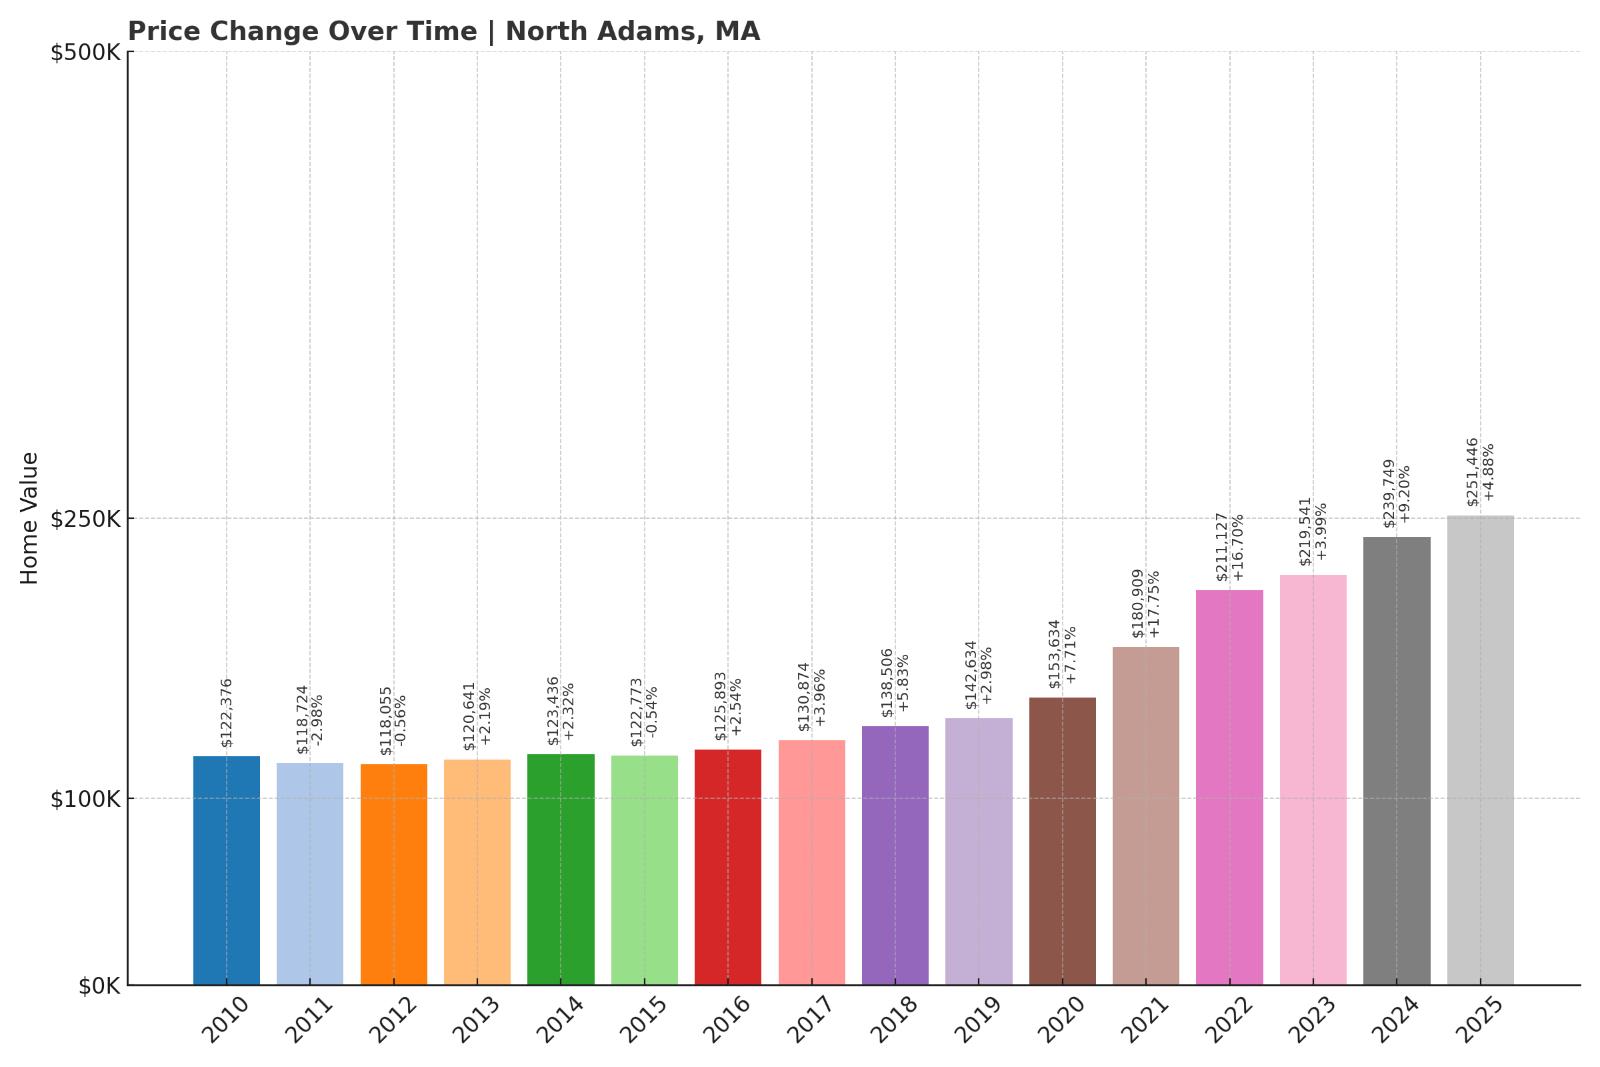
- 2010: $122,376
- 2011: $118,724 ($-3,652, -2.98% from previous year)
- 2012: $118,055 ($-669, -0.56% from previous year)
- 2013: $120,641 (+$2,586, +2.19% from previous year)
- 2014: $123,436 (+$2,795, +2.32% from previous year)
- 2015: $122,773 ($-663, -0.54% from previous year)
- 2016: $125,893 (+$3,120, +2.54% from previous year)
- 2017: $130,874 (+$4,981, +3.96% from previous year)
- 2018: $138,506 (+$7,632, +5.83% from previous year)
- 2019: $142,634 (+$4,128, +2.98% from previous year)
- 2020: $153,634 (+$11,000, +7.71% from previous year)
- 2021: $180,909 (+$27,275, +17.75% from previous year)
- 2022: $211,127 (+$30,218, +16.70% from previous year)
- 2023: $219,541 (+$8,414, +3.99% from previous year)
- 2024: $239,749 (+$20,208, +9.20% from previous year)
- 2025: $251,446 (+$11,697, +4.88% from previous year)
North Adams home prices have risen from $122,376 in 2010 to $251,446 in 2025, more than doubling over the period. Growth was especially steep between 2020 and 2022, when the town saw large year-over-year gains. Prices have continued to climb since, though at a slower pace.
North Adams – Arts, Access, and Affordability
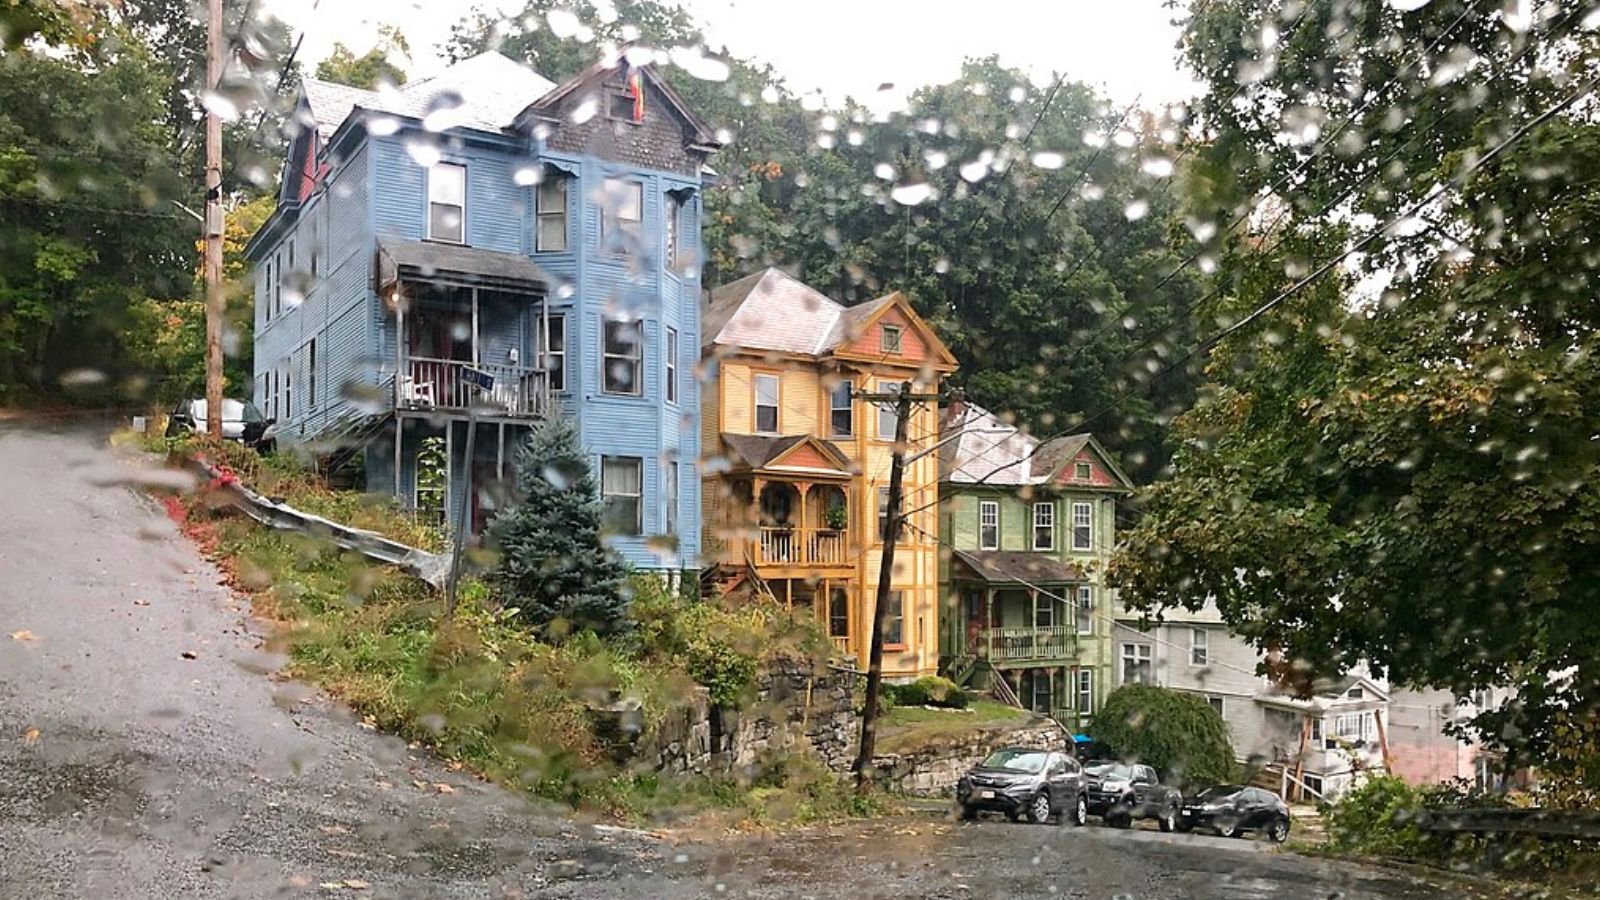
Home to MASS MoCA and several colleges, North Adams blends cultural vitality with rural affordability. Its arts scene, mountain views, and reasonable prices make it attractive to a wide range of buyers. The town has drawn steady interest from both investors and first-time buyers in recent years.
With more people relocating to smaller cities, North Adams saw a spike in demand during the pandemic. That interest has continued thanks to its amenities and livability. Home values remain affordable relative to the rest of the state, even after more than doubling.
1. Heath – 48.8% Home Price Increase Since 2010
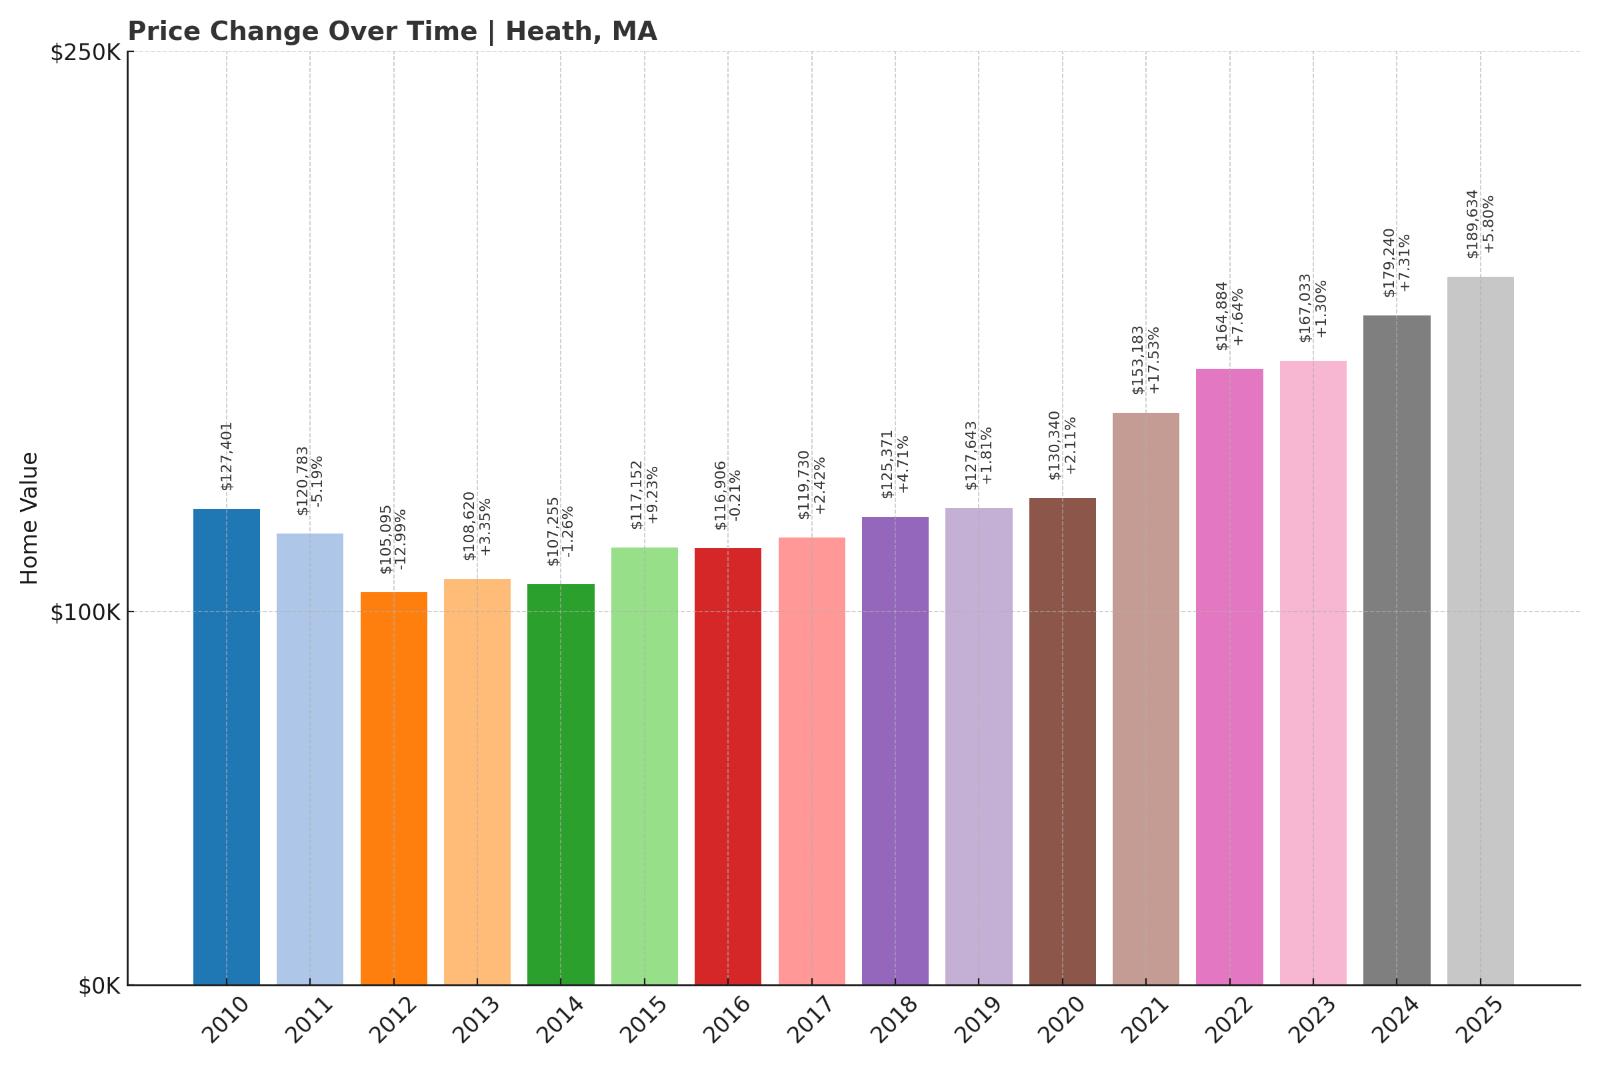
- 2010: $127,401
- 2011: $120,783 ($-6,618, -5.19% from previous year)
- 2012: $105,095 ($-15,688, -12.99% from previous year)
- 2013: $108,620 (+$3,525, +3.35% from previous year)
- 2014: $107,255 ($-1,365, -1.26% from previous year)
- 2015: $117,152 (+$9,897, +9.23% from previous year)
- 2016: $116,906 ($-246, -0.21% from previous year)
- 2017: $119,730 (+$2,824, +2.42% from previous year)
- 2018: $125,371 (+$5,641, +4.71% from previous year)
- 2019: $127,643 (+$2,272, +1.81% from previous year)
- 2020: $130,340 (+$2,697, +2.11% from previous year)
- 2021: $153,183 (+$22,843, +17.53% from previous year)
- 2022: $164,884 (+$11,701, +7.64% from previous year)
- 2023: $167,033 (+$2,149, +1.30% from previous year)
- 2024: $179,240 (+$12,207, +7.31% from previous year)
- 2025: $189,634 (+$10,394, +5.80% from previous year)
Heath’s home values increased by just under 49% from 2010 to 2025, one of the lowest growth rates in the state. Still, prices have risen from $127,401 to $189,634, with the biggest jump occurring in 2021. Since then, growth has continued at a moderate pace.
Heath – Quiet, Remote, and In Demand
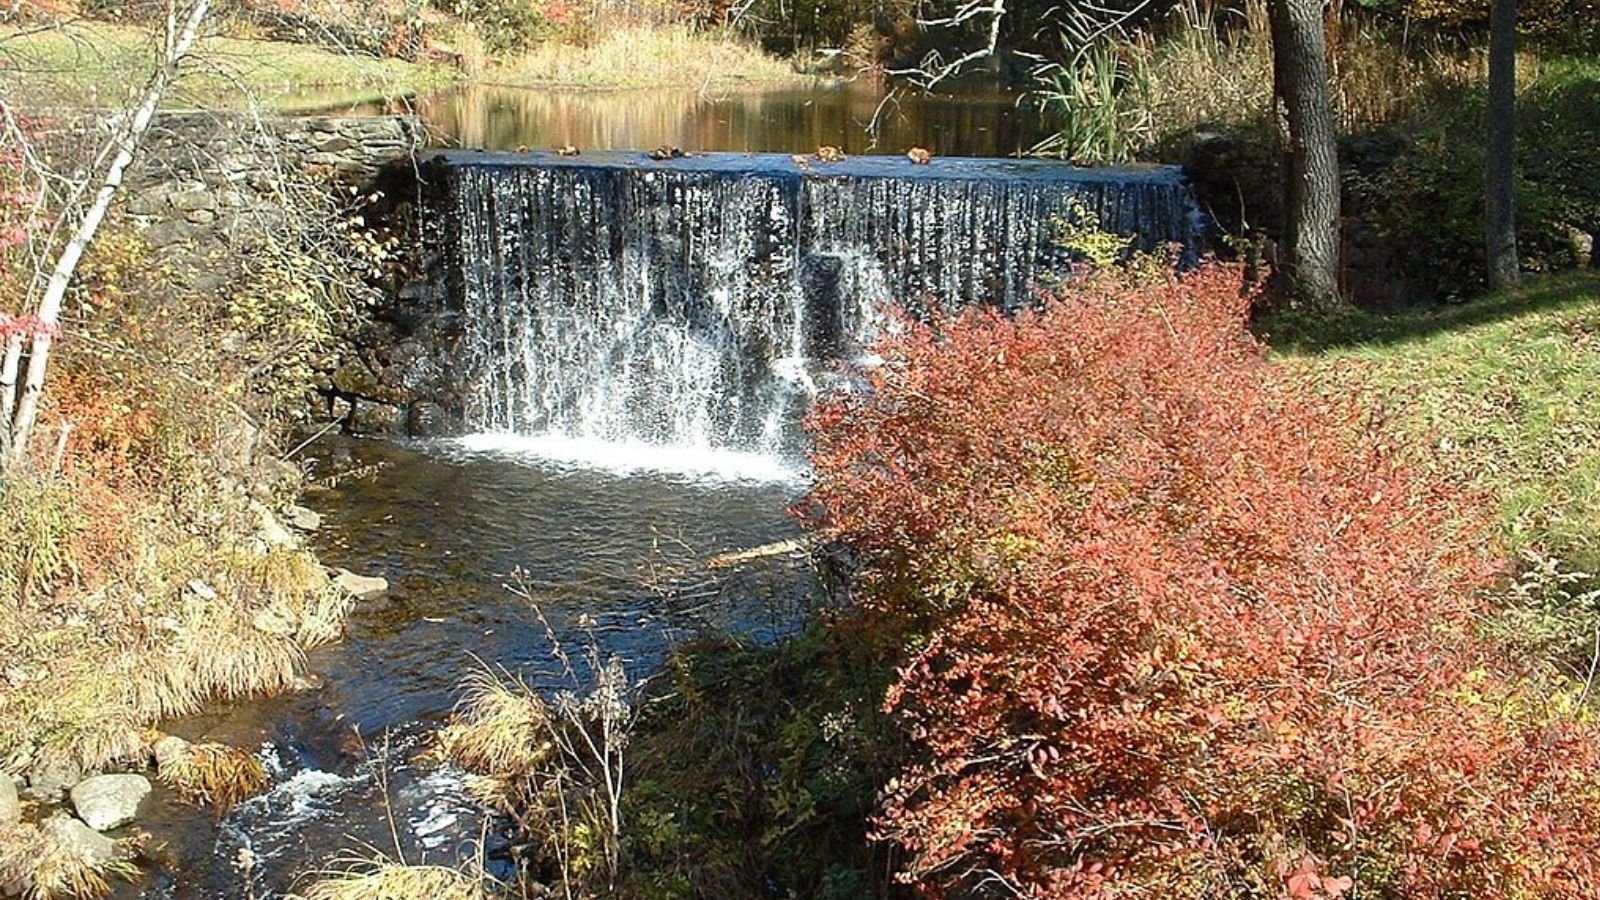
Heath is a tiny hilltown on the Vermont border known for its isolation, farmland, and rural character. With no major commercial center, the town appeals mostly to those looking for solitude and simplicity. It remains one of the least expensive places in the state to buy a home.
Price growth has been modest compared to other areas, but Heath has still seen rising demand. Its affordability and scenic views attract off-grid enthusiasts and part-time residents. As rural living gains favor, Heath’s low baseline prices give it room to grow.