
Despite recent volatility and sharp pullbacks, XRP, the third-largest crypto asset, has strongly maintained its position above the $2 price mark. With multiple indicators flashing bullish signals, the altcoin’s ongoing upward action may extend toward higher price levels in the upcoming days.
A Bullish Pattern Emerging On The XRP Chart
XRP has regained upside traction as the asset saw a sudden bounce on Monday. Its sudden upsurge has drawn the attention of the market, with crypto analysts predicting an impending surge toward key resistance levels.
After examining the current price action, Ali Martinez, a technical analyst and investor, has underscored the potential for XRP to surge in the upcoming days. Presently, the asset is capturing fresh attention in the crypto market as a compelling chart formation unfolds on the 1-hour time frame chart.
Specifically, Ali Martinez highlighted that an Inverse Head and Shoulders pattern is emerging on the XRP’s chart, indicating a growing bullish momentum. With this pattern unfolding, it serves as a sign that the altcoin could be gearing up for a breakout move.
An inverse head and shoulders formation is a technical chart pattern that is characterized by a lower trough as the head and two higher troughs as the shoulders. This technical pattern is considered a bullish structure that hints at a change in direction from the downside to the upside.
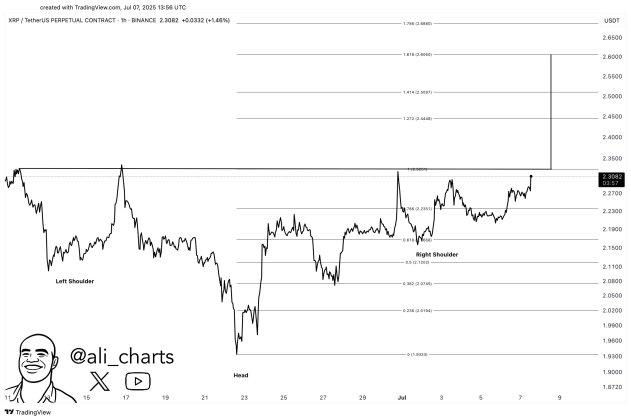
According to the expert, the emergence of the inverse head and shoulders pattern is setting the stage for a potential bounce. Once the altcoin breaks out of the pattern, Martinez anticipates a push toward the $2.60 mark, positioned at the 1.618 Fibonacci level.
While the experts foresee a bounce to the $2.60 zone, XRP is likely to witness several hurdles before rallying to this level. Looking at the chart shared by Martinez, the first key hurdle is the $2.45 range at the 1.272 fib level after a breakout occurs.
If XRP surpasses this crucial level, the subsequent resistance is positioned at $2.50, with a fib of 1.414. Given that the current bullish market state persists, the token could break this level and finally hit the anticipated $2.560 target.
Is The Current Surge The Beginning Of A Move To New Heights?
Although XRP is witnessing brief upside actions, a massive rally may be imminent. Captain Faibik, a crypto analyst, has predicted a surge to a new all-time high as momentum builds.
According to the expert, XRP’s price is on the verge of the next bullish rally, with a breakout in sight. Captain Faibik’s forecast is based on an impending breakout from a massive triangle pattern, which appears to have been visible since November last year.
When this breakout from the triangle pattern takes place, Captain Faibik expects the altcoin to rally to uncharted territory, placing the next target at $4.60. The analyst believes this fresh price level could be attained in Q3, as the quarter is setting up to be “an absolute monster rally.”
Featured image from Getty Images, chart from Tradingview.com
Editorial Process for bitcoinist is centered on delivering thoroughly researched, accurate, and unbiased content. We uphold strict sourcing standards, and each page undergoes diligent review by our team of top technology experts and seasoned editors. This process ensures the integrity, relevance, and value of our content for our readers.