Designing visuals that respond to real-time data or user input usually means switching between multiple tools — one for animation, another for logic, and yet another for implementation. This back-and-forth can slow down iteration, make small changes cumbersome, and create a disconnect between design and behavior.
If you’ve spent any time with Rive, you know it’s built to close that gap. It lets you design, animate, and add interaction all in one place — and with features like state machines and data binding, you can make your animations respond directly to variables and user actions.
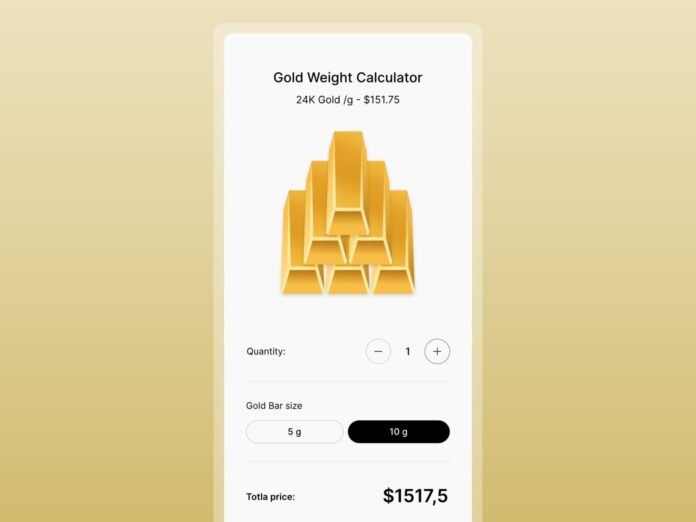
To demonstrate how we use data binding in Rive, we built a small interactive project — a gold calculator. The task was simple: calculate the price of 5g and 10g gold bars, from 1 to 6 bars, using external data for the current gold price per gram. The gold price can be dynamic, typically coming from market data, but in this case we used a manually set value.
Let’s break down how the calculator is built, step by step, starting with the layout and structure of the file.
1. File Structure
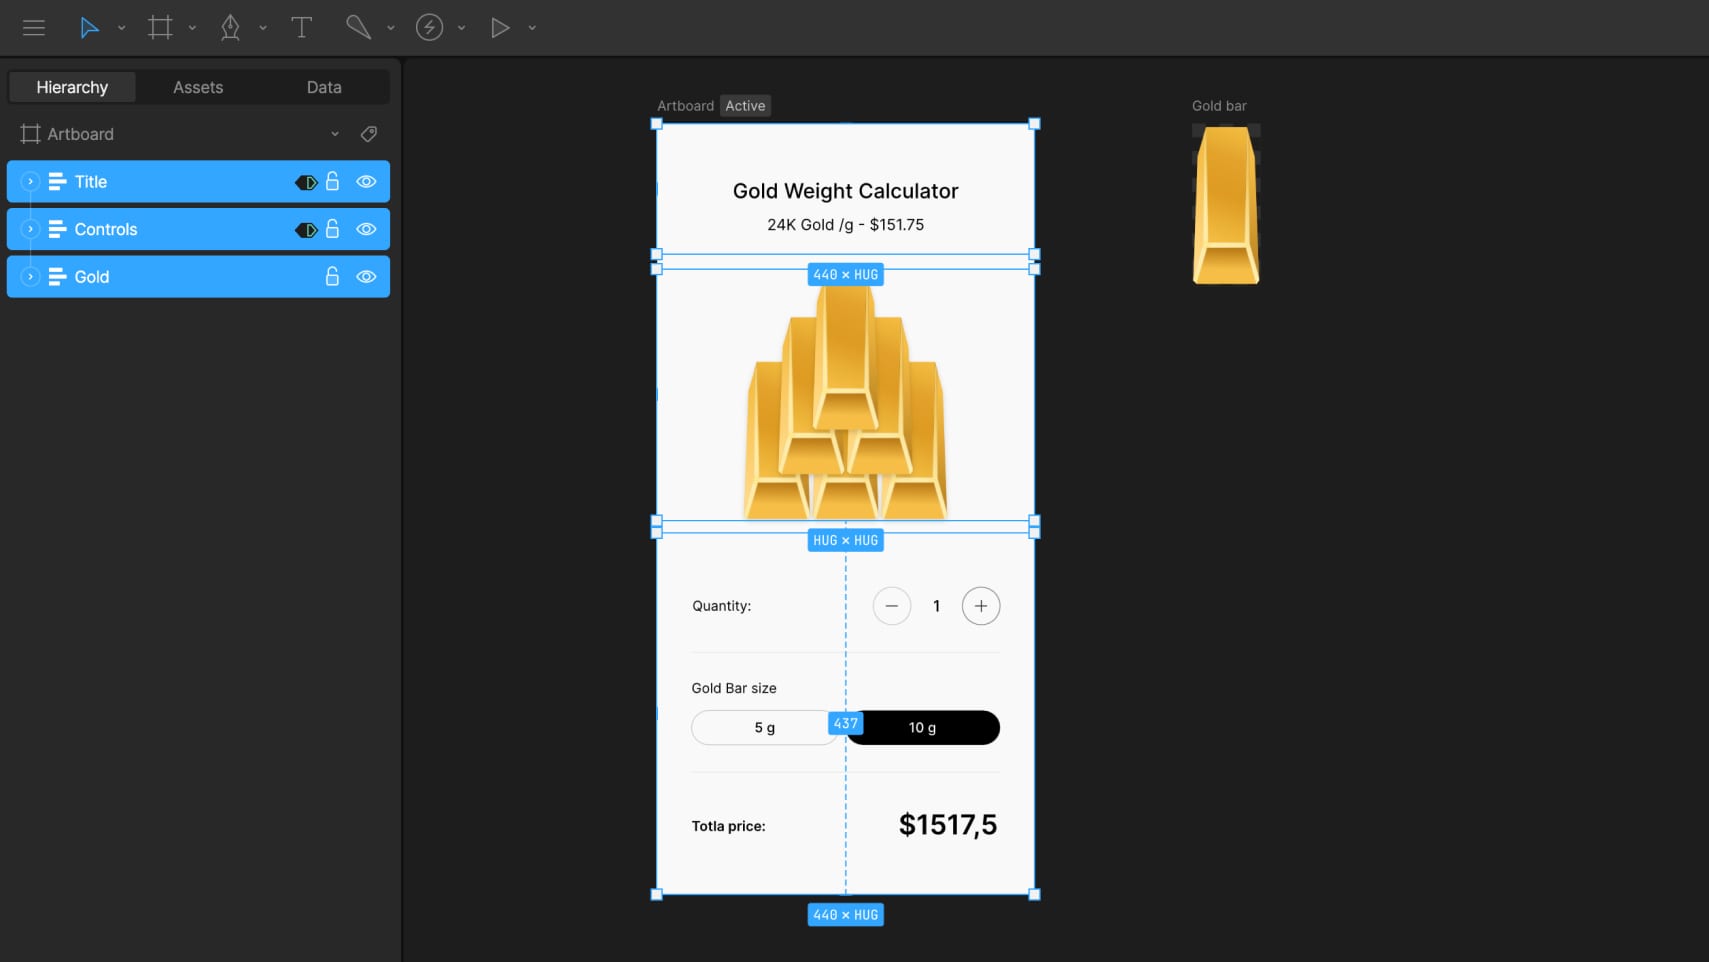
The layout is built for mobile, using a 440×900 px artboard. It’s structured around three layout groups:
- Title with gold price per gram
- Controls for choosing gold bar amount and weight
- Gold bar illustration
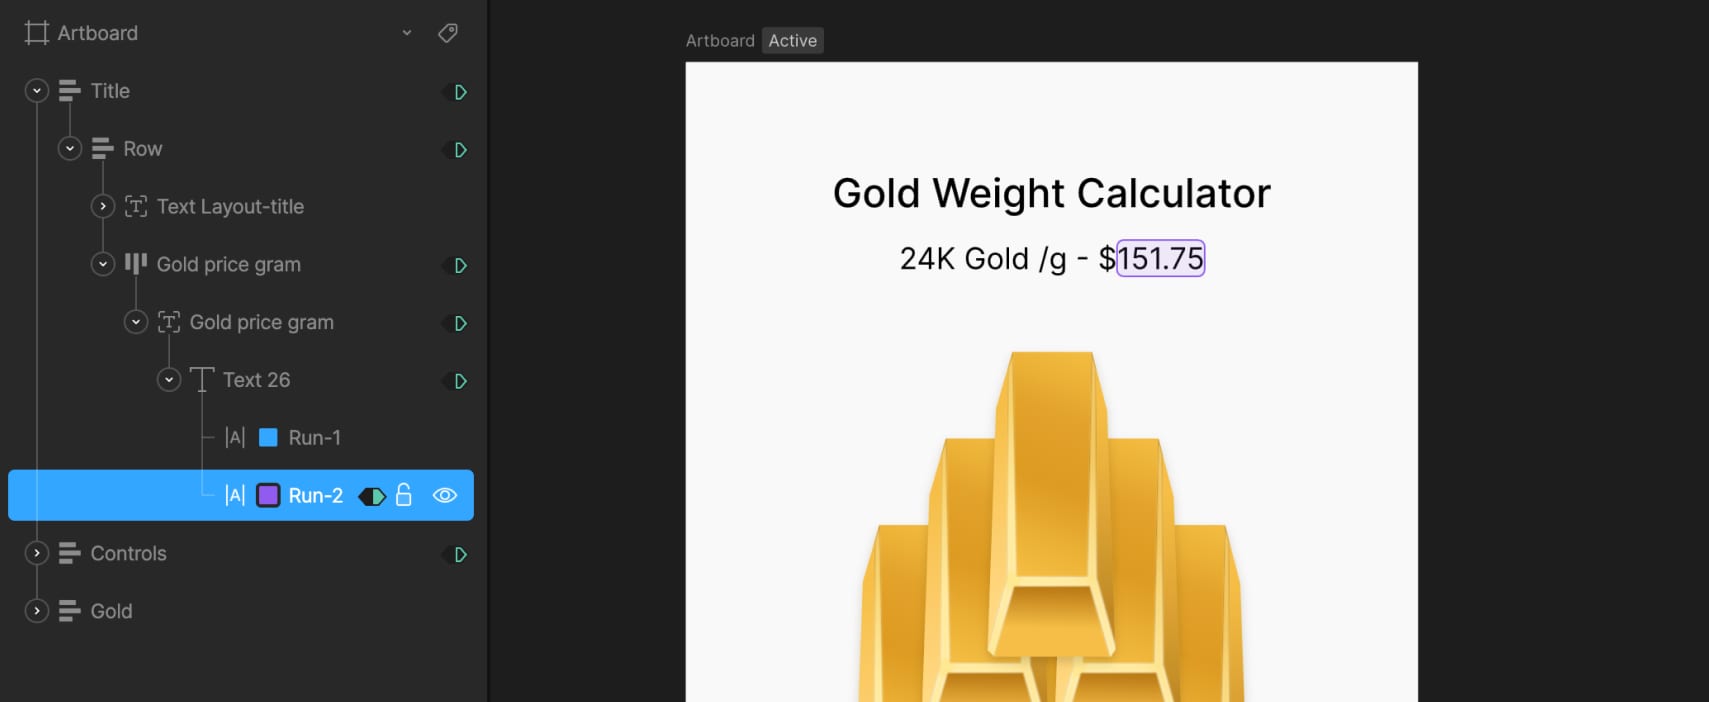
The title section includes a text layout made of two text runs: one holds static text like the label, while the other is dynamic and connected to external data using data binding. This allows the gold price to update in real time when the data changes.
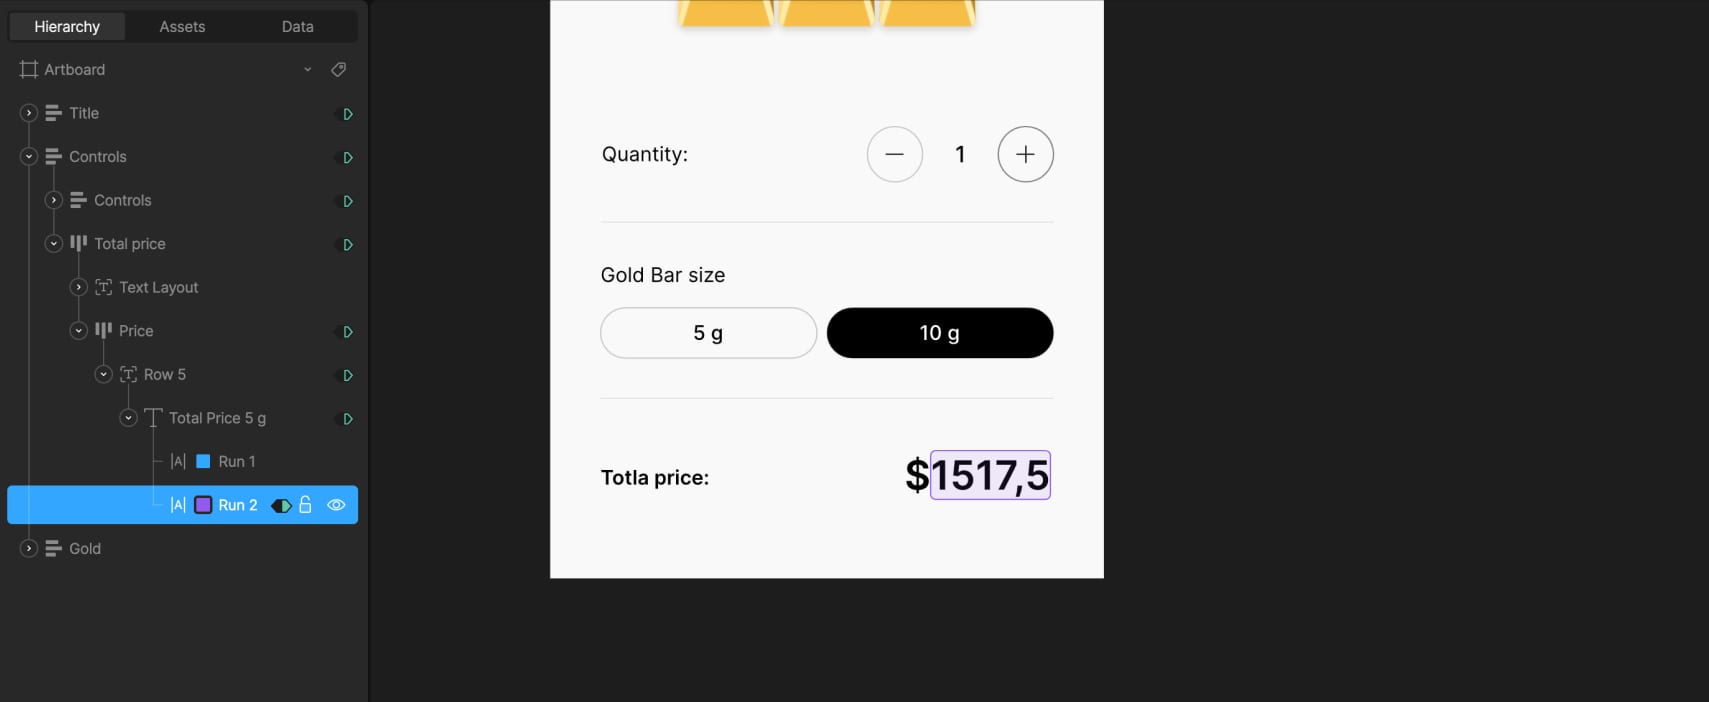
In the controls section, we added plus and minus buttons to set the number of gold bars. These are simple layouts with icons inside. Below them, there are two buttons to switch between 5g and 10g options. They’re styled as rounded layouts with text inside.
In the state machine, two timelines define the tab states: one for when the 10g button is active, using a solid black background and white text, and another for 5g, with reversed styles. Switching between these two updates the active tab visually.
The total price section also uses two text runs — one for the currency icon and one for the total value. This value changes based on the selected weight and quantity, and is driven by data binding.
2. Gold Bar Illustration
The illustration is built using a nested artboard with a single vector gold bar. Inside the calculator layout, we duplicated this artboard to show anywhere from 1 to 6 bars depending on the user’s selection.
Since there are two weight options, we made the gold bar resize visually — wider for 10g and narrower for 5g. To do that, we used N-Slices so that the edges stay intact and only the middle stretches. The sliced group sits inside a fixed-size layout, and the artboard is set to Hug its contents, which lets it resize automatically.
Created two timelines to control bar size: one where the width is 88px for 10g, and another at 74px for 5g. The switch between them is controlled by a number variable called Size-gram gold, where 5g is represented by 0 and 10g by 1 with 1 set as the default value.
In the state machine, we connected this variable to the two timelines (the 10g timeline set as the default)— when it’s set to 0, the layout switches to 5g; when it’s 1, it switches to 10g. This makes the size update based on user selection without any manual switching. To keep the transition smooth, a 150ms animation duration is added.
3. Visualizing 1–6 Gold Bars
To show different quantities of gold bars in the main calculator layout, we created a tiered structure using three stacked layout groups with a vertical gap -137. Each tier is offset vertically to form a simple pyramid arrangement, with everything positioned in the bottom-left corner of the screen.
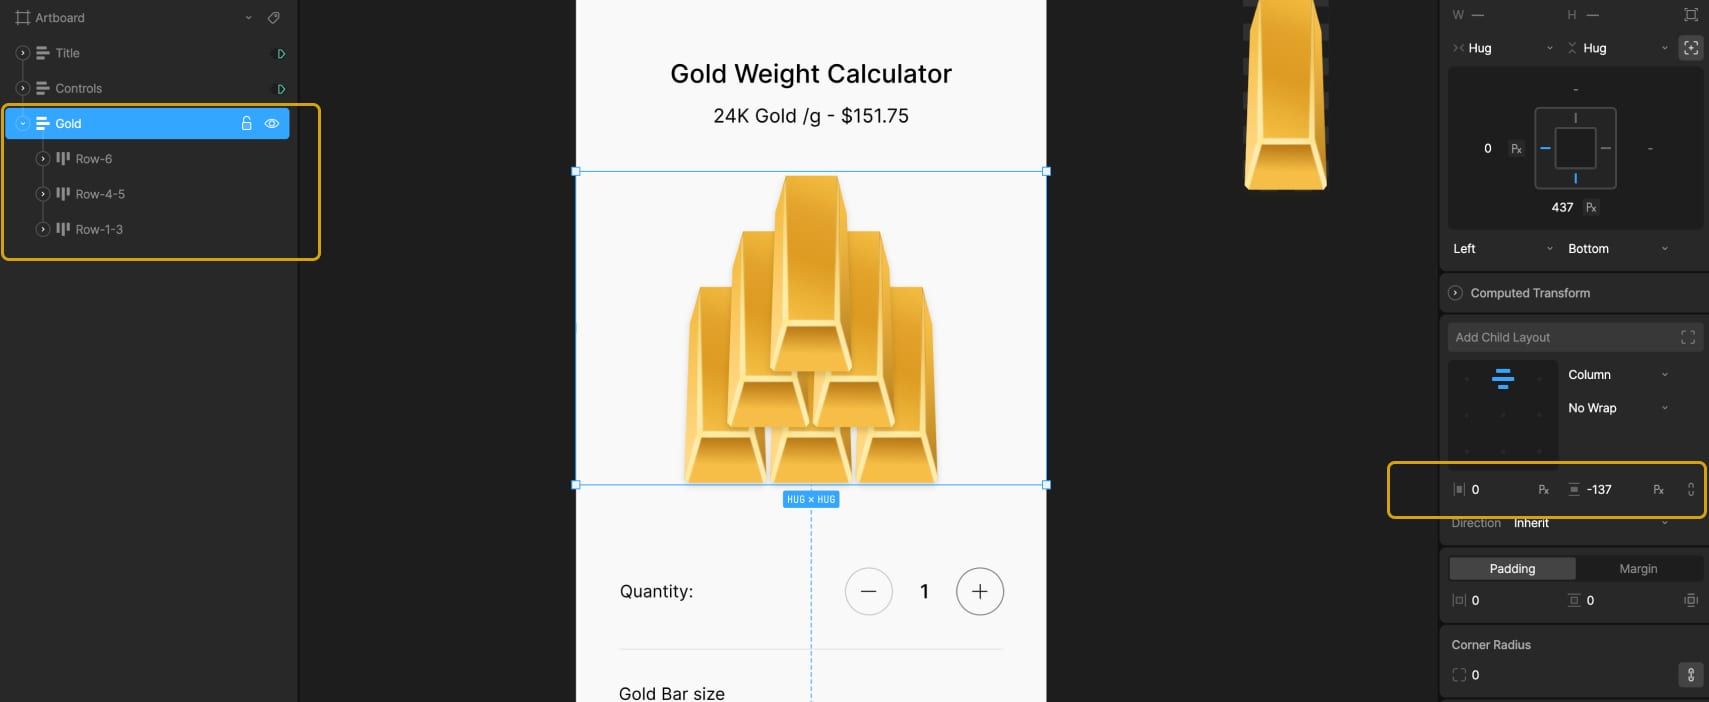
The first tier contains three duplicated nested artboards of a single gold bar. Each of these is wrapped in a Hug layout, which allows them to resize correctly based on the weight. The second tier includes two gold bars and an empty layout. This empty layout is used for spacing — it creates a visual shift when we need to display exactly four bars. The top tier has just one gold bar centered.
All three tiers are bottom-centered, which keeps the pyramid shape consistent as bars are added or removed.
To control how many bars are visible, we created 6 timelines in Animate mode — one for each quantity from 1 to 6. To hide or show each gold bar, two techniques are used: adjusting the opacity of the nested artboard (100% to show, 0% to hide) and modifying the layout that wraps it. When a bar is hidden, the layout is set to a fixed width of 0px; when visible, it uses Hug settings to restore its size automatically.
Each timeline has its own combination of these settings depending on which bars should appear. For example, in the timeline with 4 bars, we needed to prevent the fourth bar from jumping to the center of the row. To keep it properly spaced, we assigned a fixed width of 80px to the empty layout used for shifting. On the other timelines, that same layout is hidden by setting its width to 0px.
This system makes it easy to switch between quantities while preserving the visual structure.
4. State Machine and Data Binding Setup
With the visuals and layouts ready, we moved on to setting up the logic with data binding and state transitions.
4.1 External Gold Price
First, we created a number variable called Gold price gram. This value can be updated externally — for example, connected to a trading database — so the calculator always shows the current market price of gold. In our case, we used a static value of 151.75, which can also be updated manually by the user.
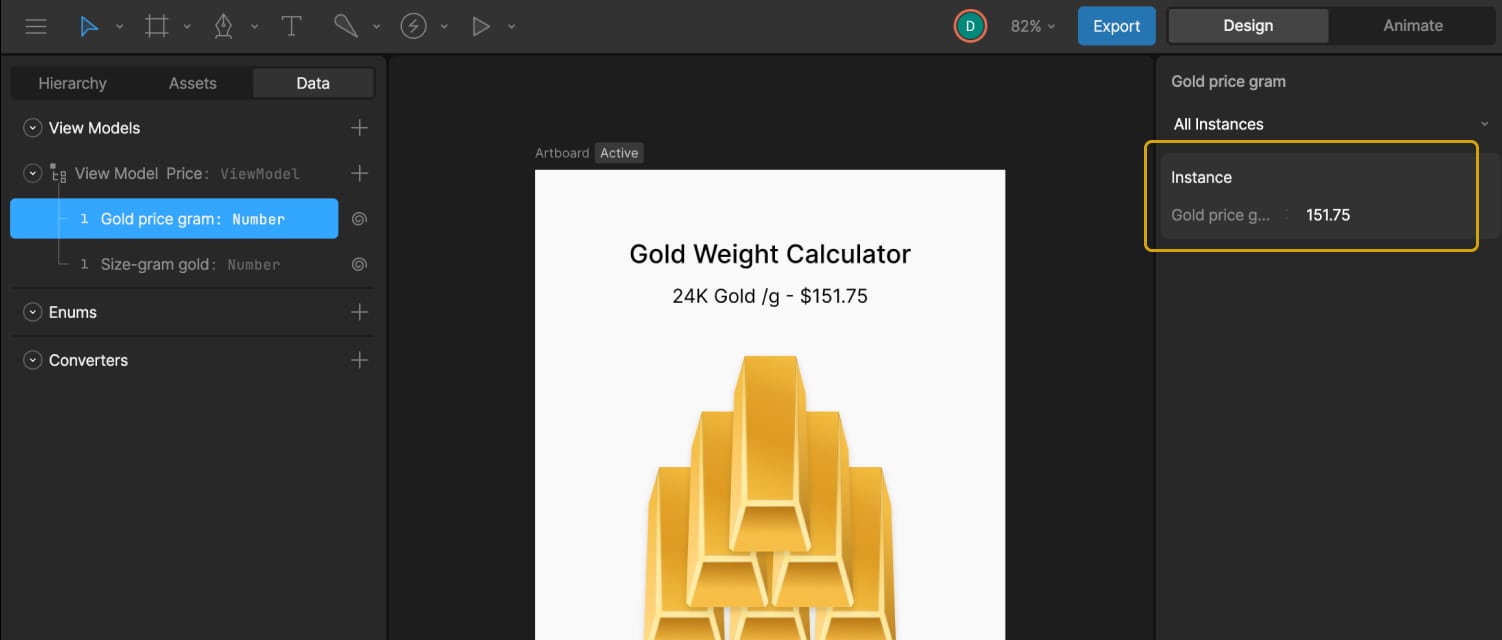
To display this in the UI, we bound Text Run 2 in the title layout to this variable. A converter in the Strings tab called “Convert to String Price” is then created and applied to that text run. This converter formats the number correctly for display and will be reused later.
4.2 Gold Bar Size Control
We already had a number variable called Size-gram gold, which controls the weight of the gold bar used in the nested artboard illustration.
In the Listeners panel, two listeners are created. The first is set to target the 5g tab, uses a Pointer Down action, and assigns Size-gram gold = 0. The second targets the 10g tab, also with a Pointer Down action, and assigns Size-gram gold = 1.
Next, two timelines (one for each tab state) are brought into the state machine. The 10g timeline is used as the default state, with transitions added: one from 10g to 5g when Size-gram gold = 0, and one back to 10g when Size-gram gold = 1. Each transition has a duration of 100ms to keep the switching smooth.
4.3 Gold Bar Quantity
Next, added another number variable, Quantity-gold, to track the number of selected bars. The default value is set to 1. In the Converters under Numeric, two “Calculate” converters are created — one that adds “+1” and one that subtracts “-1”.
In the Listeners panel, the plus button is assigned an action: Quantity-gold = Quantity-gold, using the “+1” converter. This way, clicking the plus button increases the count by 1. The same is done for the minus button, assigning Quantity-gold = Quantity-gold and attaching the “-1” converter. Clicking the minus button decreases the count by 1.
Inside the state machine, six timelines are connected to represent bar counts from 1 to 6. Each transition uses the Quantity-gold value to trigger the correct timeline.
By default, the plus button would keep increasing the value endlessly, but the goal is to limit the max to six bars. On the timeline where six gold bars are active, the plus button is disabled by setting its click area scale to 0 and lowering its opacity to create a “disabled” visual state. On all other timelines, those properties are returned to their active values.
The same logic is applied to the minus button to prevent values lower than one. On the timeline with one bar, the button is disabled, and on all others, it returns to its active state.
Almost there!
4.4 Total Price Logic
For the 5g bar price, we calculated it using this formula:
Total Price = Gold price gram + Quantity-gold * 5
In Converters → Numeric, a Formula converter was created and named Total Price 5g Formula to calculate the total price. In the example, it looked like:
{{View Model Price/Gold price gram}}*{{View Model Price/Quanity-gold}}*5.0
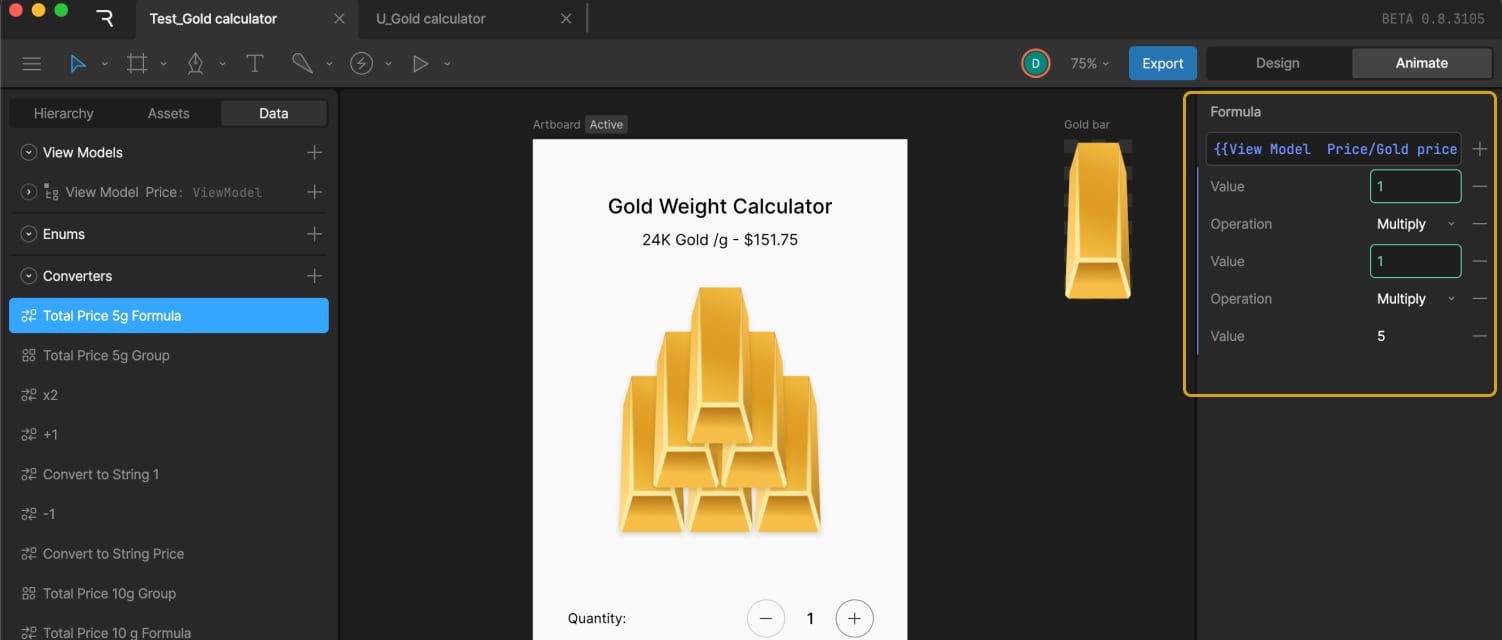
Since we needed to display this number as text, the Total Price number variable was also converted into a string. For that, we used an existing converter called “Convert to String Price.”
To use both converters together, a Group of converters was created and named Total Price 5g Group, which included the Total Price 5g Formula converter followed by the Convert to String Price converter.
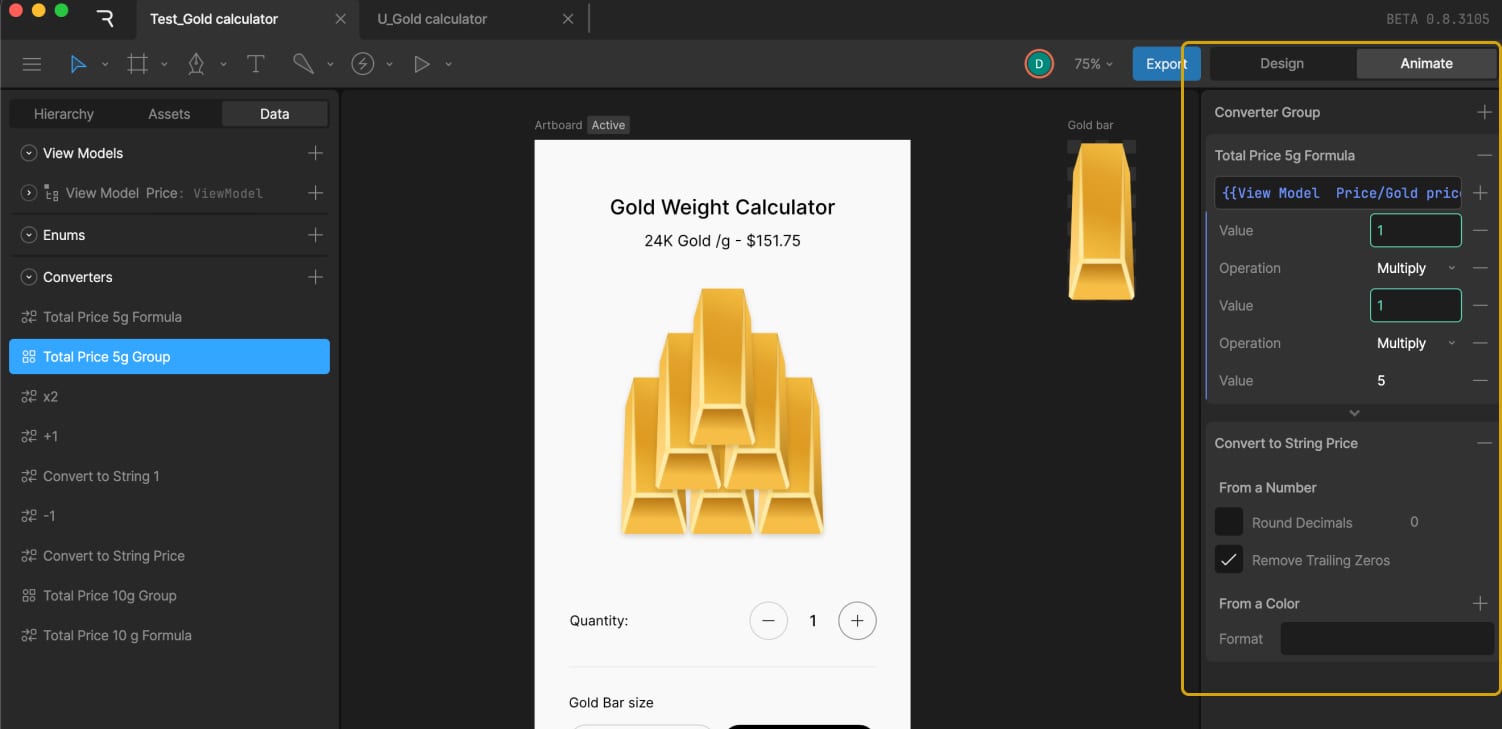
Then, the text for the price variable was data bound by adding the Total Price variable in the Property field and selecting Total Price 5g Group in the Convert field.
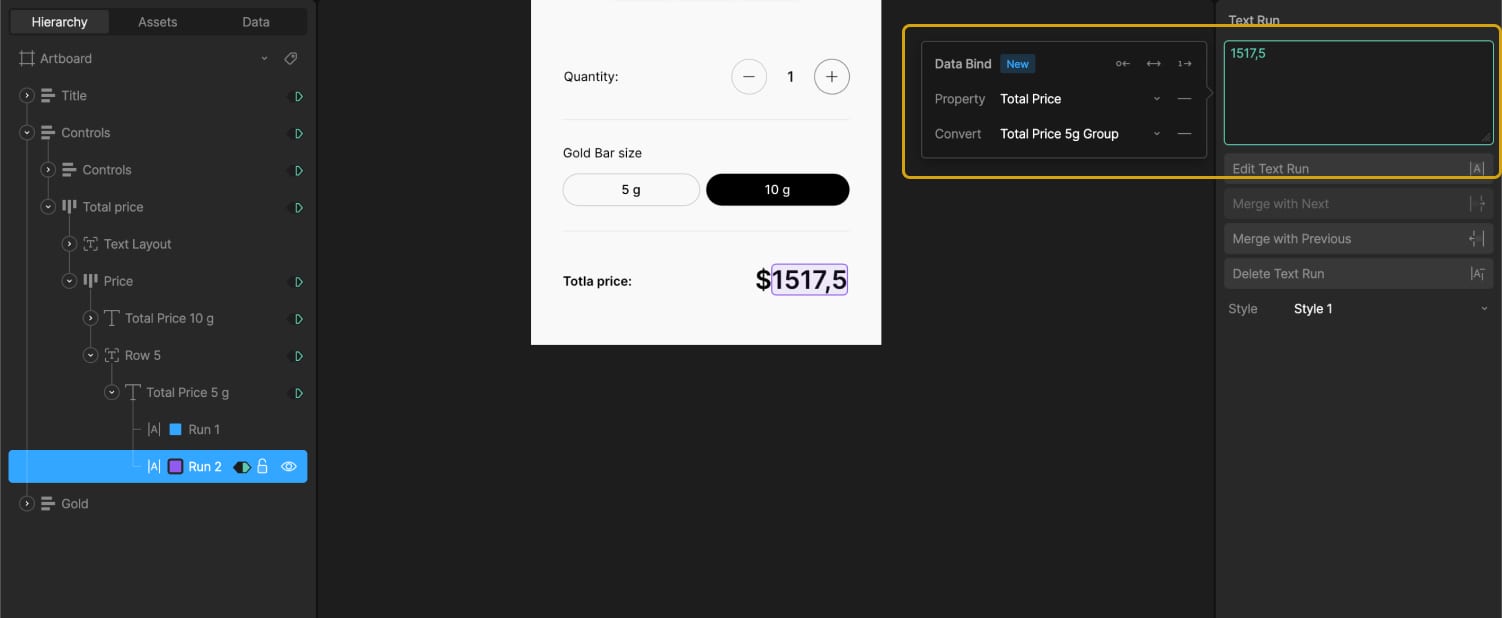
To handle the 10g case, which is double the price, two options are explored — either creating a new converter that multiplies by 10 or multiplying the existing result by 2.
Eventually, a second text element is added along with a new group of converters specifically for 10g. This includes a new formula:
Total Price = Gold price gram + Quantity-gold * 10
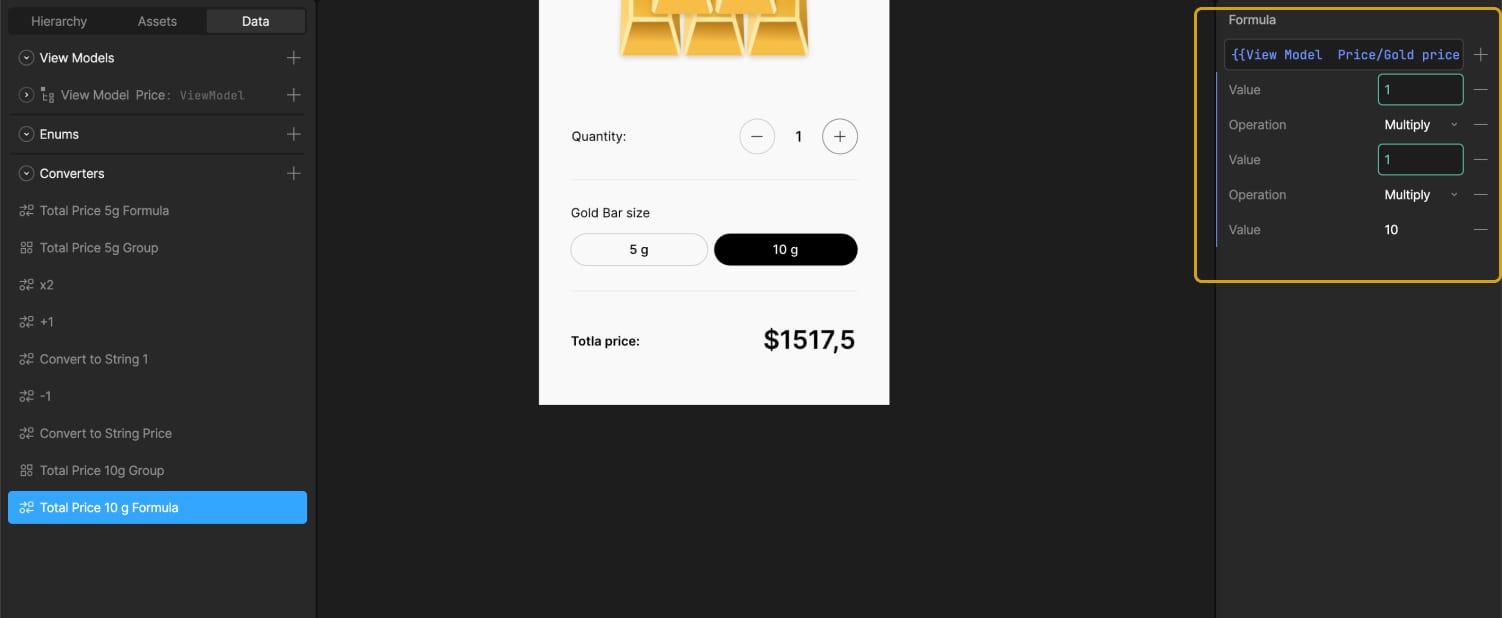
A formula converter and a group with both that formula and the string converter are created and named “Total Price 10g Group.”
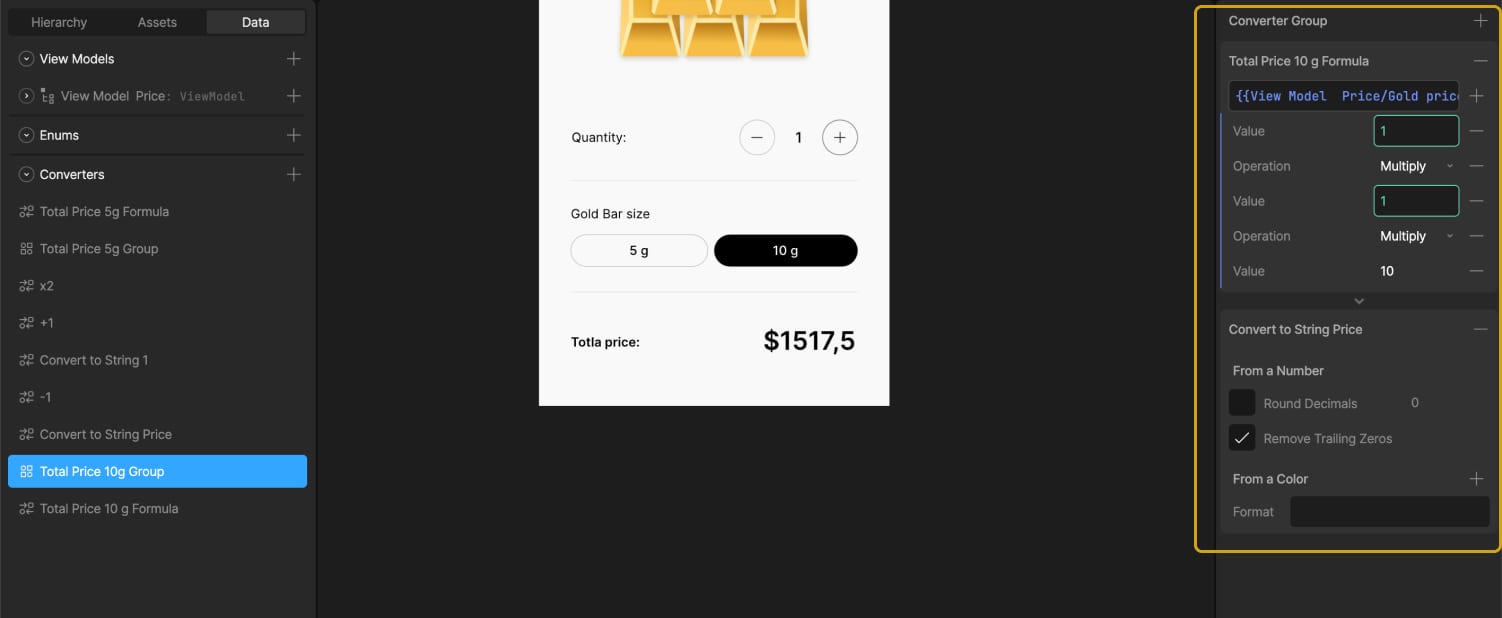
Using timelines where the 5g and 10g buttons are in their active states, we adjusted the transparency of the text elements. This way, the total price connected to the 5g converters group is visible when the 5g button is selected, and the price from the 10g converters group appears when the 10g button is selected.
It works perfectly.
After this setup, the Gold price gram variable can be connected to live external data, allowing the gold price in the calculator to reflect the current market value in real time.
Wrapping Up
This gold calculator project is a simple example, but it shows how data binding in Rive can be used to connect visual design with real-time logic — without needing to jump between separate tools or write custom code. By combining state machines, variables, and converters, you can build interfaces that are not only animated but also smart and responsive.
Whether you’re working on a product UI, a prototype, or a standalone interactive graphic, Rive gives you a way to bring together motion and behavior in a single space. If you’re already experimenting with Rive, data binding opens up a whole new layer of possibilities to explore.
