
Accurate building footprints are needed to identify the impact of conflict on affected communities. After a dedicated volunteer effort, OSM building footprints are now the leading data source in the southern Lebanon districts of Sour, Bint Jbeil, Marjayoun, and El Nabatieh.
Conflict in southern Lebanon escalated sharply from October – November 2024, following the 2023 Gaza/Israeli conflict that heightened tensions among Israel, Lebanon, and Palestine (ACLED: Lebanon ceasefire). In order to understand the impact of the conflict on communities, an accurate building footprint dataset was needed, but Microsoft and OpenStreetMap building footprints were quickly identified as incomplete, see Filling OSM Buildings Data Gaps for Recovery in Lebanon. Identifying potentially impacted buildings in a rural mountainous region proved difficult for humanitarian analysts.
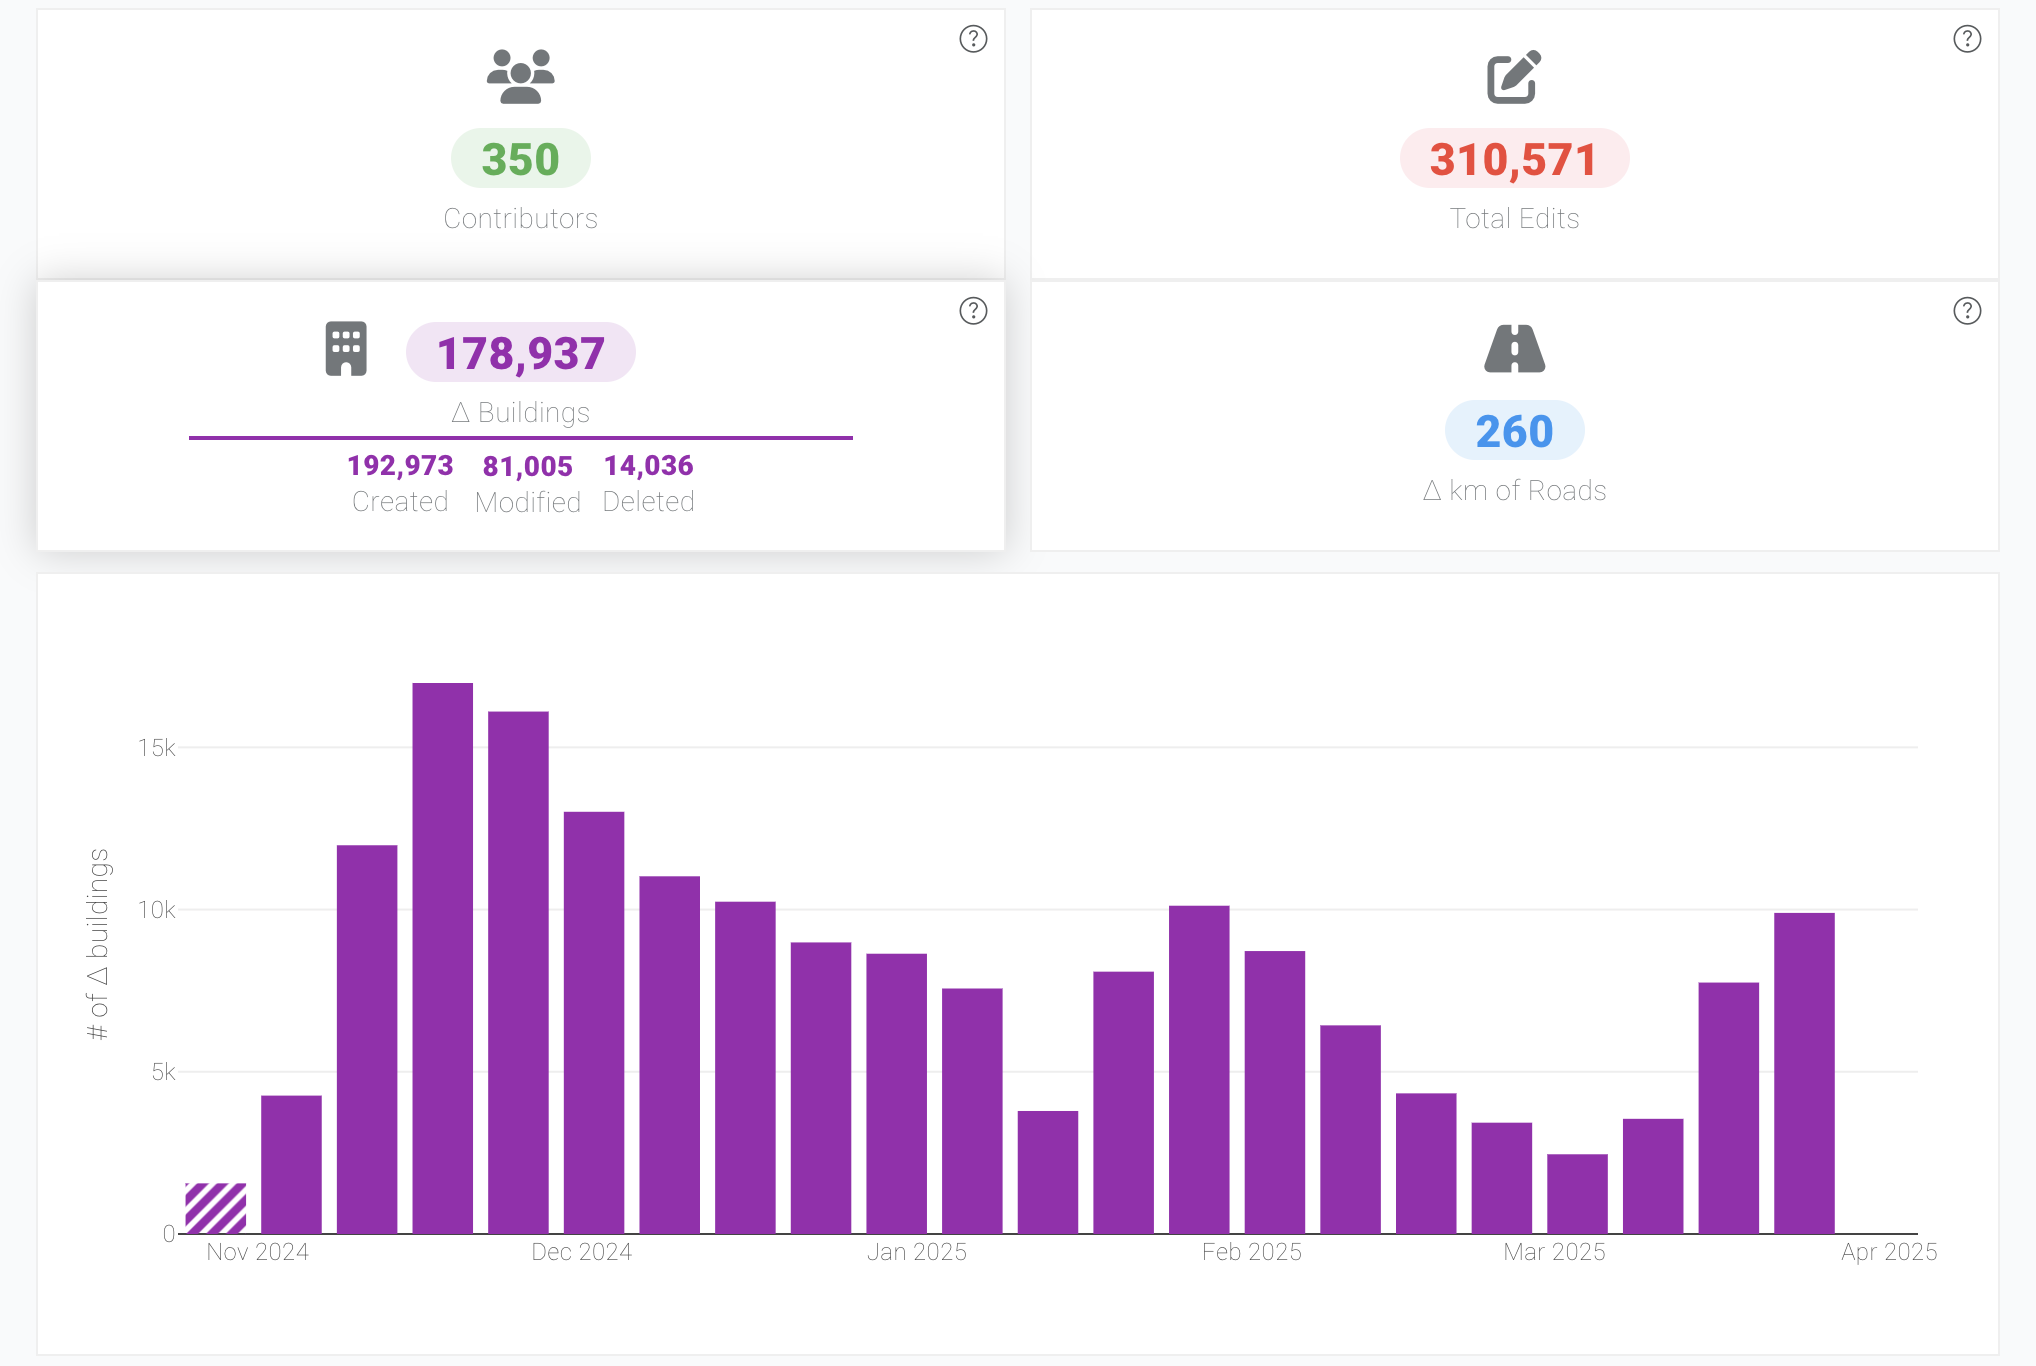
The following map shows the areas where HOTOSM mapped for the Lebanon 2024 campaign. It covered 4 districts and mapped almost 200k buildings thanks to 356 contributors.
To fill the buildings data gap in southern Lebanon, HOT coordinated 357 volunteer OSM contributors, who made over 319,00 edits to OSM from November 2024-March 2025. Some of those mappers came from a new and growing OSM community in Lebanon, see Mapping Hope: Rebuilding Lebanon After Conflict.
HOT Tasking Manager Campaign Statistics, #LebanonUpdate2024
OSM building activity below in fuchsia
Is OSM now complete in the 4 southern districts in Lebanon?
Yes. Besides the entire area being double checked by expert OSM validators (see validation example from Turkey earthquake for more on validation), AI estimates also give confidence the OSM dataset is near complete. Using AI calculations by Kontur derived from population and density, OSM coverage in the 4 districts can be considered nearly complete. See the graph below where blue are OSM counts, and yellow are AI estimated counts.
Building count comparison across the different districts where mapping took place, showing the OSM numbers almost equal to predicted total of buildings done by AI.
In areas of dedicated crowdsourced OpenStreetMap efforts, OSM has been shown to outperform automated machine learning datasets in terms of coverage and precision, such as in Gaza last year. The same holds true in Lebanon, where OSM also has 65% more buildings in the 4 districts than the other leading open buildings footprints dataset from Microsoft (165,703 vs 253,664). Overture, an emerging aggregator of open data, can lags behind OSM updates, as shown by the lower numbers of Overture than OSM as of May 2025 below.
Total Building Dataset Comparison – Southern Lebanon
| District | Overture | Microsoft Buildings | OSM Buildings | % OSM > MS |
|---|---|---|---|---|
| Bint Jbeil | 36,730 | 31,176 | 48,470 | +55.5% |
| Maarjyoun | 30,889 | 28,647 | 39,462 | +37.8% |
| Nabatiyeh | 53,739 | 45,365 | 78,388 | +72.8% |
| Sour | 70,393 | 60,515 | 87,344 | +44.3% |
Total Building Dataset Comparison, Area and Count
This chart compares the total area of buildings and the total building count from three datasets: Microsoft, OSM, and Overture.
Beyond counts, is OSM more accurate than other data sources?
Humans-in-the-loop validated OSM data also produces more precise building footprint geometries than automated methods. On visual inspection in Lebanon, OSM building geometry is more accurate when compared with Microsoft Machine Learning Buildings Footprints in Lebanon, see examples below.
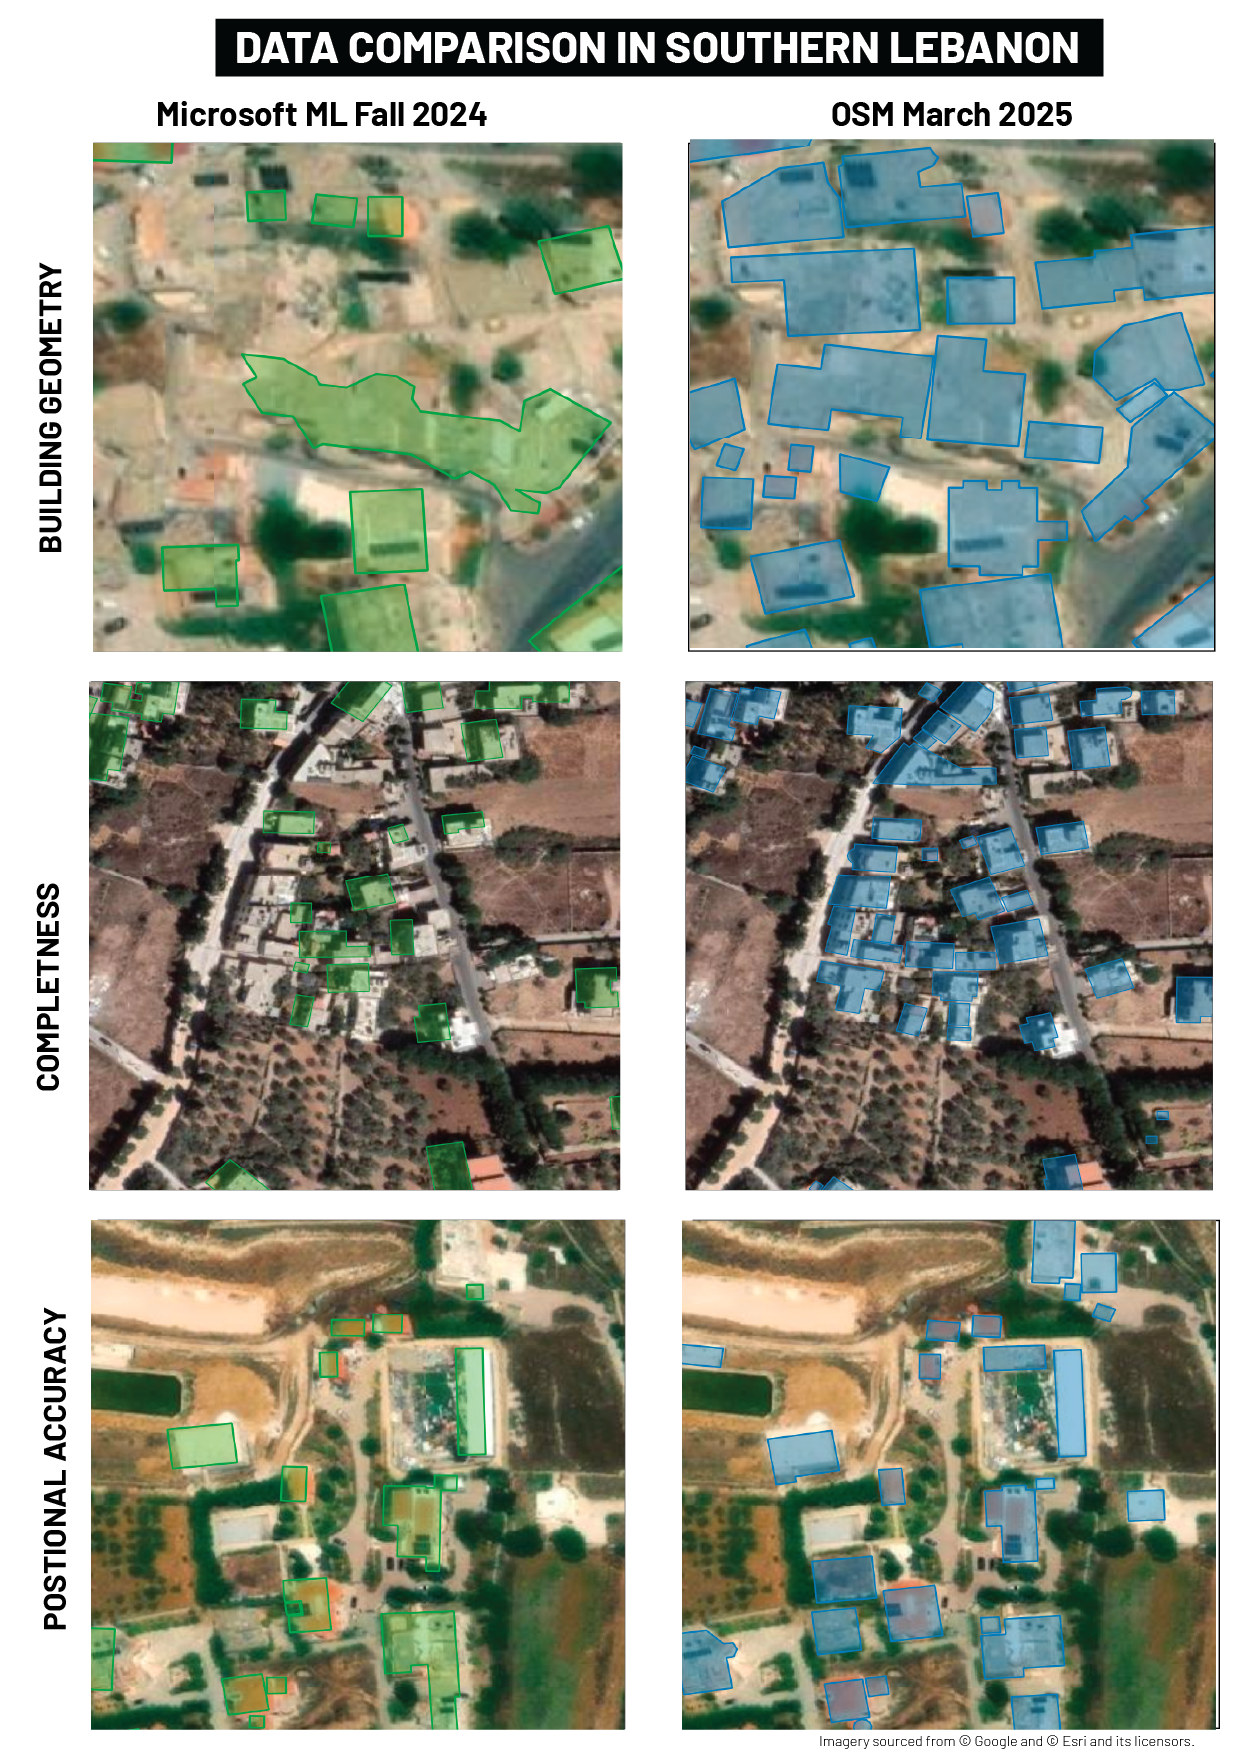
The table above shows a comparison side by side of building footprints from two sources, Microsoft and OpenStreeMap. It compares them for position, geometry and completeness
While coverage of building footprints in OSM is improving constantly, there are still gaps globally, see Analysis of OSM building data completeness using new data. When HOT launches a campaign to improve building footprints in a given area after a rapid onset crisis, it usually will not be complete enough for immediate rapid humanitarian needs. Other open automated datasets (such as from Microsoft), are used. As crowdsourced and validated OSM is shown to outperform these datasets, it is important to update any analysis in southern Lebanon that originally used Microsoft or other automated footprints.
Buildings use in damage assessments
Supported by the H2H Network, HOT has been reviewing damage assessments completed after the increase of conflict in Southern Lebanon at the end of 2024. Damage assessments use building footprints as a reference to where infrastructure is located. There were at least four remote damage assessments from different organizations that came out before January 2025 that used Microsoft Buildings. As Microsoft had 65% fewer buildings than OSM, it is possible that these early assessments were not representative estimates of damage. Watch for HOT’s publication expected this quarter of an overview on navigating the different organization’s damage assessments.
What’s next
To make OSM more useful earlier in disaster response cycles, there is promising research on integrating AI into OSM workflows, see AI-generated buildings in OpenStreetMap: frequency of use and differences from non-AI-generated buildings. HOT’s fAIR tool also can increase the rate of mapping by incorporating machine learning into OSM workflows when there is higher resolution imagery available. In the meantime, expect OSM to take time, but be more accurate.
We can also do better as an OpenStreetMap community to map buildings in anticipation of need. In conflict, that can mean proactively mapping before detailed remote sensing analysis is conducted or in partnership with conflict analysts. In Khartoum, Sudan, we are doing just that: OpenStreetMap Contributors Needed to Map Khartoum Ahead of New Radar Satellite Imagery.
Partner with us!
Resources are needed to engage more OSM communities and students to complete OSM buildings in conflicted affected areas. Please reach out to data@hotosm.org to donate or work with us on data priorities and collection.
Read more about HOT’s Conflict and Displacement Program.
Cover Photo: Imagery provided by Bing. For more information, visit Bing Maps.