
Idaho might seem like a hidden gem, but its real estate prices tell a different story. According to the Zillow Home Value Index, house prices across many of Idaho’s mountain and resort towns have climbed sharply in recent years. From lakeside escapes near Coeur d’Alene to ski towns tucked in the central peaks, these are places where buyers are paying top dollar for a slice of the good life. For some towns, the surge started during the remote work boom—but even now, demand hasn’t cooled much. Whether it’s outdoor adventure, scenic views, or luxury development pulling buyers in, property in these 17 Idaho towns definitely doesn’t come cheap.
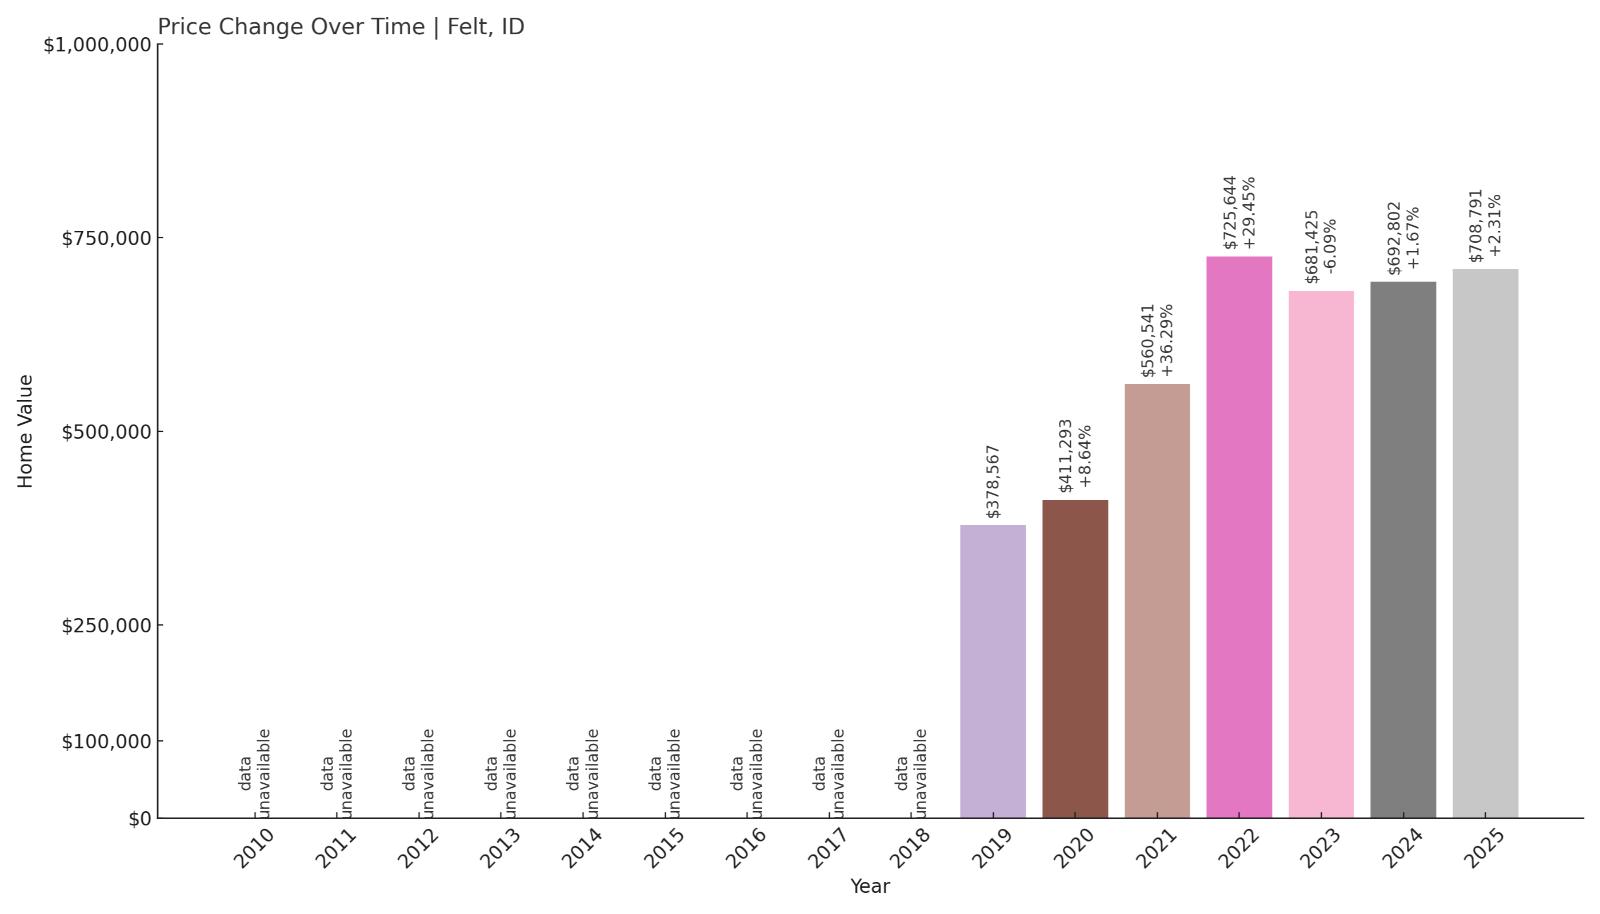
17. Felt – 87% Home Price Increase Since June 2019
- 2010: N/A
- 2011: N/A
- 2012: N/A
- 2013: N/A
- 2014: N/A
- 2015: N/A
- 2016: N/A
- 2017: N/A
- 2018: N/A
- 2019: $378,567
- 2020: $411,293 (+$32,726, +8.64% from previous year)
- 2021: $560,541 (+$149,248, +36.29% from previous year)
- 2022: $725,644 (+$165,103, +29.45% from previous year)
- 2023: $681,425 (-$44,220, -6.09% from previous year)
- 2024: $692,802 (+$11,377, +1.67% from previous year)
- 2025: $708,791 (+$15,989, +2.31% from previous year)
Home values in Felt jumped 87% between 2019 and June 2025, growing from just under $380,000 to over $708,000. The steepest increases came in 2021 and 2022, with gains of over 36% and 29%, respectively. Although prices dipped in 2023, they have since rebounded modestly.
Felt – Limited Inventory in a Scenic Pocket
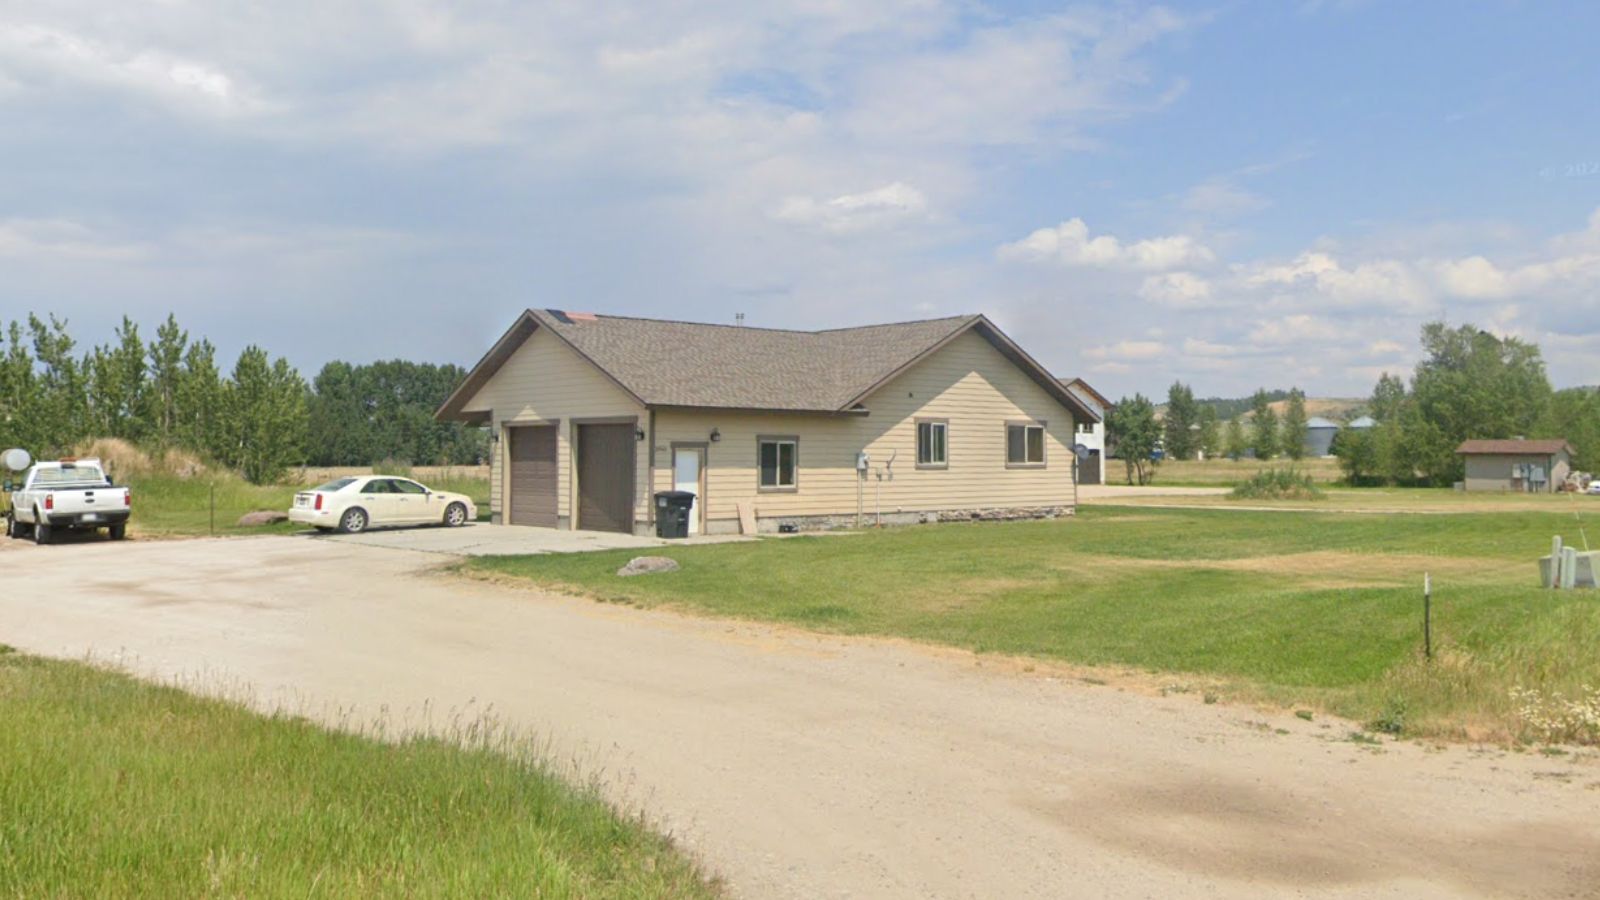
Felt is a tiny rural community in Teton County, tucked along the western edge of Idaho near the Wyoming border. It’s just north of the more widely known Tetonia and sits amid the Tetons’ striking scenery. While population data is sparse, Felt’s home market is defined by extremely limited inventory and strong appeal to those looking for space and views.
Most of the homes here are spread across large lots or agricultural parcels, which helps drive up values despite the town’s remote feel. Demand in nearby Driggs and Victor likely spilled over into Felt during the pandemic-era housing surge, boosting prices. Since then, values have stabilized somewhat, but the area remains among Idaho’s most expensive places to buy.
16. Hope – 149% Home Price Increase Since June 2010
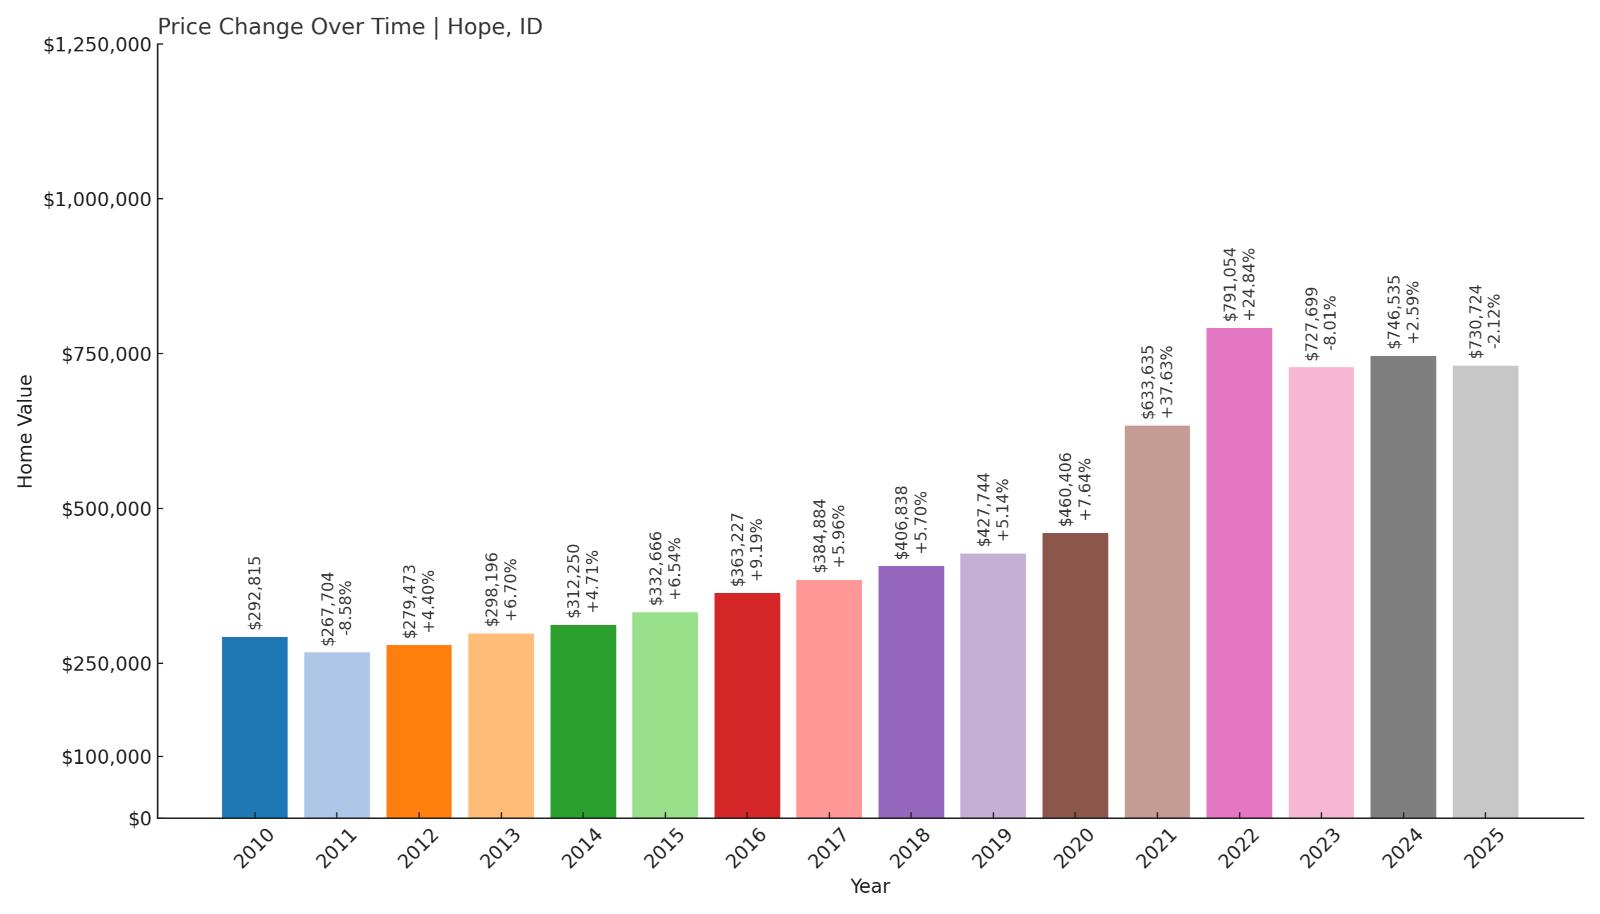
- 2010: $292,815
- 2011: $267,704 (-$25,111, -8.58% from previous year)
- 2012: $279,473 (+$11,770, +4.40% from previous year)
- 2013: $298,196 (+$18,723, +6.70% from previous year)
- 2014: $312,250 (+$14,055, +4.71% from previous year)
- 2015: $332,666 (+$20,416, +6.54% from previous year)
- 2016: $363,227 (+$30,561, +9.19% from previous year)
- 2017: $384,884 (+$21,657, +5.96% from previous year)
- 2018: $406,838 (+$21,953, +5.70% from previous year)
- 2019: $427,744 (+$20,906, +5.14% from previous year)
- 2020: $460,406 (+$32,662, +7.64% from previous year)
- 2021: $633,635 (+$173,229, +37.63% from previous year)
- 2022: $791,054 (+$157,419, +24.84% from previous year)
- 2023: $727,699 (-$63,354, -8.01% from previous year)
- 2024: $746,535 (+$18,836, +2.59% from previous year)
- 2025: $730,724 (-$15,811, -2.12% from previous year)
Home values in Hope have climbed from $292,815 in 2010 to $730,724 by mid-2025—a 149% gain over 15 years. The most rapid acceleration occurred between 2020 and 2022. Prices have dipped slightly since then, but remain far above pre-pandemic levels.
Hope – Waterfront Appeal Along Lake Pend Oreille
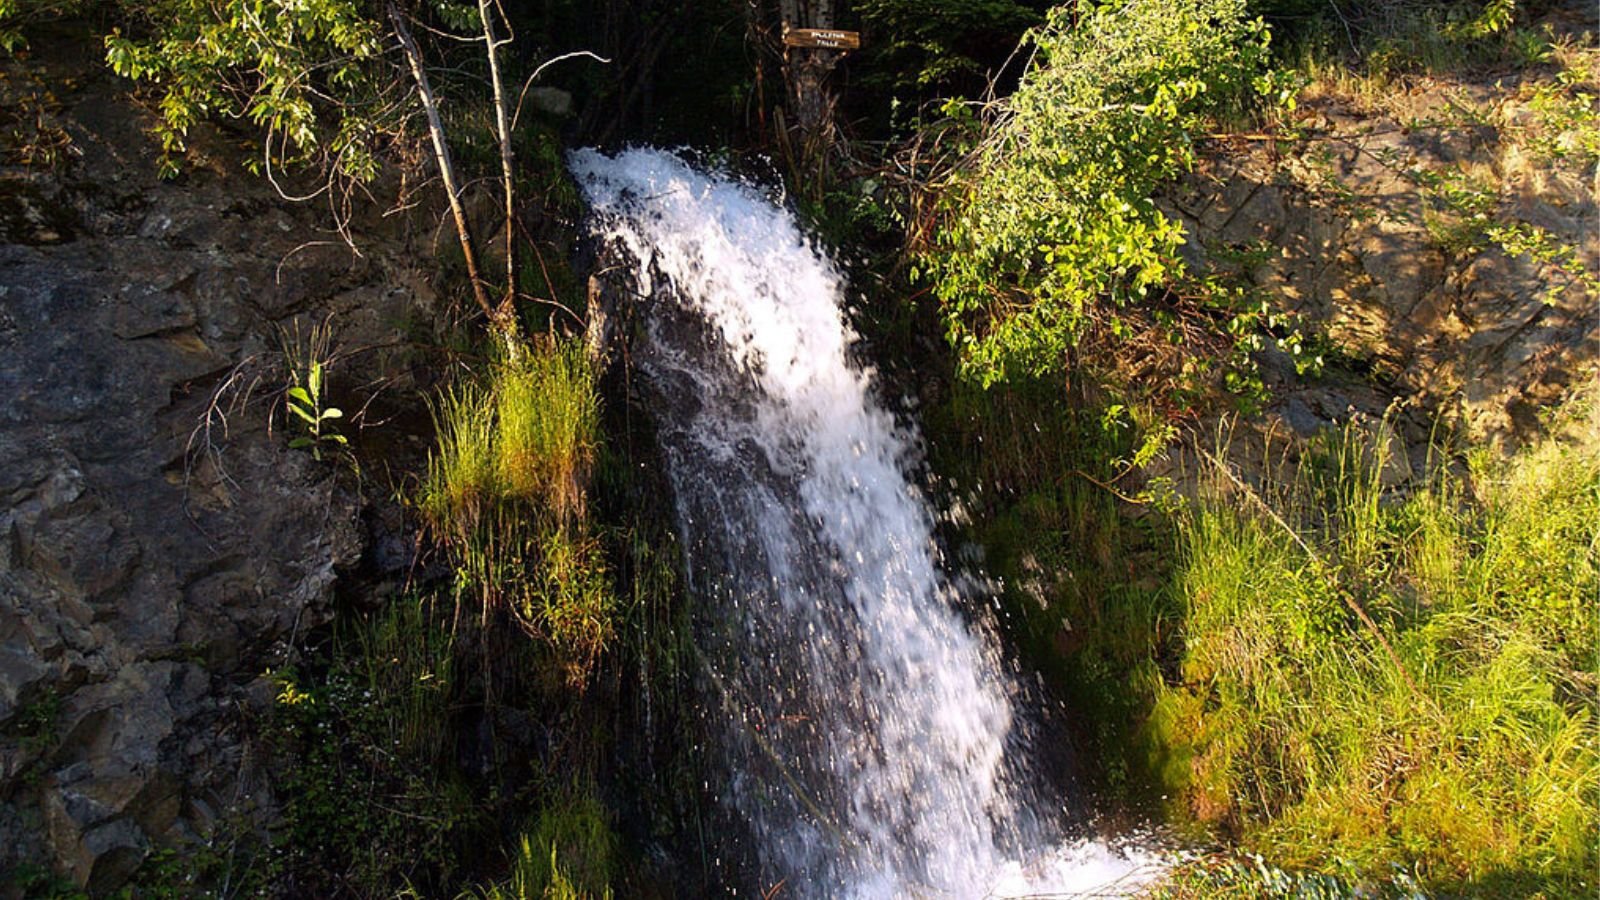
Hope is perched along the northern edge of Lake Pend Oreille, offering dramatic views and quick access to one of Idaho’s most beautiful waterways. Its secluded nature and limited housing stock have kept it high on the list for buyers seeking lakefront property. Most homes here are custom-built or historic, which further drives up values.
With nearby Sandpoint growing in popularity, Hope benefits from its proximity while maintaining a quiet, small-town identity. The steep jump in values during 2021–2022 likely reflects increased demand for remote, high-amenity towns during the pandemic. Even as prices soften, Hope remains among the top-tier markets in North Idaho.
15. Sagle – 191% Home Price Increase Since June 2010
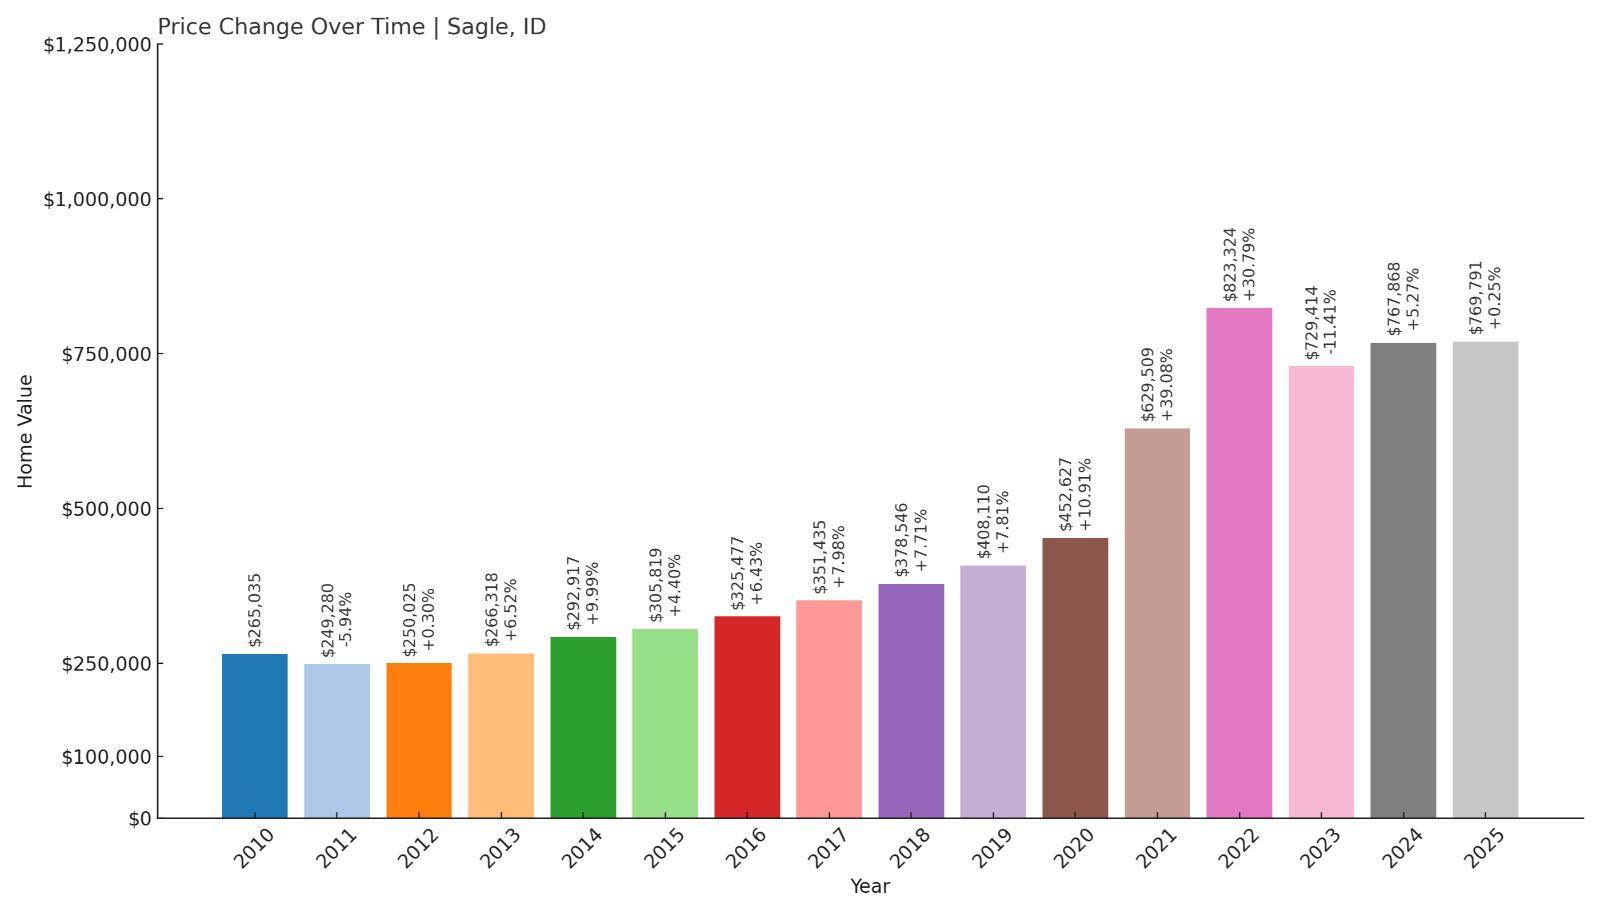
- 2010: $265,035
- 2011: $249,280 (-$15,755, -5.94% from previous year)
- 2012: $250,025 (+$745, +0.30% from previous year)
- 2013: $266,318 (+$16,294, +6.52% from previous year)
- 2014: $292,917 (+$26,598, +9.99% from previous year)
- 2015: $305,819 (+$12,902, +4.40% from previous year)
- 2016: $325,477 (+$19,658, +6.43% from previous year)
- 2017: $351,435 (+$25,958, +7.98% from previous year)
- 2018: $378,546 (+$27,111, +7.71% from previous year)
- 2019: $408,110 (+$29,564, +7.81% from previous year)
- 2020: $452,627 (+$44,516, +10.91% from previous year)
- 2021: $629,509 (+$176,882, +39.08% from previous year)
- 2022: $823,324 (+$193,815, +30.79% from previous year)
- 2023: $729,414 (-$93,910, -11.41% from previous year)
- 2024: $767,868 (+$38,455, +5.27% from previous year)
- 2025: $769,791 (+$1,923, +0.25% from previous year)
Sagle’s median home price has risen from $265,035 in 2010 to $769,791 in 2025, an increase of 191%. While values have dipped slightly since their peak in 2022, the area remains one of Idaho’s priciest markets, especially for lake-access properties.
Sagle – Popularity Surging Near Sandpoint
Sagle is a fast-growing unincorporated area just south of Sandpoint. While it lacks an official town center, Sagle covers a wide swath of waterfront, forested hills, and quiet neighborhoods on the western shore of Lake Pend Oreille. Its appeal lies in a balance of access to Sandpoint’s amenities and a quieter, more rural lifestyle.
The massive price increases between 2020 and 2022 align with Sandpoint’s growing national attention, especially among second-home buyers. As of 2025, growth has slowed but demand remains strong for scenic homesites and large parcels. Prices here reflect high demand for North Idaho’s lake communities.
14. Athol – 293% Home Price Increase Since June 2010
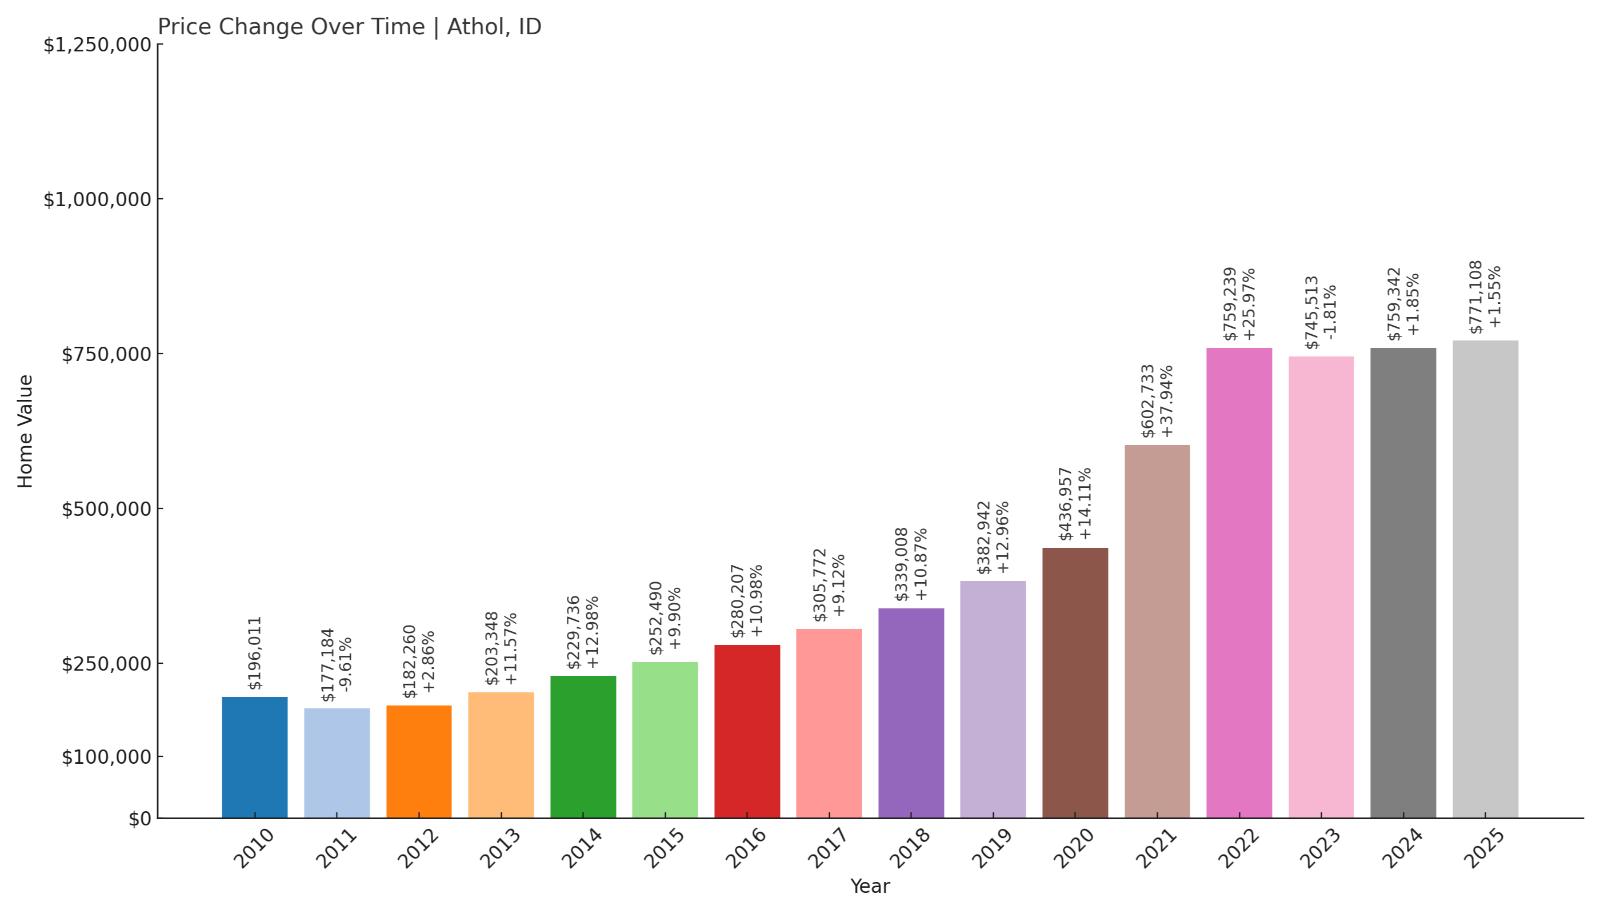
- 2010: $196,011
- 2011: $177,184 (-$18,827, -9.61% from previous year)
- 2012: $182,260 (+$5,076, +2.86% from previous year)
- 2013: $203,348 (+$21,088, +11.57% from previous year)
- 2014: $229,736 (+$26,388, +12.98% from previous year)
- 2015: $252,490 (+$22,754, +9.90% from previous year)
- 2016: $280,207 (+$27,717, +10.98% from previous year)
- 2017: $305,772 (+$25,565, +9.12% from previous year)
- 2018: $339,008 (+$33,236, +10.87% from previous year)
- 2019: $382,942 (+$43,934, +12.96% from previous year)
- 2020: $436,957 (+$54,014, +14.11% from previous year)
- 2021: $602,733 (+$165,776, +37.94% from previous year)
- 2022: $759,239 (+$156,506, +25.97% from previous year)
- 2023: $745,513 (-$13,726, -1.81% from previous year)
- 2024: $759,342 (+$13,829, +1.85% from previous year)
- 2025: $771,108 (+$11,766, +1.55% from previous year)
Athol has seen a staggering 293% increase in home values since 2010. Prices surged most between 2020 and 2022, echoing a pattern seen across Idaho. Despite a slight correction in 2023, values have remained relatively steady since.
Athol – Quiet Acreage, Growing Interest
Located just northwest of Coeur d’Alene, Athol has long been a place for buyers seeking acreage and elbow room. The town is near Farragut State Park and is within commuting distance to both Sandpoint and the greater Spokane area, making it increasingly attractive to buyers priced out of urban centers.
Recent development has brought new retail and residential communities, contributing to rising demand. With homes typically sitting on larger parcels and the area’s outdoor recreation opportunities, Athol’s growth looks poised to continue even amid a cooling market.
13. McCall – 205% Home Price Increase Since June 2010
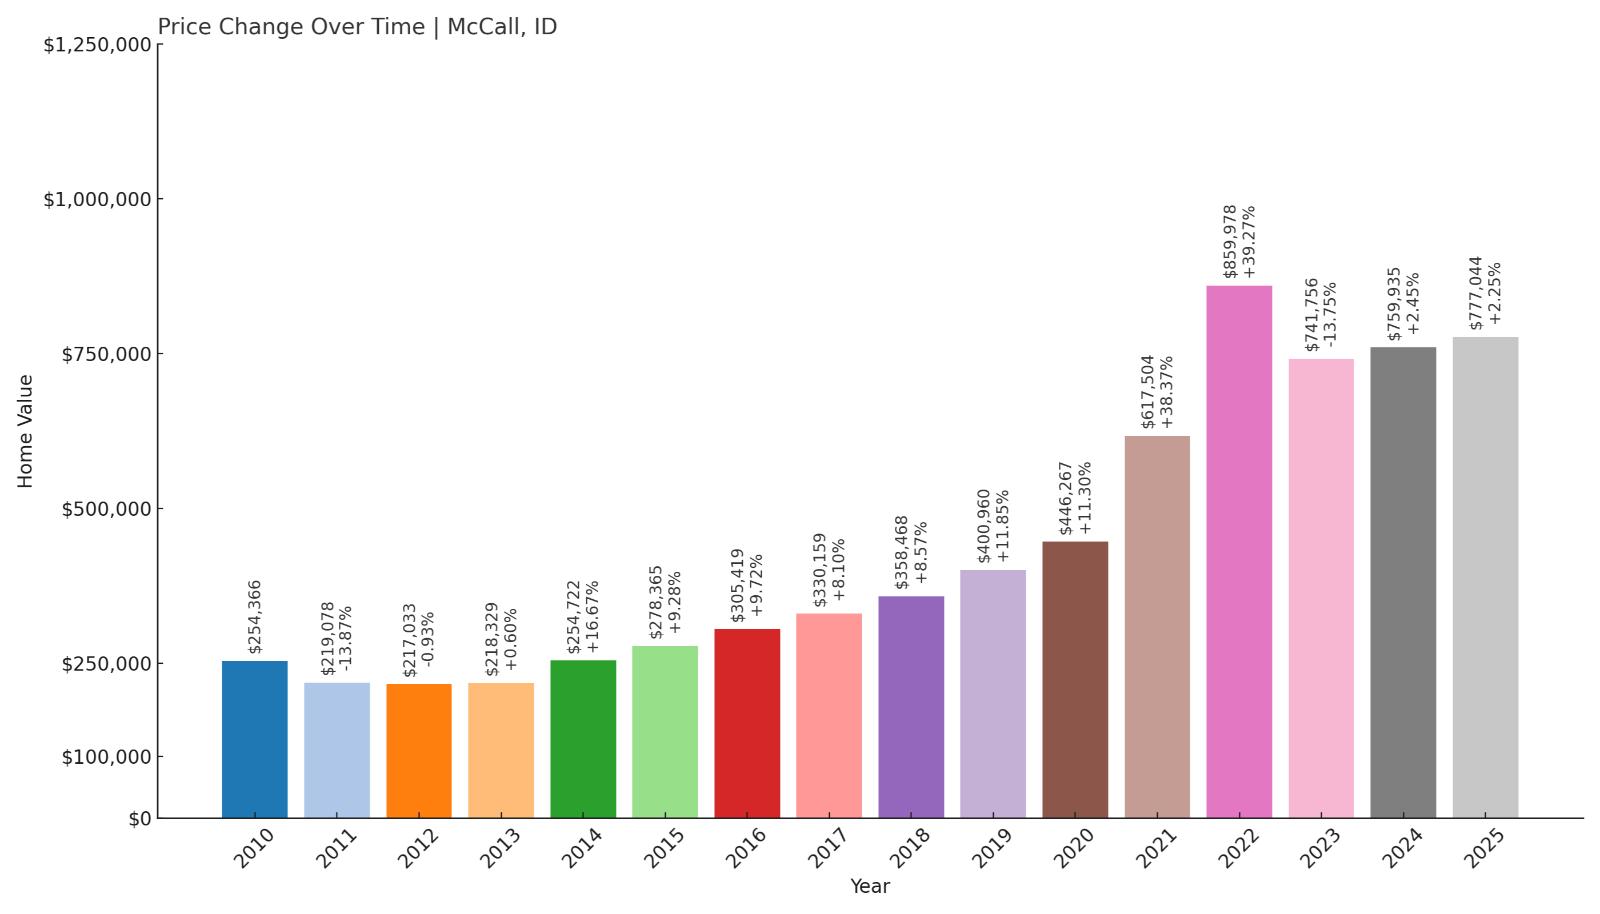
- 2010: $254,366
- 2011: $219,078 (-$35,288, -13.87% from previous year)
- 2012: $217,033 (-$2,045, -0.93% from previous year)
- 2013: $218,329 (+$1,296, +0.60% from previous year)
- 2014: $254,722 (+$36,393, +16.67% from previous year)
- 2015: $278,365 (+$23,643, +9.28% from previous year)
- 2016: $305,419 (+$27,054, +9.72% from previous year)
- 2017: $330,159 (+$24,740, +8.10% from previous year)
- 2018: $358,468 (+$28,310, +8.57% from previous year)
- 2019: $400,960 (+$42,492, +11.85% from previous year)
- 2020: $446,267 (+$45,307, +11.30% from previous year)
- 2021: $617,504 (+$171,236, +38.37% from previous year)
- 2022: $859,978 (+$242,474, +39.27% from previous year)
- 2023: $741,756 (-$118,222, -13.75% from previous year)
- 2024: $759,935 (+$18,179, +2.45% from previous year)
- 2025: $777,044 (+$17,109, +2.25% from previous year)
McCall’s home values have grown 205% since 2010, reaching over $777,000 in mid-2025. After peaking in 2022, prices dipped but have since shown signs of recovery.
McCall – Resort Town Pricing Without Slowing

McCall is a premier destination in Central Idaho, known for its ski slopes, lakefront charm, and vibrant tourism economy. Located on the edge of Payette Lake, it’s long been a hotspot for second homes and vacation rentals. With limited buildable land, the supply side remains tight even as demand holds steady.
Prices soared in 2021 and 2022 as out-of-state buyers entered the market, pushing McCall into the top tier of Idaho’s most expensive towns. Though values cooled in 2023, they have ticked back up in recent months. It remains one of the most desirable—and expensive—places to live or own a vacation home in the state.
12. Dover – 140% Home Price Increase Since June 2010
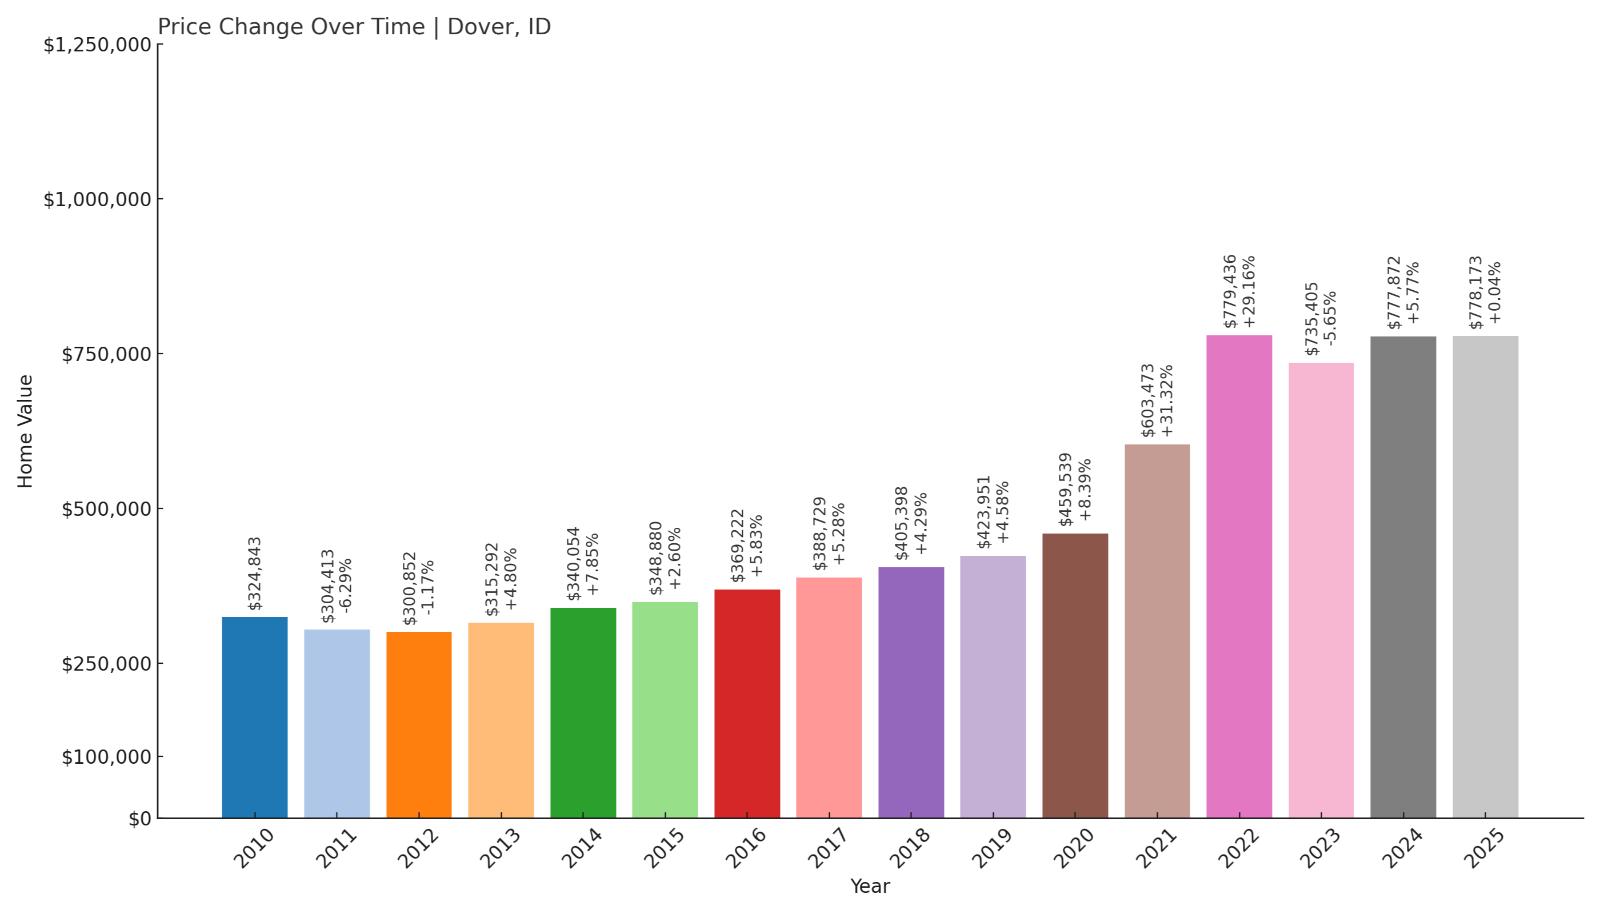
- 2010: $324,843
- 2011: $304,413 (-$20,430, -6.29% from previous year)
- 2012: $300,852 (-$3,561, -1.17% from previous year)
- 2013: $315,292 (+$14,440, +4.80% from previous year)
- 2014: $340,054 (+$24,762, +7.85% from previous year)
- 2015: $348,880 (+$8,826, +2.60% from previous year)
- 2016: $369,222 (+$20,341, +5.83% from previous year)
- 2017: $388,729 (+$19,507, +5.28% from previous year)
- 2018: $405,398 (+$16,669, +4.29% from previous year)
- 2019: $423,951 (+$18,553, +4.58% from previous year)
- 2020: $459,539 (+$35,588, +8.39% from previous year)
- 2021: $603,473 (+$143,934, +31.32% from previous year)
- 2022: $779,436 (+$175,963, +29.16% from previous year)
- 2023: $735,405 (-$44,032, -5.65% from previous year)
- 2024: $777,872 (+$42,468, +5.77% from previous year)
- 2025: $778,173 (+$301, +0.04% from previous year)
Home values in Dover have more than doubled since 2010, rising from just under $325,000 to nearly $780,000 as of June 2025. While price growth slowed after 2022, the market has stabilized at high levels, with small gains in the past two years.
Dover – Small Town, High-End Waterfront

Dover sits right on the edge of Lake Pend Oreille, just a few miles west of Sandpoint. Despite its modest size, Dover has become one of the state’s most exclusive lakefront enclaves, thanks in part to high-end planned communities like Dover Bay. These newer developments offer luxury homes, marinas, and direct access to the lake and trails.
The town’s location—close to ski slopes, lake activities, and Sandpoint’s amenities—helps justify its steep price tag. Much of the explosive growth in 2021 and 2022 was driven by buyers seeking a blend of natural beauty and resort-like living. Dover’s small size and premium inventory keep competition fierce and prices high.
11. Driggs – 295% Home Price Increase Since June 2011
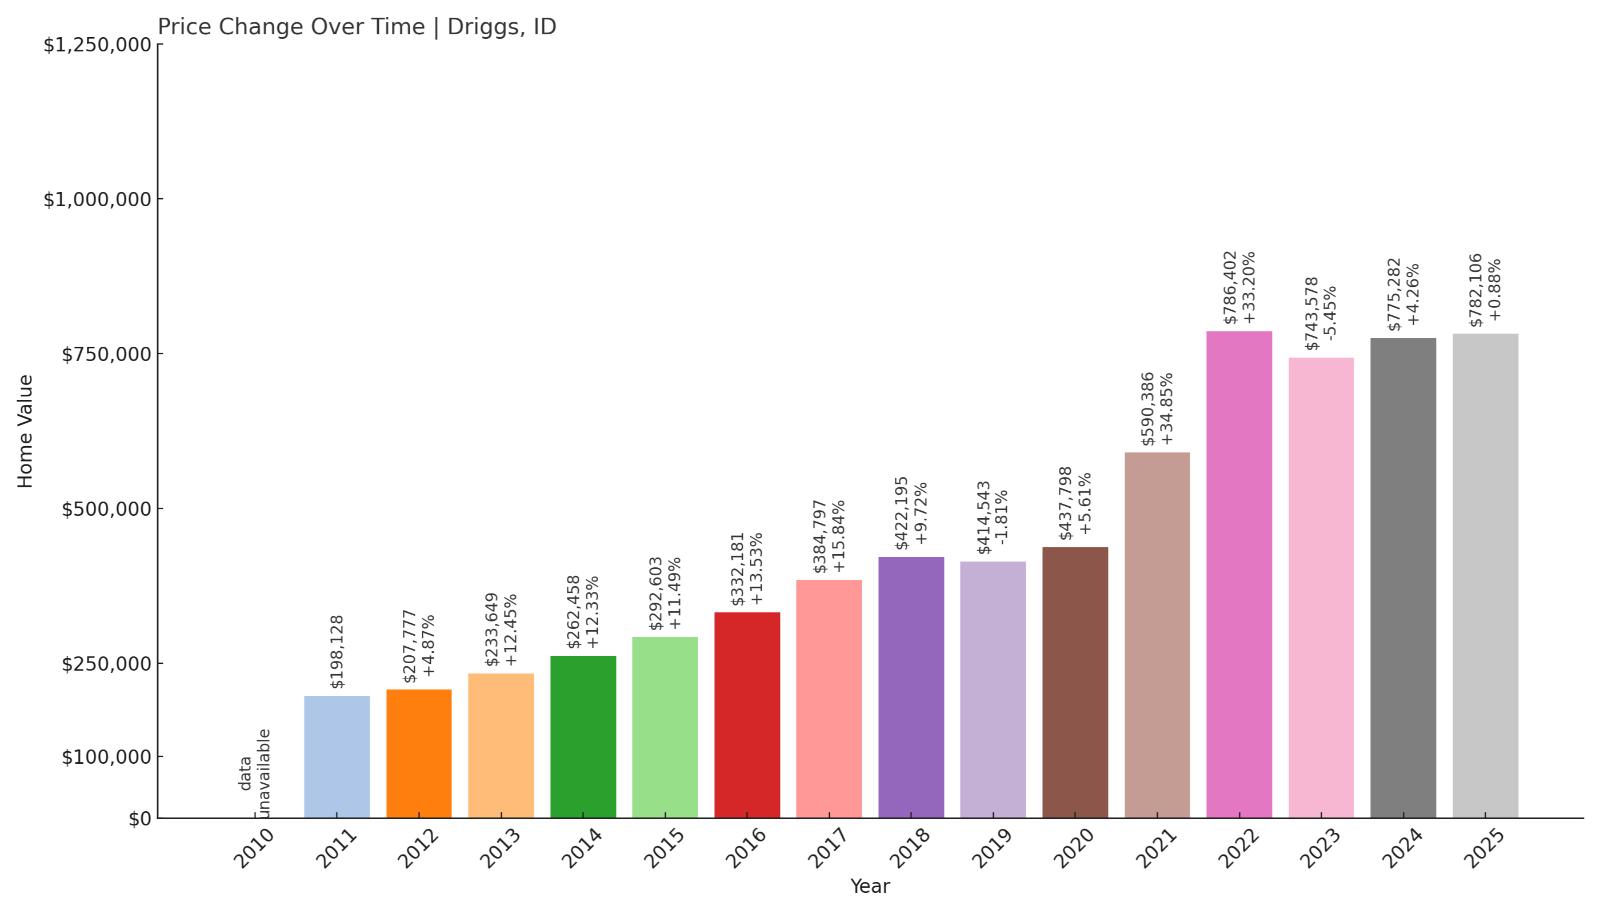
- 2010: N/A
- 2011: $198,128
- 2012: $207,777 (+$9,650, +4.87% from previous year)
- 2013: $233,649 (+$25,872, +12.45% from previous year)
- 2014: $262,458 (+$28,809, +12.33% from previous year)
- 2015: $292,603 (+$30,145, +11.49% from previous year)
- 2016: $332,181 (+$39,578, +13.53% from previous year)
- 2017: $384,797 (+$52,616, +15.84% from previous year)
- 2018: $422,195 (+$37,398, +9.72% from previous year)
- 2019: $414,543 (-$7,652, -1.81% from previous year)
- 2020: $437,798 (+$23,255, +5.61% from previous year)
- 2021: $590,386 (+$152,588, +34.85% from previous year)
- 2022: $786,402 (+$196,016, +33.20% from previous year)
- 2023: $743,578 (-$42,825, -5.45% from previous year)
- 2024: $775,282 (+$31,705, +4.26% from previous year)
- 2025: $782,106 (+$6,823, +0.88% from previous year)
Driggs has seen home prices skyrocket 295% since 2011, driven by growing interest in Idaho’s Teton Valley region. While prices cooled slightly after 2022, they remain near record highs, holding steady at over $780,000.
Driggs – Gateway to the Tetons

Driggs is nestled in the shadow of the Teton Mountains, just a few miles from the Wyoming border. Once a quiet agricultural town, it’s become a hub for outdoor recreation and a favorite alternative to pricier Jackson, Wyoming. The town offers skiing at Grand Targhee, access to national forest trails, and a lively arts scene.
Buyers are drawn to Driggs for its combination of natural beauty, amenities, and (relatively) lower costs compared to Jackson. The surge in remote work and second-home purchases between 2020 and 2022 pushed values sharply upward. Although prices dipped in 2023, they’ve since rebounded and remain high.
10. Eagle – 183% Home Price Increase Since June 2010

- 2010: $284,129
- 2011: $256,150 (-$27,979, -9.85% from previous year)
- 2012: $265,513 (+$9,362, +3.66% from previous year)
- 2013: $300,690 (+$35,177, +13.25% from previous year)
- 2014: $327,025 (+$26,336, +8.76% from previous year)
- 2015: $334,646 (+$7,621, +2.33% from previous year)
- 2016: $355,448 (+$20,802, +6.22% from previous year)
- 2017: $382,578 (+$27,130, +7.63% from previous year)
- 2018: $417,368 (+$34,790, +9.09% from previous year)
- 2019: $463,578 (+$46,210, +11.07% from previous year)
- 2020: $514,364 (+$50,786, +10.96% from previous year)
- 2021: $736,990 (+$222,626, +43.28% from previous year)
- 2022: $880,577 (+$143,587, +19.48% from previous year)
- 2023: $758,905 (-$121,672, -13.82% from previous year)
- 2024: $791,787 (+$32,881, +4.33% from previous year)
- 2025: $805,525 (+$13,739, +1.74% from previous year)
Home prices in Eagle have risen from $284,129 in 2010 to $805,525 in 2025—an increase of 183%. Values soared during the pandemic but dipped in 2023 before beginning to recover.
Eagle – Upscale Suburb of Boise

Eagle is one of the most desirable communities in the Boise metro area, known for its luxury homes, golf courses, and family-friendly neighborhoods. Located northwest of downtown Boise, it offers a blend of upscale living and suburban convenience with access to the foothills and river trails.
Between 2020 and 2022, Eagle saw explosive price growth driven by demand for new construction and low inventory. While home values dropped in 2023 amid broader market cooling, they’ve started inching back up. With top-rated schools and scenic surroundings, Eagle continues to attract buyers even at higher price points.
9. Worley – 197% Home Price Increase Since June 2010
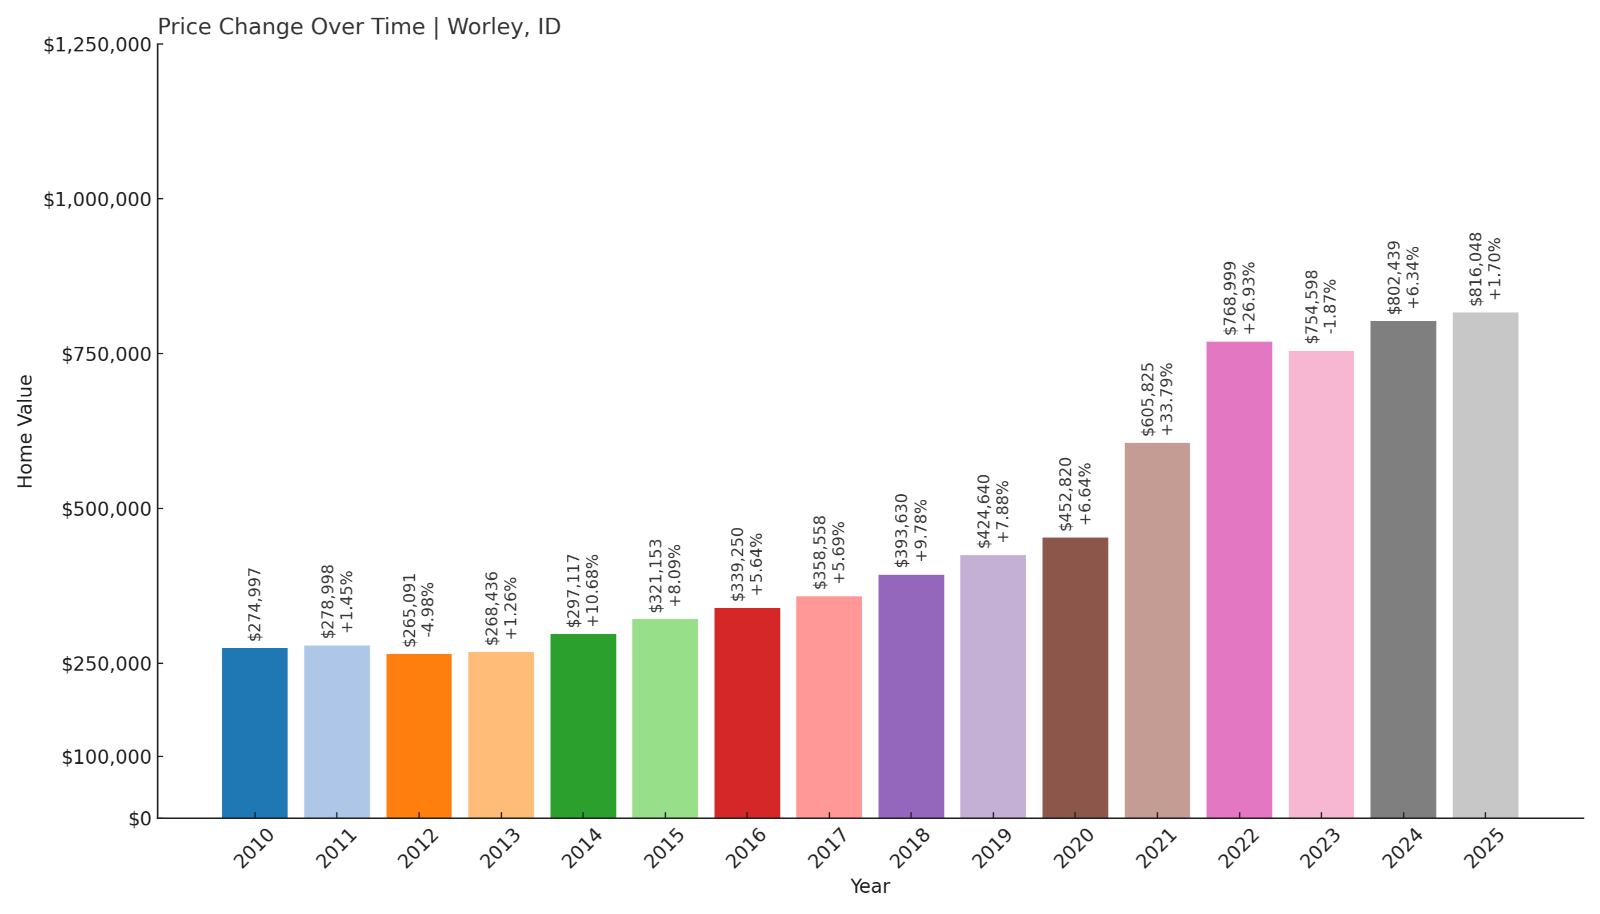
- 2010: $274,997
- 2011: $278,998 (+$4,001, +1.45% from previous year)
- 2012: $265,091 (-$13,907, -4.98% from previous year)
- 2013: $268,436 (+$3,345, +1.26% from previous year)
- 2014: $297,117 (+$28,681, +10.68% from previous year)
- 2015: $321,153 (+$24,036, +8.09% from previous year)
- 2016: $339,250 (+$18,097, +5.64% from previous year)
- 2017: $358,558 (+$19,308, +5.69% from previous year)
- 2018: $393,630 (+$35,072, +9.78% from previous year)
- 2019: $424,640 (+$31,010, +7.88% from previous year)
- 2020: $452,820 (+$28,179, +6.64% from previous year)
- 2021: $605,825 (+$153,006, +33.79% from previous year)
- 2022: $768,999 (+$163,174, +26.93% from previous year)
- 2023: $754,598 (-$14,402, -1.87% from previous year)
- 2024: $802,439 (+$47,841, +6.34% from previous year)
- 2025: $816,048 (+$13,610, +1.70% from previous year)
Since 2010, home prices in Worley have climbed 197%, finishing at $816,048 in 2025. Most of the increase happened during the pandemic boom, but values have continued to edge upward since.
Worley – A Rural Market Near Resort Growth
Worley is a small town in Kootenai County, located south of Coeur d’Alene and near Lake Coeur d’Alene’s southern shore. Though it may seem off the beaten path, it benefits from proximity to the Coeur d’Alene Casino Resort and easy access to both rural recreation and urban centers.
Many homes in Worley are on large parcels, and the area appeals to those looking for privacy with occasional resort amenities. Its position near expanding resort and tourism activity may have contributed to its substantial home value growth. Despite its rural vibe, Worley is one of the pricier housing markets in North Idaho today.
8. Hailey – 192% Home Price Increase Since June 2010
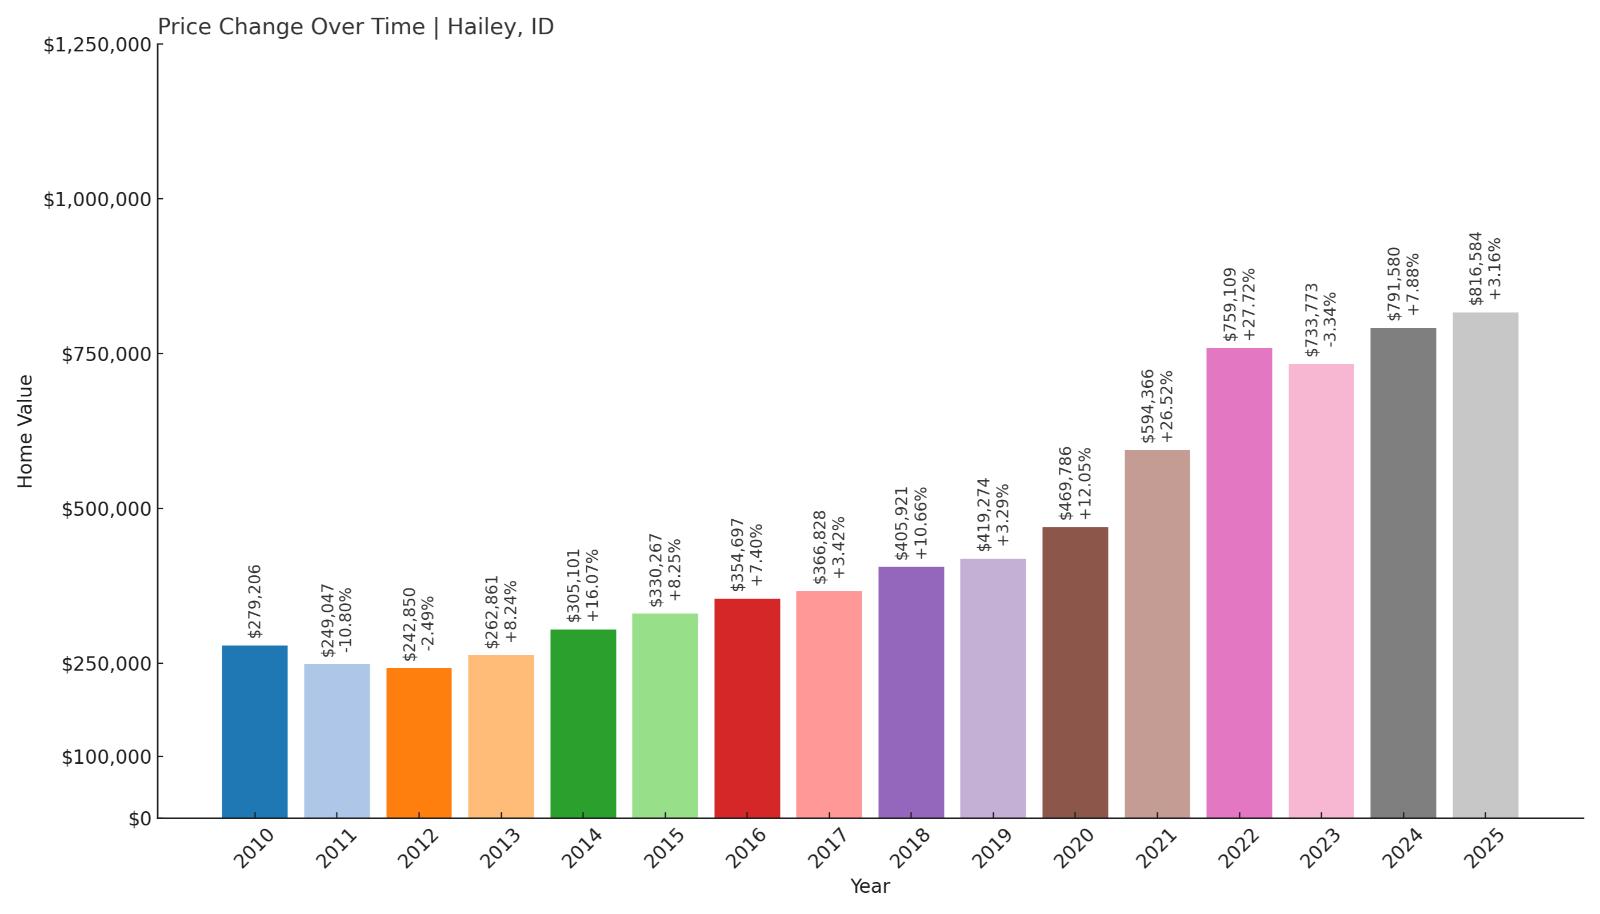
- 2010: $279,206
- 2011: $249,047 (-$30,159, -10.80% from previous year)
- 2012: $242,850 (-$6,197, -2.49% from previous year)
- 2013: $262,861 (+$20,011, +8.24% from previous year)
- 2014: $305,101 (+$42,240, +16.07% from previous year)
- 2015: $330,267 (+$25,167, +8.25% from previous year)
- 2016: $354,697 (+$24,430, +7.40% from previous year)
- 2017: $366,828 (+$12,131, +3.42% from previous year)
- 2018: $405,921 (+$39,093, +10.66% from previous year)
- 2019: $419,274 (+$13,353, +3.29% from previous year)
- 2020: $469,786 (+$50,511, +12.05% from previous year)
- 2021: $594,366 (+$124,580, +26.52% from previous year)
- 2022: $759,109 (+$164,744, +27.72% from previous year)
- 2023: $733,773 (-$25,336, -3.34% from previous year)
- 2024: $791,580 (+$57,807, +7.88% from previous year)
- 2025: $816,584 (+$25,004, +3.16% from previous year)
Home prices in Hailey have climbed from $279,206 in 2010 to $816,584 by mid-2025—an increase of 192%. The steepest growth came between 2020 and 2022, with modest corrections followed by steady gains since.
Hailey – Growing With Sun Valley’s Shadow

Located just south of Ketchum and Sun Valley, Hailey offers a more affordable base in the Wood River Valley while still benefiting from the area’s ski-town appeal. The town is home to Friedman Memorial Airport and has grown steadily with the rise of Sun Valley as a luxury resort destination.
Hailey provides a balance of accessibility and community living, drawing full-time residents, second-home buyers, and commuters alike. With its solid infrastructure, walkable downtown, and outdoor access, it has seen sharp demand in recent years. Although prices briefly dipped, strong interest in Blaine County real estate continues to push values up.
7. Tetonia – 280% Home Price Increase Since June 2011
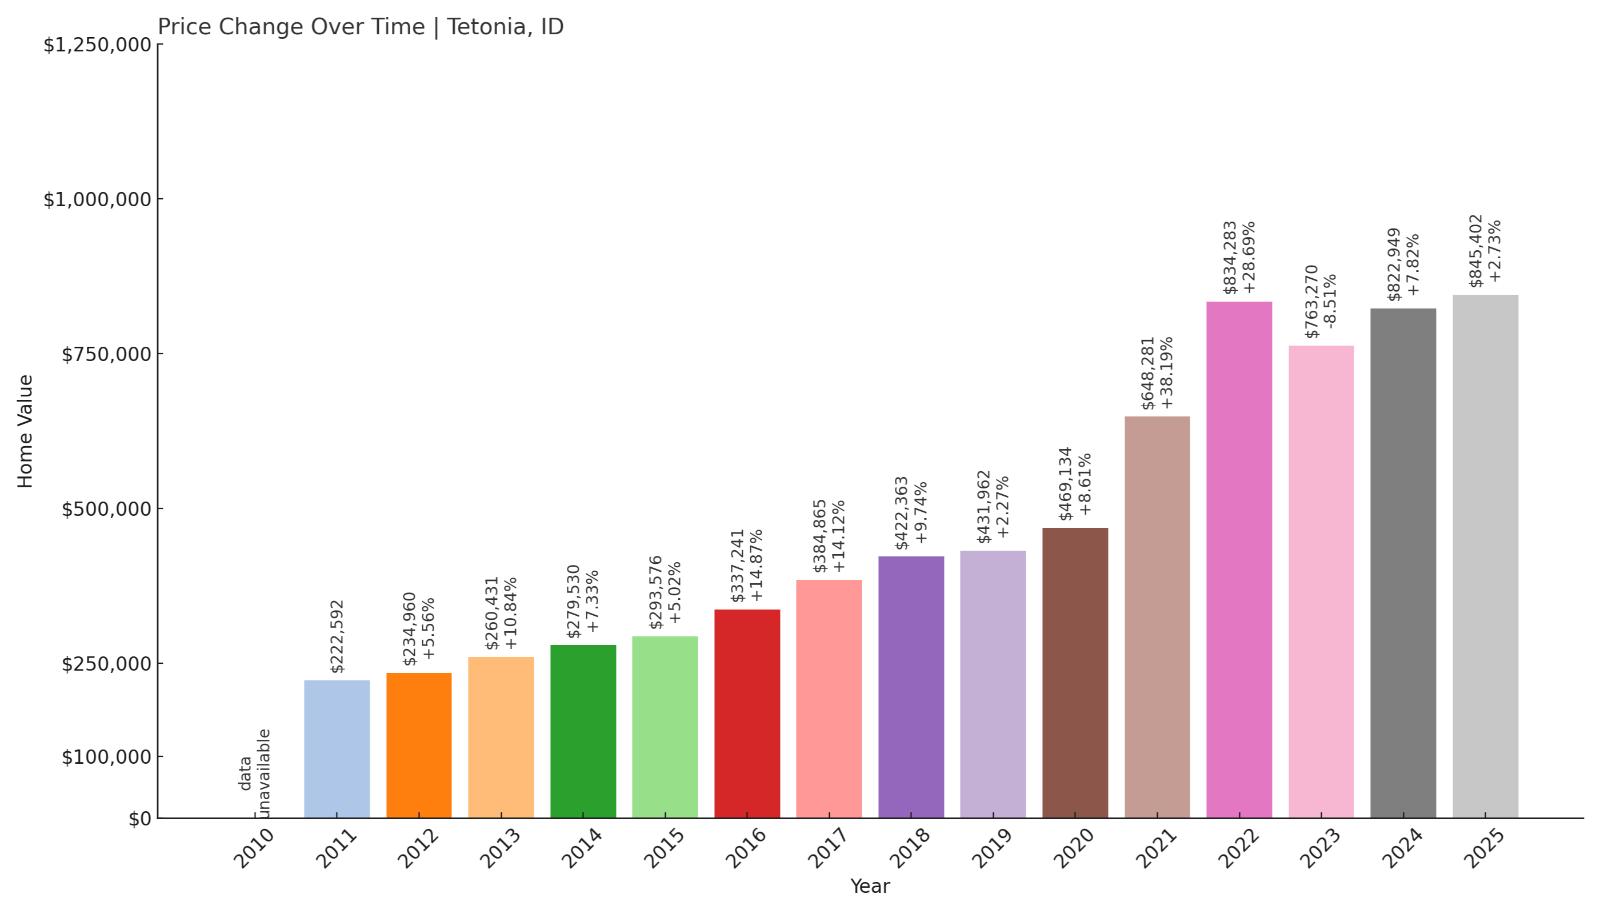
- 2010: N/A
- 2011: $222,592
- 2012: $234,960 (+$12,368, +5.56% from previous year)
- 2013: $260,431 (+$25,471, +10.84% from previous year)
- 2014: $279,530 (+$19,099, +7.33% from previous year)
- 2015: $293,576 (+$14,046, +5.02% from previous year)
- 2016: $337,241 (+$43,665, +14.87% from previous year)
- 2017: $384,865 (+$47,624, +14.12% from previous year)
- 2018: $422,363 (+$37,498, +9.74% from previous year)
- 2019: $431,962 (+$9,599, +2.27% from previous year)
- 2020: $469,134 (+$37,172, +8.61% from previous year)
- 2021: $648,281 (+$179,147, +38.19% from previous year)
- 2022: $834,283 (+$186,002, +28.69% from previous year)
- 2023: $763,270 (-$71,013, -8.51% from previous year)
- 2024: $822,949 (+$59,679, +7.82% from previous year)
- 2025: $845,402 (+$22,453, +2.73% from previous year)
Tetonia’s home prices have jumped 280% since 2011, with major spikes occurring during 2021 and 2022. Prices dipped in 2023 but have recovered steadily, reaching $845,402 in 2025.
Tetonia – Affordable Entry Point to Teton Valley
Tetonia sits northwest of Driggs in Idaho’s picturesque Teton Valley. While smaller and more rural than its neighbor, Tetonia offers stunning views of the Tetons and access to the same outdoor lifestyle. Buyers seeking larger lots and lower prices than nearby resort towns have increasingly turned to this area.
During the recent housing boom, Tetonia’s relative affordability and proximity to skiing and hiking made it a hotspot for both local buyers and out-of-state investors. Its recovery since 2023 suggests continued interest, especially among those priced out of Victor and Driggs.
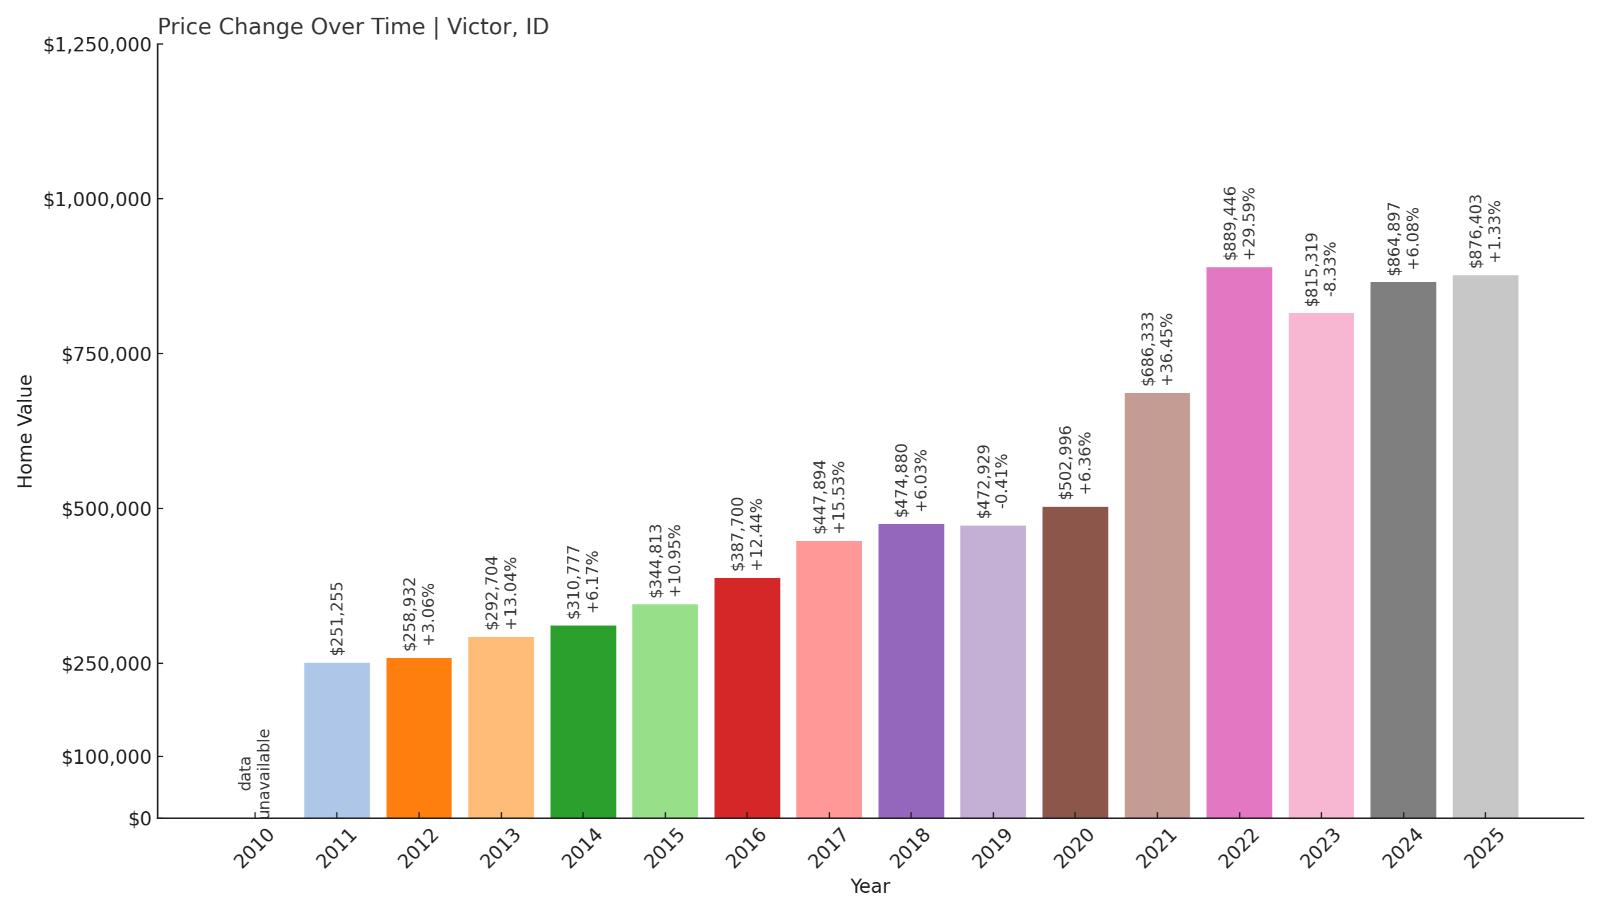
6. Victor – 249% Home Price Increase Since June 2011
- 2010: N/A
- 2011: $251,255
- 2012: $258,932 (+$7,677, +3.06% from previous year)
- 2013: $292,704 (+$33,772, +13.04% from previous year)
- 2014: $310,777 (+$18,073, +6.17% from previous year)
- 2015: $344,813 (+$34,035, +10.95% from previous year)
- 2016: $387,700 (+$42,888, +12.44% from previous year)
- 2017: $447,894 (+$60,193, +15.53% from previous year)
- 2018: $474,880 (+$26,987, +6.03% from previous year)
- 2019: $472,929 (-$1,951, -0.41% from previous year)
- 2020: $502,996 (+$30,067, +6.36% from previous year)
- 2021: $686,333 (+$183,337, +36.45% from previous year)
- 2022: $889,446 (+$203,113, +29.59% from previous year)
- 2023: $815,319 (-$74,127, -8.33% from previous year)
- 2024: $864,897 (+$49,579, +6.08% from previous year)
- 2025: $876,403 (+$11,506, +1.33% from previous year)
Victor’s home values have soared 249% since 2011. After peaking in 2022, the market cooled slightly, but prices are once again on the rise, with the 2025 median hitting $876,403.
Victor – Teton Valley’s Growing Anchor
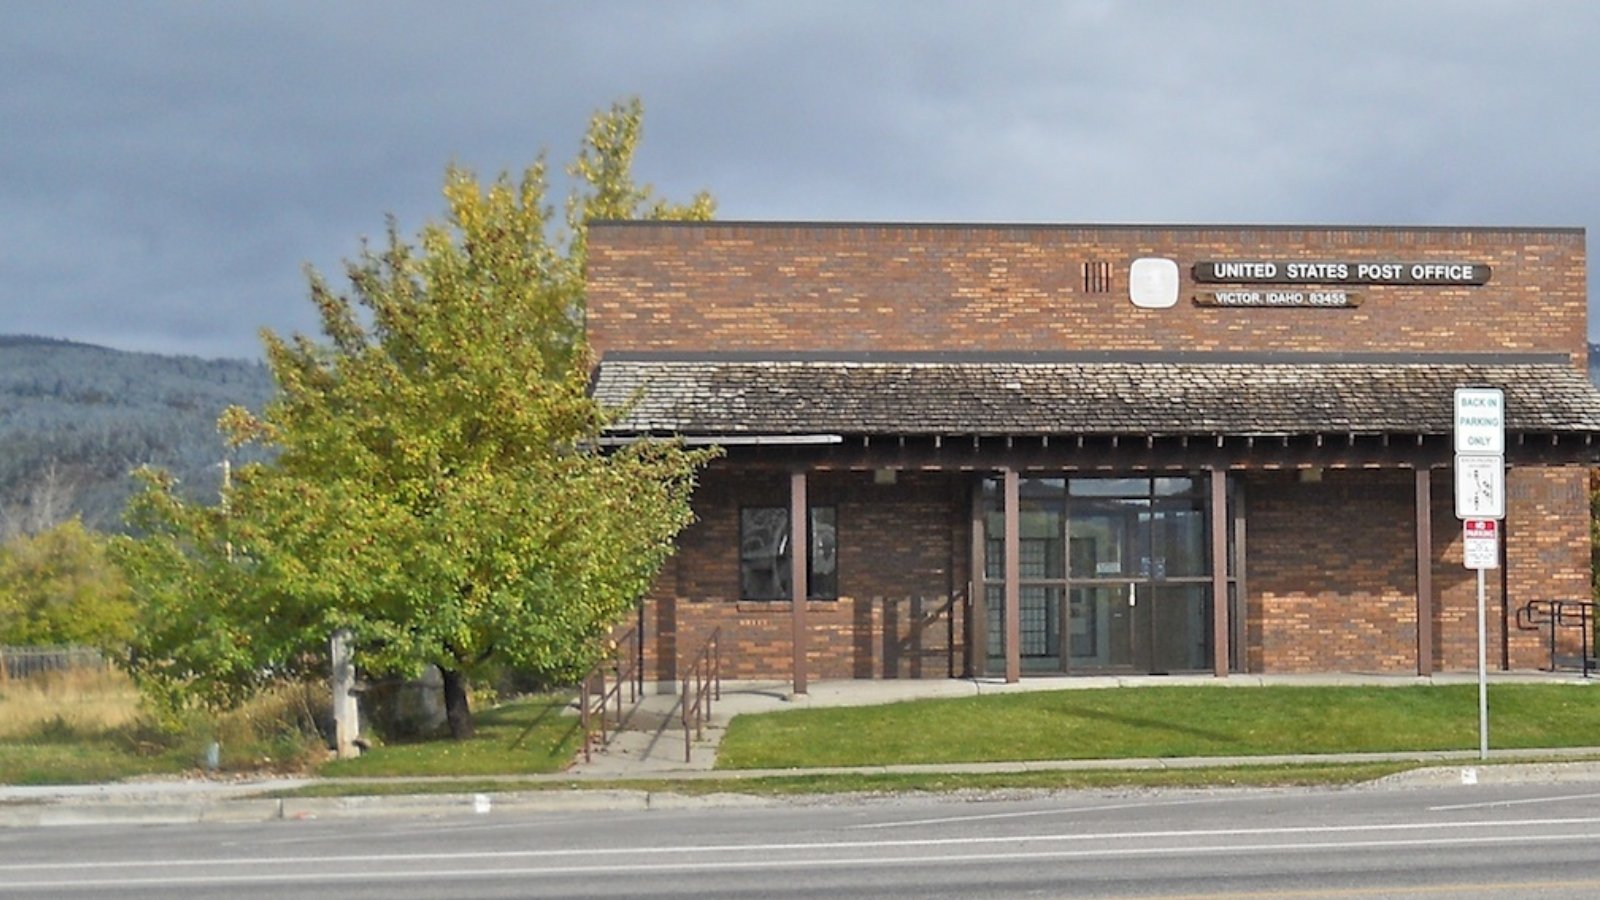
Victor is the largest town on the Idaho side of the Teton Range and a key gateway for commuters heading over Teton Pass to Jackson, Wyoming. This location has made it highly desirable for those working in Jackson but seeking more attainable housing and less congestion.
The area has seen a boom in development and infrastructure over the past decade, fueling demand and pushing home values up. Its popularity surged during the pandemic, with the trend of remote work adding to appeal. As of 2025, it remains one of Idaho’s top markets for high-end mountain living.
5. Harrison – 97% Home Price Increase Since June 2010
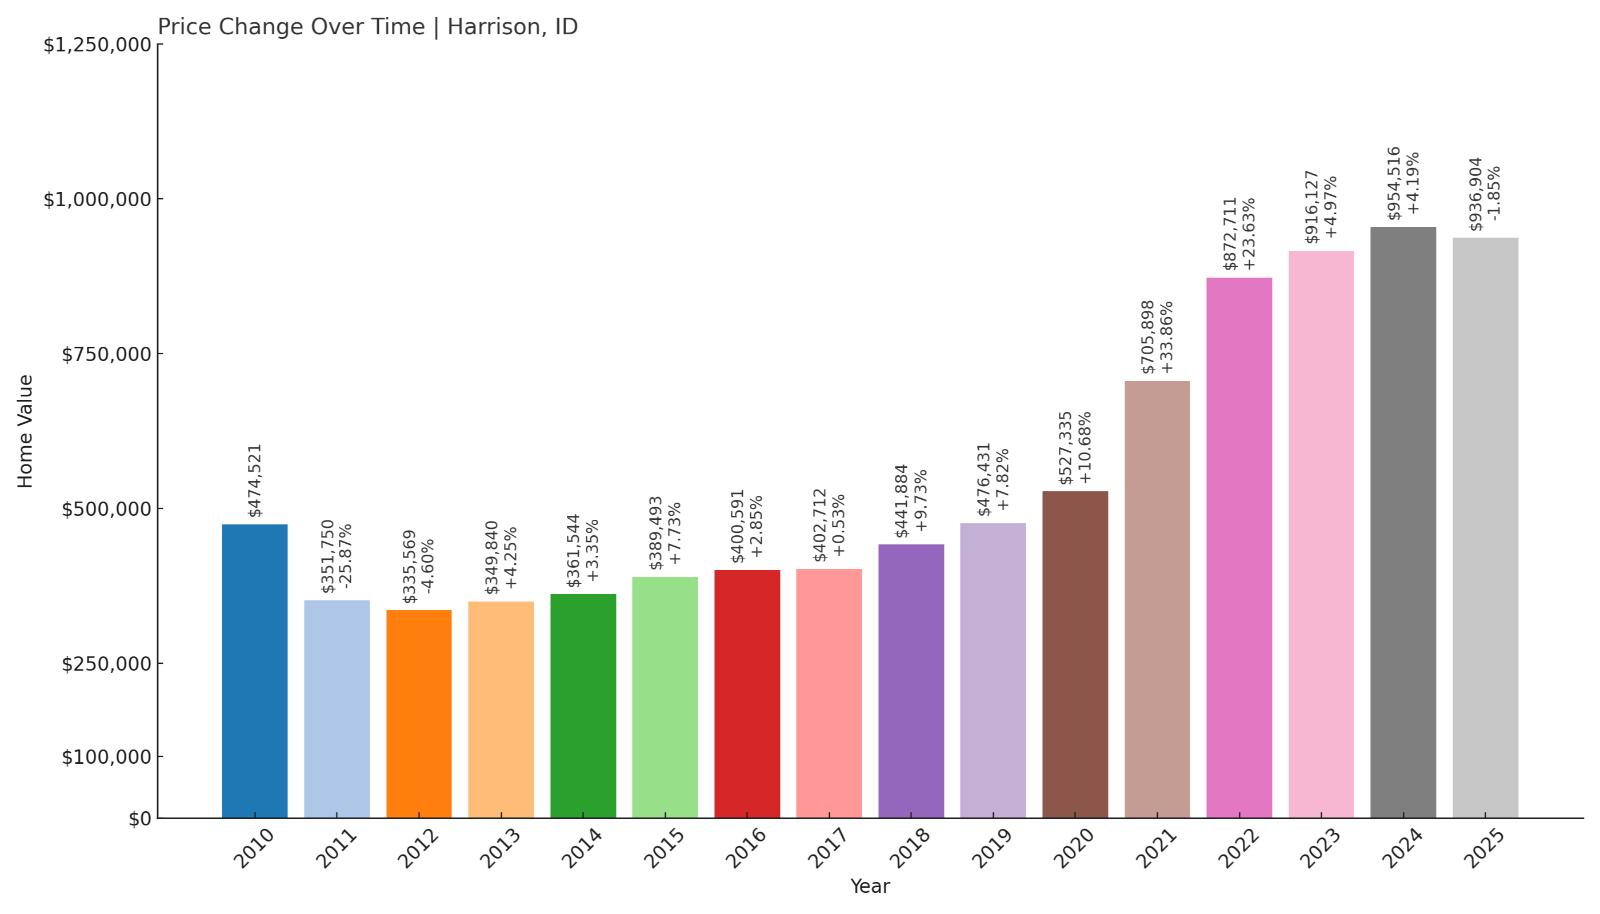
- 2010: $474,521
- 2011: $351,750 (-$122,771, -25.87% from previous year)
- 2012: $335,569 (-$16,180, -4.60% from previous year)
- 2013: $349,840 (+$14,271, +4.25% from previous year)
- 2014: $361,544 (+$11,704, +3.35% from previous year)
- 2015: $389,493 (+$27,949, +7.73% from previous year)
- 2016: $400,591 (+$11,097, +2.85% from previous year)
- 2017: $402,712 (+$2,122, +0.53% from previous year)
- 2018: $441,884 (+$39,172, +9.73% from previous year)
- 2019: $476,431 (+$34,547, +7.82% from previous year)
- 2020: $527,335 (+$50,904, +10.68% from previous year)
- 2021: $705,898 (+$178,563, +33.86% from previous year)
- 2022: $872,711 (+$166,813, +23.63% from previous year)
- 2023: $916,127 (+$43,416, +4.97% from previous year)
- 2024: $954,516 (+$38,389, +4.19% from previous year)
- 2025: $936,904 (-$17,612, -1.85% from previous year)
Harrison’s home prices rose from $474,521 in 2010 to $936,904 in 2025—an increase of 97%. Despite a recent dip, long-term growth has been strong, particularly after 2020.
Harrison – Views Over Lake Coeur d’Alene
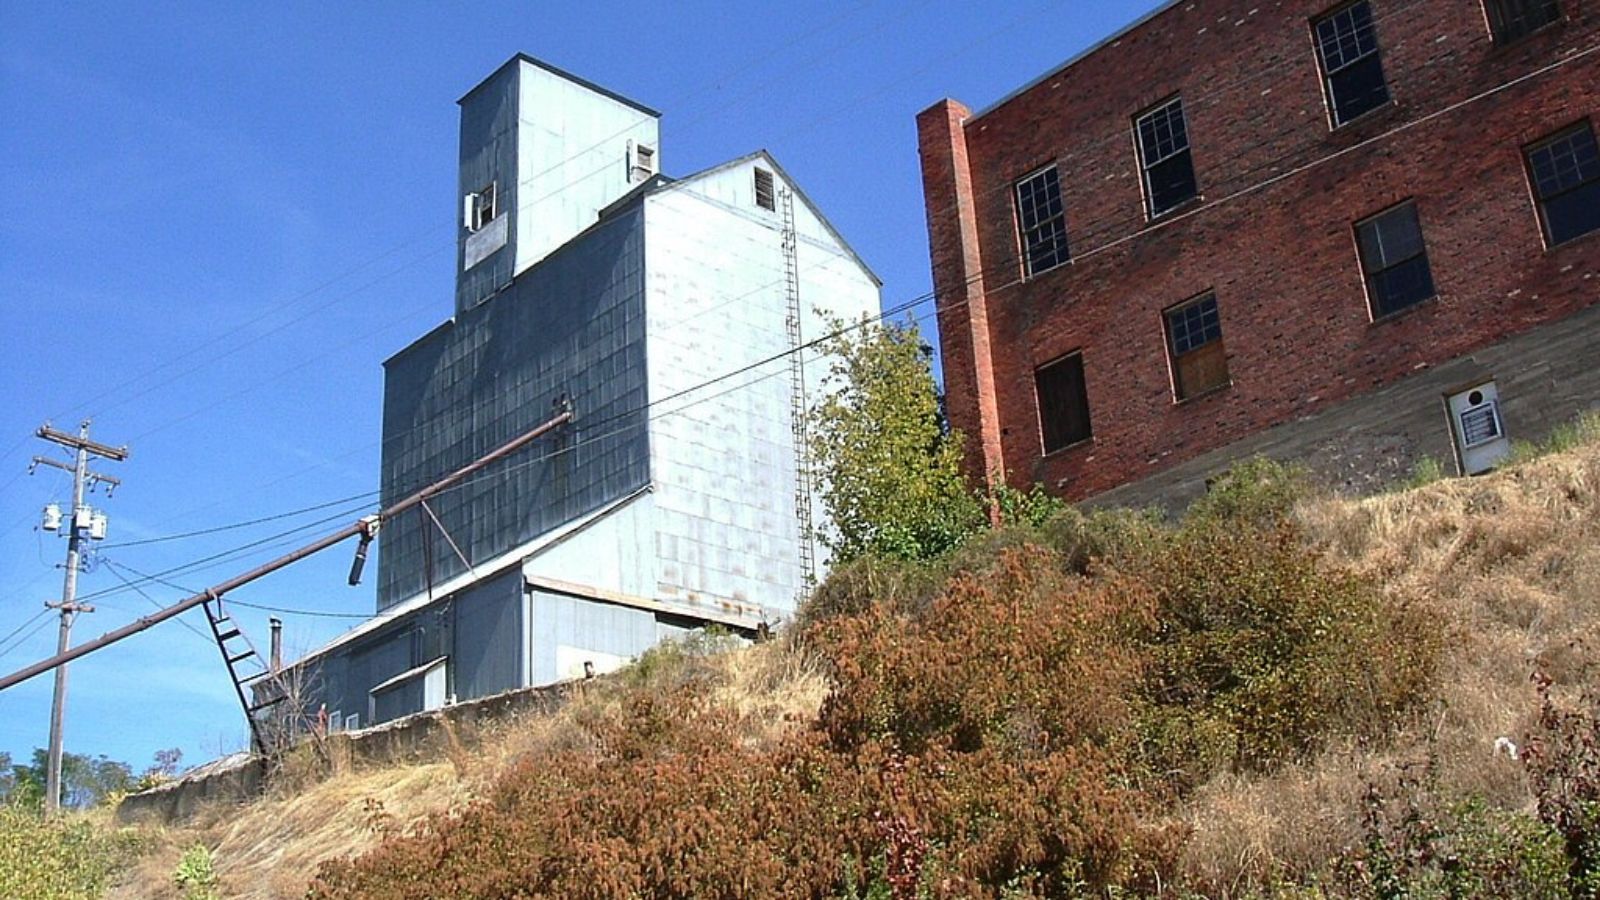
Harrison is a small lakeside town in Kootenai County, perched on the eastern edge of Lake Coeur d’Alene. Known for its marina, cycling trails, and panoramic views, it has become an attractive destination for second-home buyers and retirees.
Though the market softened slightly in 2025, the area’s natural beauty and limited development options continue to support high home values. Harrison’s quiet charm and access to the lake make it one of the most exclusive waterfront communities in North Idaho.
4. Coolin – 213% Home Price Increase Since June 2010
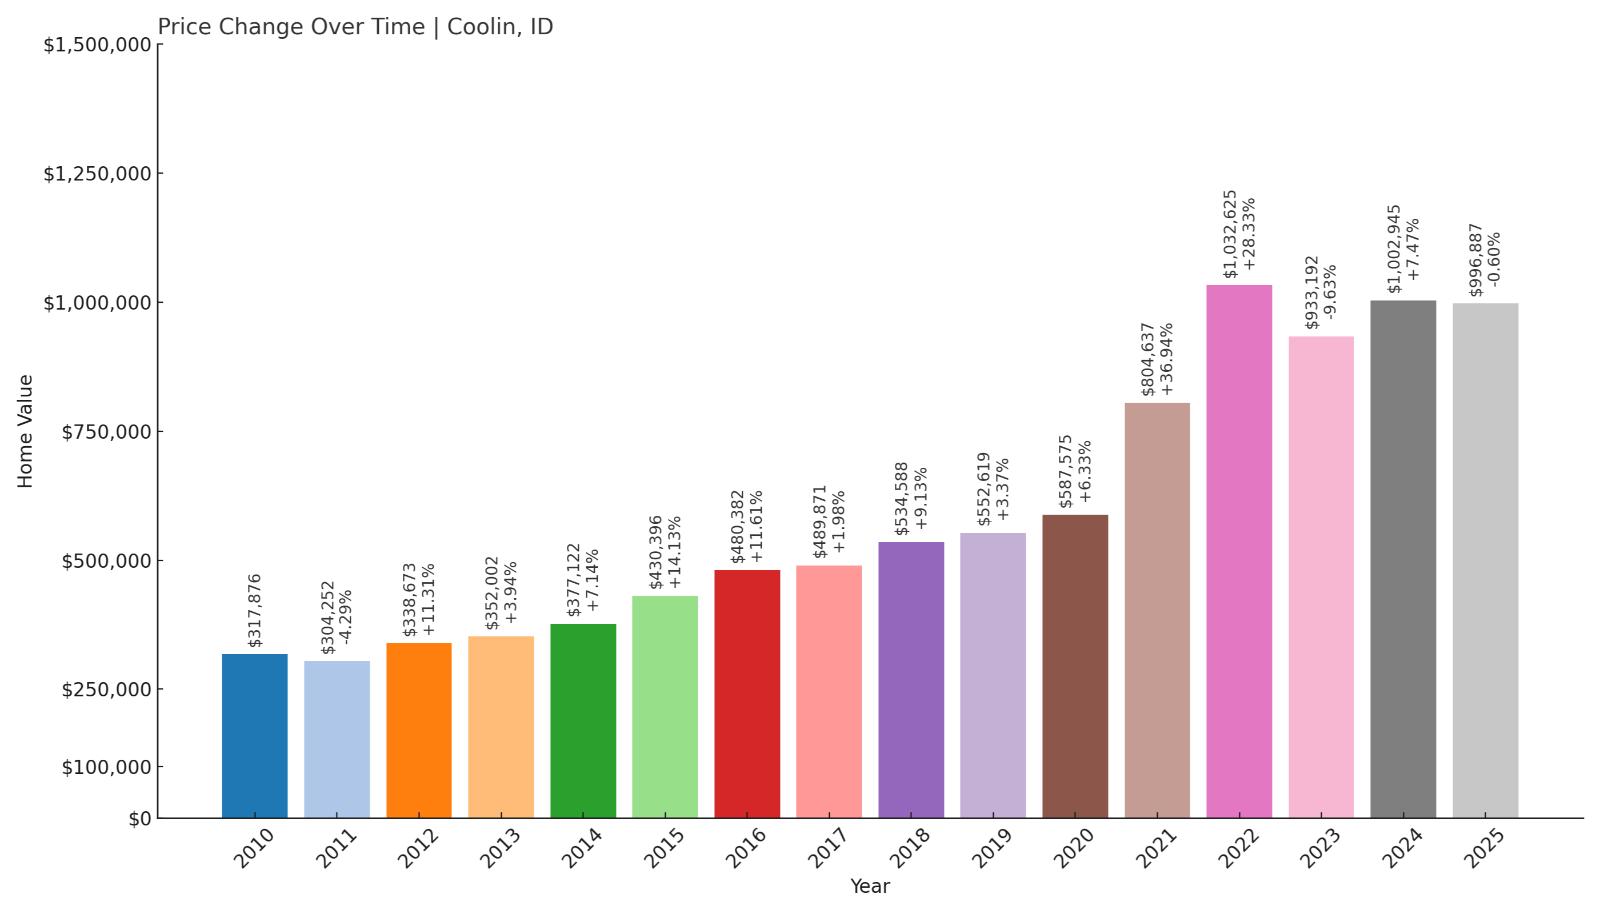
- 2010: $317,876
- 2011: $304,252 (-$13,624, -4.29% from previous year)
- 2012: $338,673 (+$34,421, +11.31% from previous year)
- 2013: $352,002 (+$13,328, +3.94% from previous year)
- 2014: $377,122 (+$25,120, +7.14% from previous year)
- 2015: $430,396 (+$53,274, +14.13% from previous year)
- 2016: $480,382 (+$49,986, +11.61% from previous year)
- 2017: $489,871 (+$9,488, +1.98% from previous year)
- 2018: $534,588 (+$44,717, +9.13% from previous year)
- 2019: $552,619 (+$18,031, +3.37% from previous year)
- 2020: $587,575 (+$34,956, +6.33% from previous year)
- 2021: $804,637 (+$217,063, +36.94% from previous year)
- 2022: $1,032,625 (+$227,988, +28.33% from previous year)
- 2023: $933,192 (-$99,433, -9.63% from previous year)
- 2024: $1,002,945 (+$69,753, +7.47% from previous year)
- 2025: $996,887 (-$6,058, -0.60% from previous year)
Coolin’s home values have soared 213% since 2010, rising from just under $318,000 to nearly $997,000 in 2025. The market peaked in 2022 and has since fluctuated, though values remain near record highs.
Coolin – Luxury Living on Priest Lake
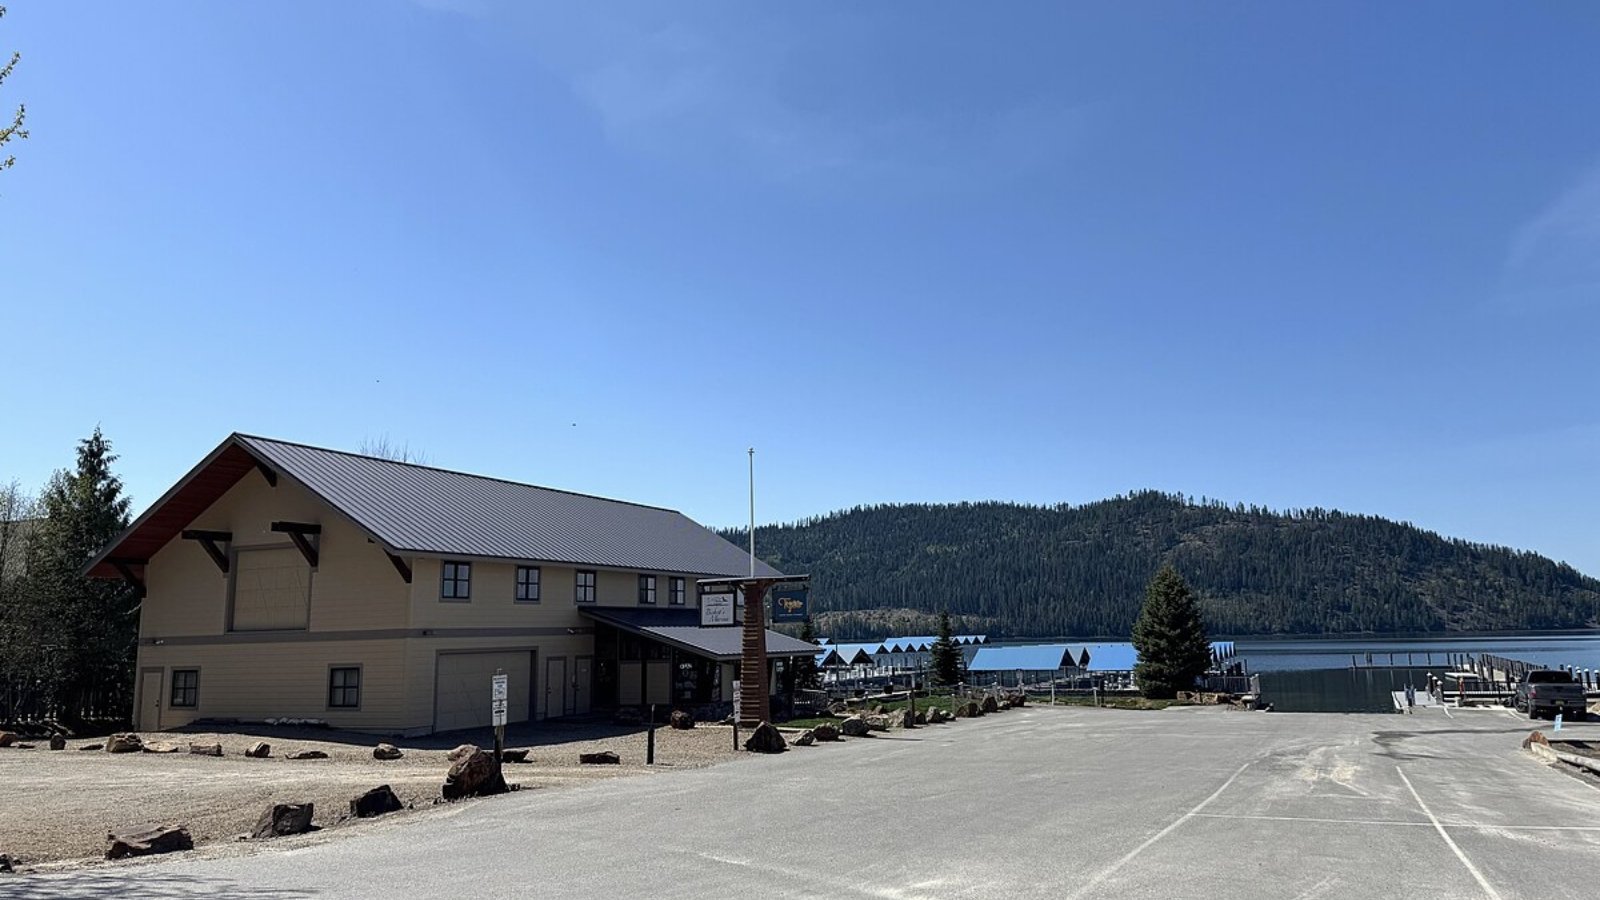
Coolin sits on the southern tip of Priest Lake, one of North Idaho’s most pristine and secluded lakes. It’s known for lakefront cabins, large vacation homes, and access to the Selkirk Mountains. The area sees strong seasonal interest, especially from affluent buyers seeking a quiet waterfront escape.
The huge price gains in 2021 and 2022 align with the post-pandemic demand for private, high-amenity retreats. While values have leveled off, the limited number of homes and strict environmental regulations ensure continued price pressure in this exclusive market.
3. Hayden Lake – 163% Home Price Increase Since June 2010
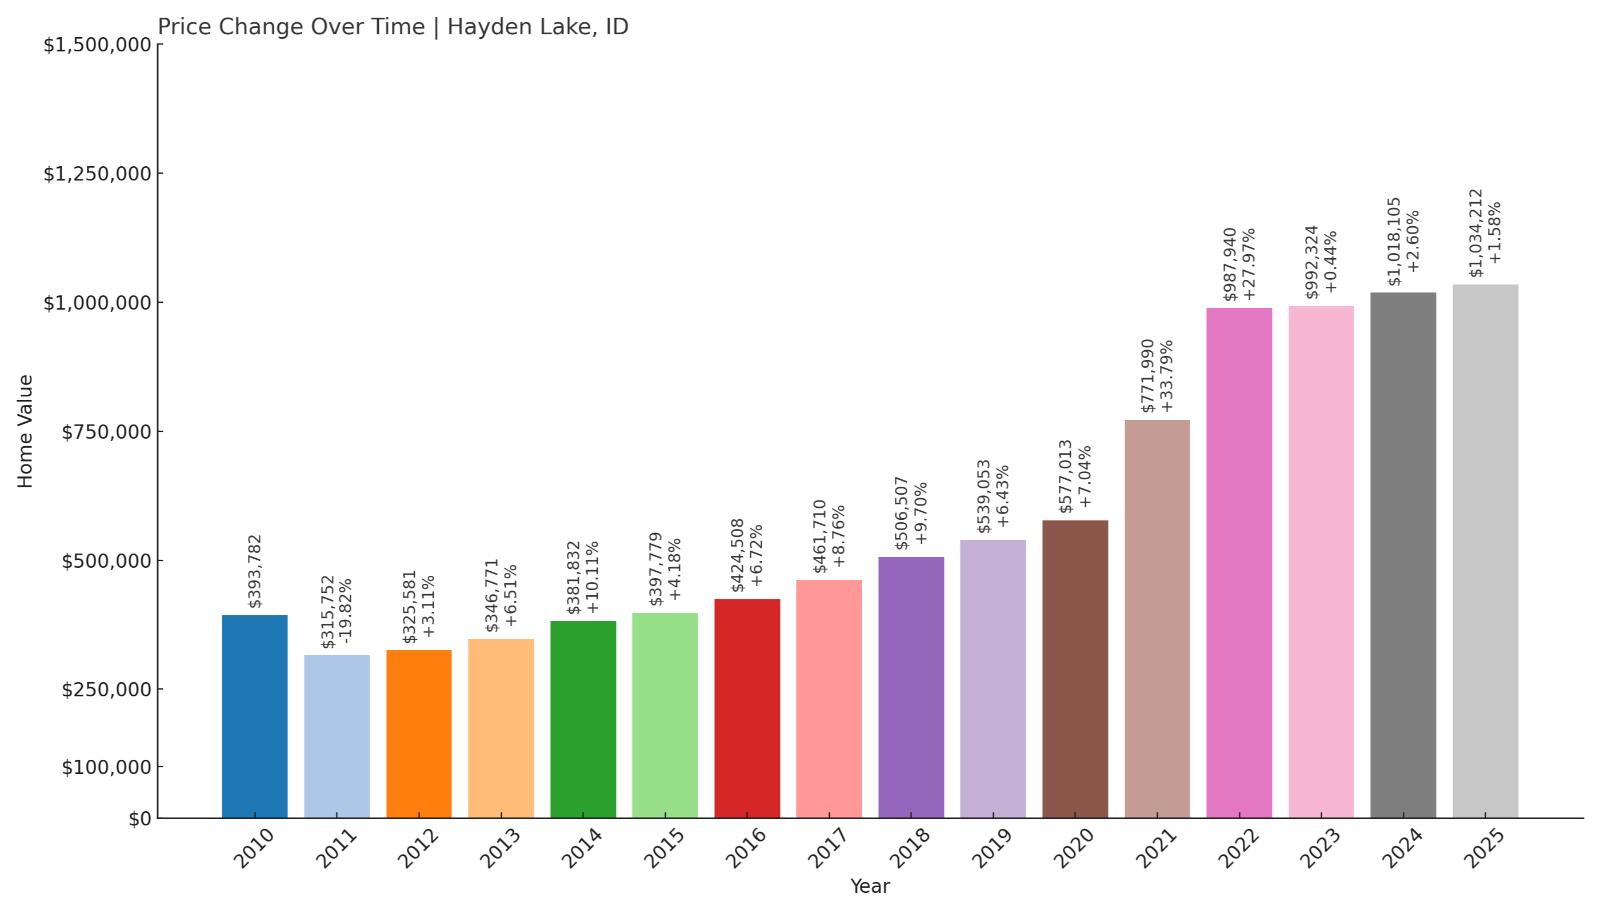
- 2010: $393,782
- 2011: $315,752 (-$78,030, -19.82% from previous year)
- 2012: $325,581 (+$9,829, +3.11% from previous year)
- 2013: $346,771 (+$21,190, +6.51% from previous year)
- 2014: $381,832 (+$35,061, +10.11% from previous year)
- 2015: $397,779 (+$15,946, +4.18% from previous year)
- 2016: $424,508 (+$26,730, +6.72% from previous year)
- 2017: $461,710 (+$37,202, +8.76% from previous year)
- 2018: $506,507 (+$44,797, +9.70% from previous year)
- 2019: $539,053 (+$32,546, +6.43% from previous year)
- 2020: $577,013 (+$37,960, +7.04% from previous year)
- 2021: $771,990 (+$194,977, +33.79% from previous year)
- 2022: $987,940 (+$215,950, +27.97% from previous year)
- 2023: $992,324 (+$4,385, +0.44% from previous year)
- 2024: $1,018,105 (+$25,780, +2.60% from previous year)
- 2025: $1,034,212 (+$16,108, +1.58% from previous year)
Home values in Hayden Lake have increased 163% since 2010, reaching over $1 million in 2025. After sharp spikes during the pandemic, growth has cooled but continues at a steady pace.
Hayden Lake – Waterfront Prestige Near Coeur d’Alene
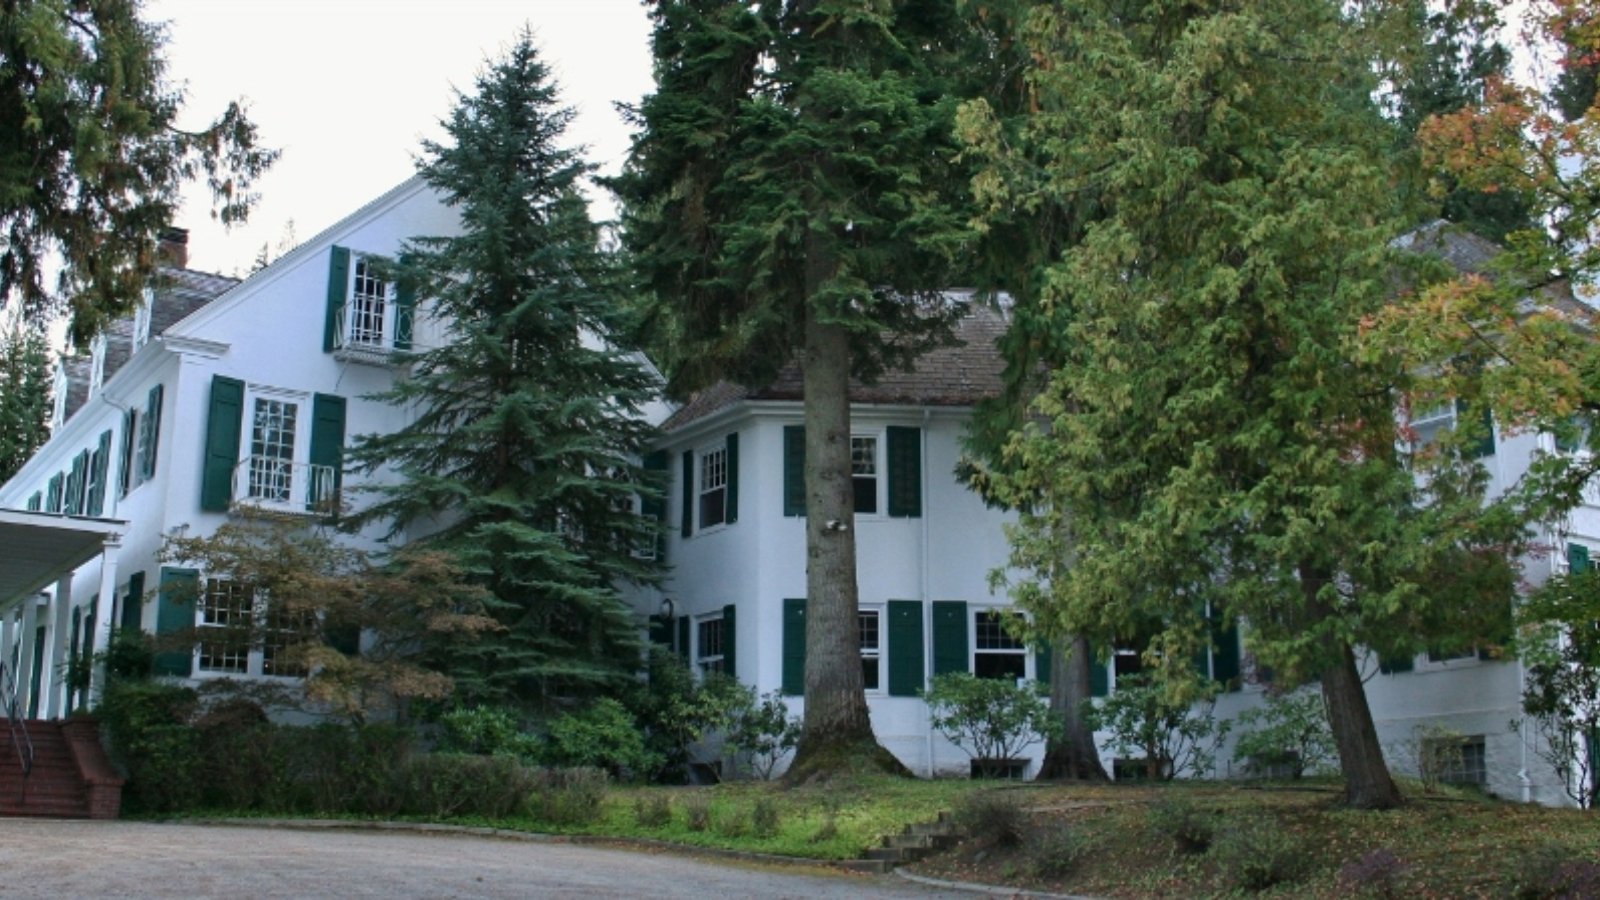
Hayden Lake is a small but upscale community located just northeast of Coeur d’Alene. The lakefront area is lined with luxury homes and private docks, while the town itself offers proximity to golf courses, marinas, and mountain recreation.
The pandemic housing surge brought new interest from out-of-state buyers, pushing prices up sharply. Though values have stabilized, Hayden Lake remains a top-tier Idaho location with one of the highest median home values in the state.
2. Sun Valley – 154% Home Price Increase Since June 2010
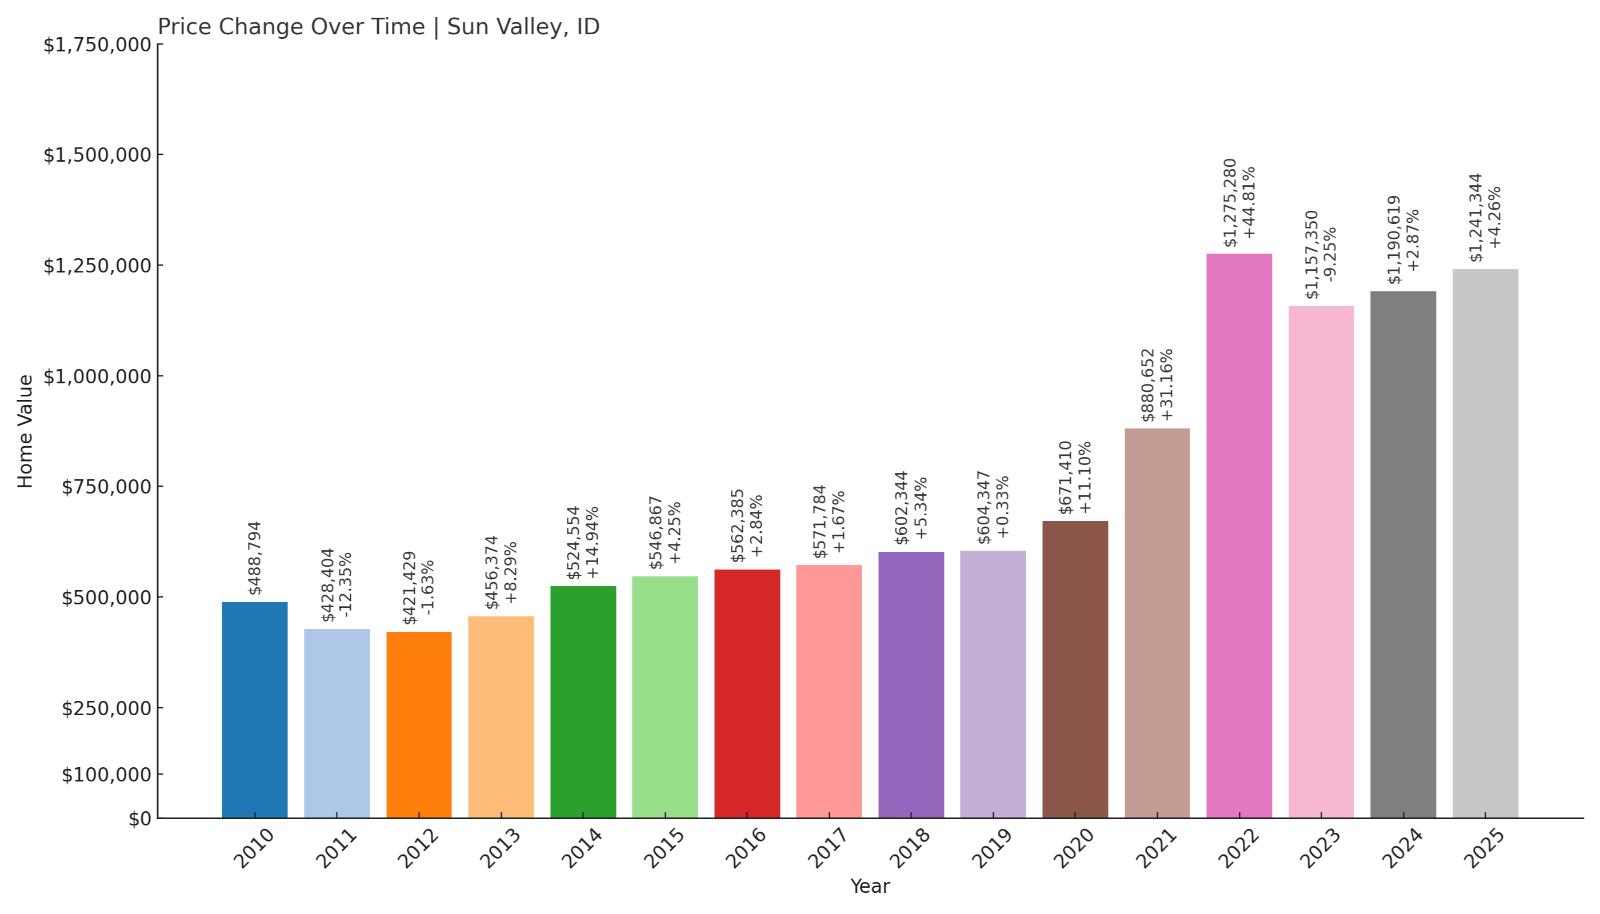
- 2010: $488,794
- 2011: $428,404 (-$60,389, -12.35% from previous year)
- 2012: $421,429 (-$6,976, -1.63% from previous year)
- 2013: $456,374 (+$34,946, +8.29% from previous year)
- 2014: $524,554 (+$68,180, +14.94% from previous year)
- 2015: $546,867 (+$22,312, +4.25% from previous year)
- 2016: $562,385 (+$15,518, +2.84% from previous year)
- 2017: $571,784 (+$9,399, +1.67% from previous year)
- 2018: $602,344 (+$30,560, +5.34% from previous year)
- 2019: $604,347 (+$2,003, +0.33% from previous year)
- 2020: $671,410 (+$67,063, +11.10% from previous year)
- 2021: $880,652 (+$209,242, +31.16% from previous year)
- 2022: $1,275,280 (+$394,628, +44.81% from previous year)
- 2023: $1,157,350 (-$117,931, -9.25% from previous year)
- 2024: $1,190,619 (+$33,269, +2.87% from previous year)
- 2025: $1,241,344 (+$50,725, +4.26% from previous year)
Sun Valley home values have grown 154% since 2010, topping $1.24 million by mid-2025. After a major jump in 2022, the market corrected slightly before continuing on an upward path.
Sun Valley – Idaho’s Most Famous Resort Town
Sun Valley is a year-round destination for the wealthy and well-connected, best known for its ski slopes, luxury hotels, and celebrity allure. It’s one of the oldest ski resorts in the country and continues to attract high-end buyers from across the country.
Home prices here reflect both the exclusivity and the scarcity of buildable land. The surge in prices from 2020 to 2022 was driven by renewed interest in mountain getaways and second homes. While the market has leveled off slightly, it remains one of the most expensive in Idaho and the broader Intermountain West.
1. Ketchum – 140% Home Price Increase Since June 2010
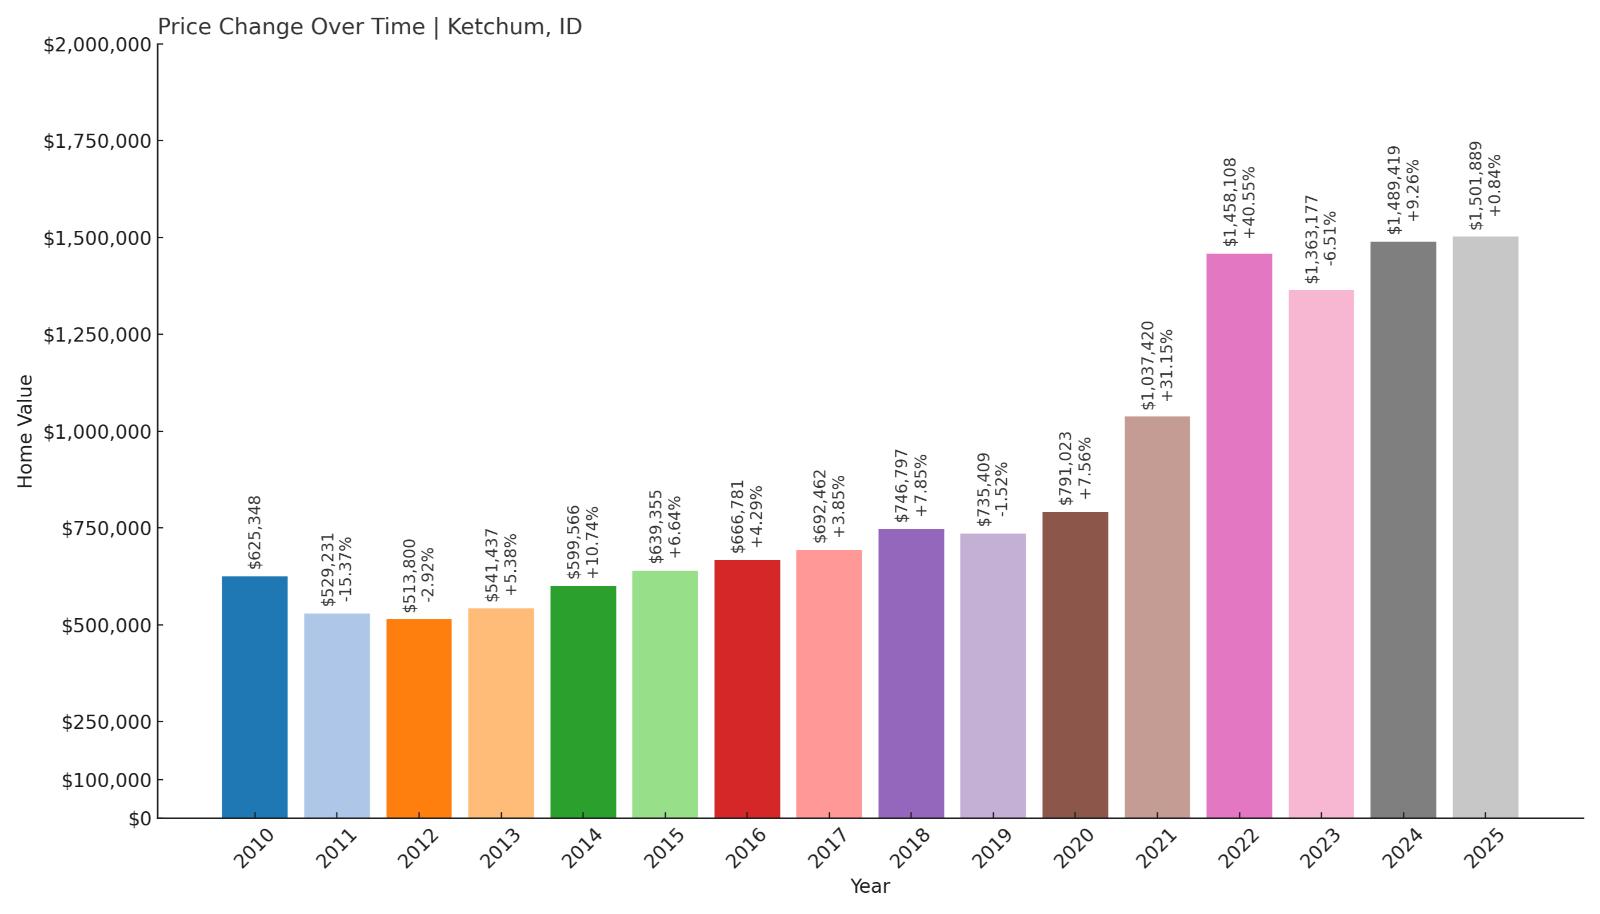
- 2010: $625,348
- 2011: $529,231 (-$96,117, -15.37% from previous year)
- 2012: $513,800 (-$15,431, -2.92% from previous year)
- 2013: $541,437 (+$27,638, +5.38% from previous year)
- 2014: $599,566 (+$58,128, +10.74% from previous year)
- 2015: $639,355 (+$39,789, +6.64% from previous year)
- 2016: $666,781 (+$27,426, +4.29% from previous year)
- 2017: $692,462 (+$25,681, +3.85% from previous year)
- 2018: $746,797 (+$54,335, +7.85% from previous year)
- 2019: $735,409 (-$11,388, -1.52% from previous year)
- 2020: $791,023 (+$55,614, +7.56% from previous year)
- 2021: $1,037,420 (+$246,397, +31.15% from previous year)
- 2022: $1,458,108 (+$420,688, +40.55% from previous year)
- 2023: $1,363,177 (-$94,931, -6.51% from previous year)
- 2024: $1,489,419 (+$126,243, +9.26% from previous year)
- 2025: $1,501,889 (+$12,469, +0.84% from previous year)
Ketchum has the highest home prices in Idaho, with values rising 140% since 2010 to reach $1.5 million in 2025. While prices peaked in 2022, they’ve remained strong and show steady increases since.
Ketchum – Idaho’s Priciest Mountain Town
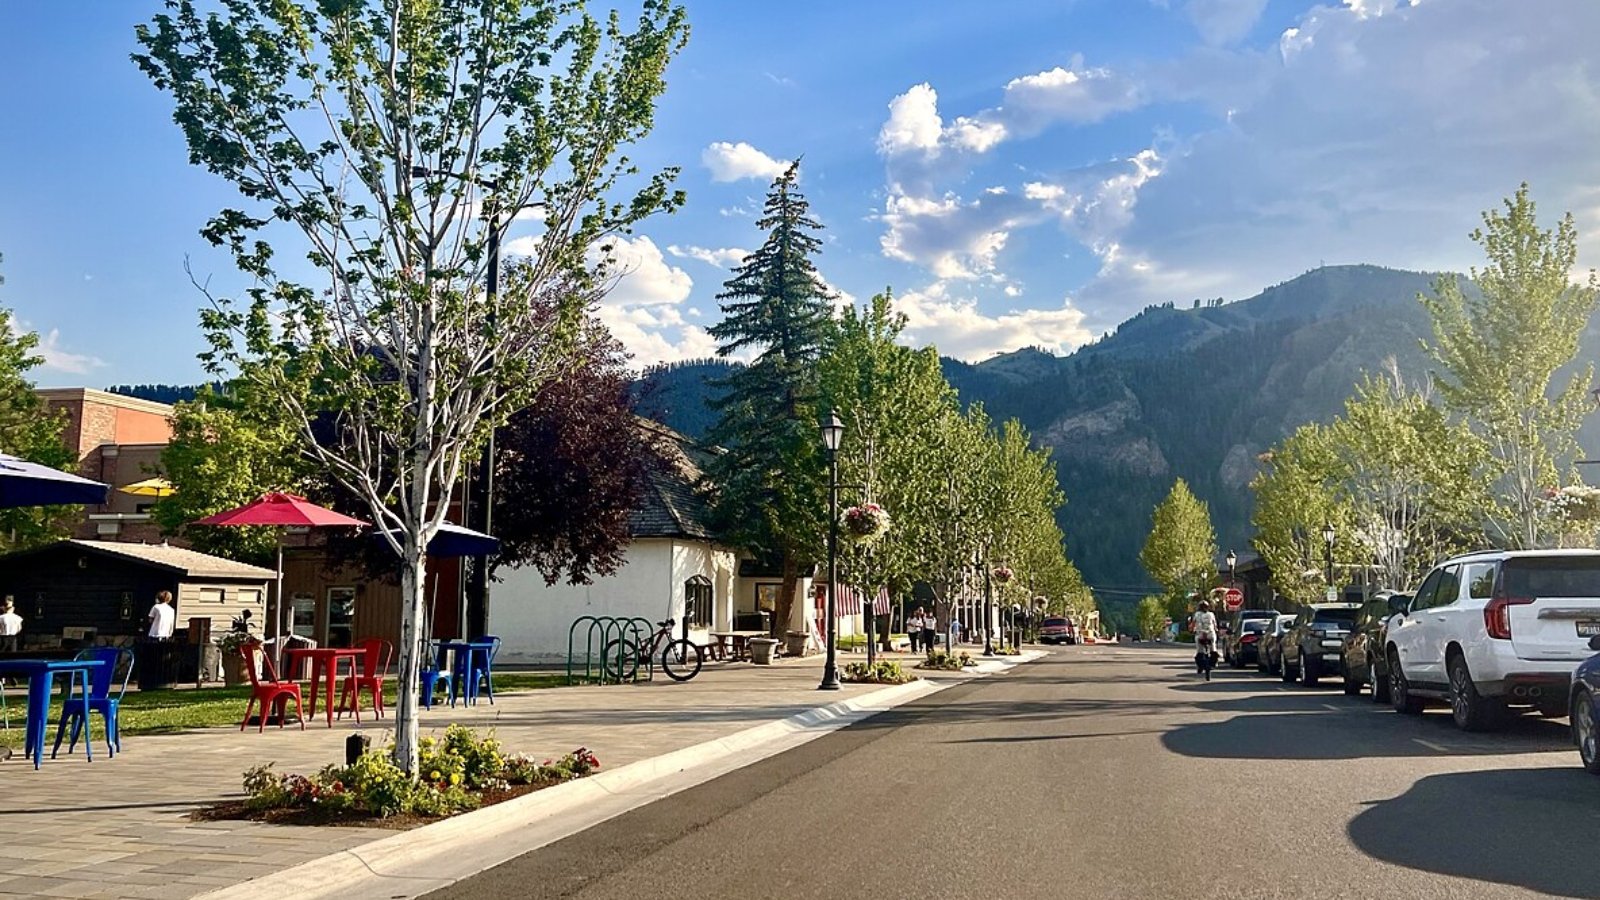
Ketchum is the beating heart of Idaho’s high-end real estate scene. Adjacent to Sun Valley and boasting the same alpine charm, Ketchum blends ski culture with luxury retail, fine dining, and art galleries. It’s a place where year-round recreation meets wealth and exclusivity.
The housing market here exploded in the early 2020s, driven by remote work and a flood of new buyers. Although prices have cooled slightly since 2022, Ketchum remains the state’s most expensive town, offering both lifestyle and investment appeal.