
In Wisconsin, affordable housing isn’t hard to find—if you know where to look. According to the Zillow Home Value Index, small-town markets across the state are keeping prices low in 2025, even as other regions feel the pressure of rising costs. These 20 Wisconsin towns stand out for their budget-friendly home prices, with many places still offering properties under $150,000. Whether you’re hoping to buy your first home or just stretch your budget further, these quiet communities could offer exactly what you’re looking for.
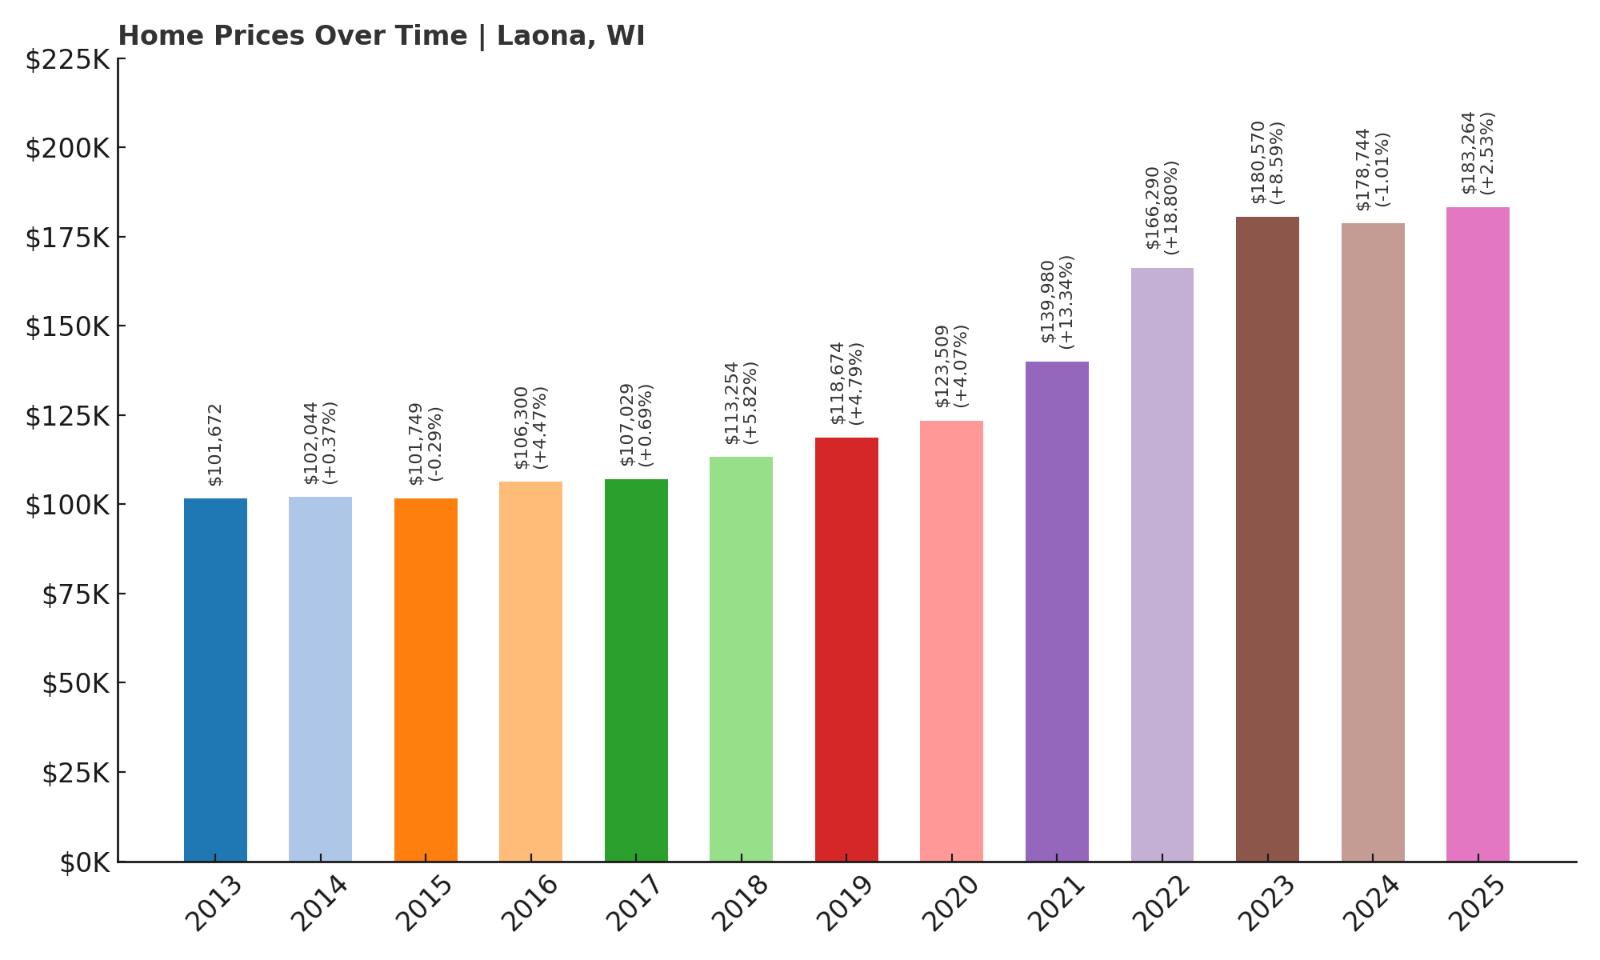
20. Laona – 80% Home Price Increase Since May 2013
- 2010: N/A
- 2011: N/A
- 2012: N/A
- 2013: $101,672
- 2014: $102,044 (+$372, +0.37% from previous year)
- 2015: $101,749 (-$295, -0.29% from previous year)
- 2016: $106,300 (+$4,551, +4.47% from previous year)
- 2017: $107,029 (+$729, +0.69% from previous year)
- 2018: $113,254 (+$6,225, +5.82% from previous year)
- 2019: $118,674 (+$5,420, +4.79% from previous year)
- 2020: $123,509 (+$4,835, +4.07% from previous year)
- 2021: $139,980 (+$16,471, +13.34% from previous year)
- 2022: $166,290 (+$26,310, +18.80% from previous year)
- 2023: $180,570 (+$14,279, +8.59% from previous year)
- 2024: $178,744 (-$1,826, -1.01% from previous year)
- 2025: $183,264 (+$4,520, +2.53% from previous year)
Laona’s home values have climbed steadily since 2013, rising from just over $101,000 to $183,264 in 2025. That’s an 80% increase in 12 years. Despite a slight dip in 2024, the overall trend remains positive, with consistent growth especially notable between 2020 and 2022. Buyers saw a surge of more than 18% in 2022 alone, reflecting renewed interest in the town. Price increases have moderated since, but even in 2025, prices are ticking upward again. Overall, Laona remains a very affordable community, and even its highest home values are well below state averages.
Laona – Stable Growth in the Northwoods
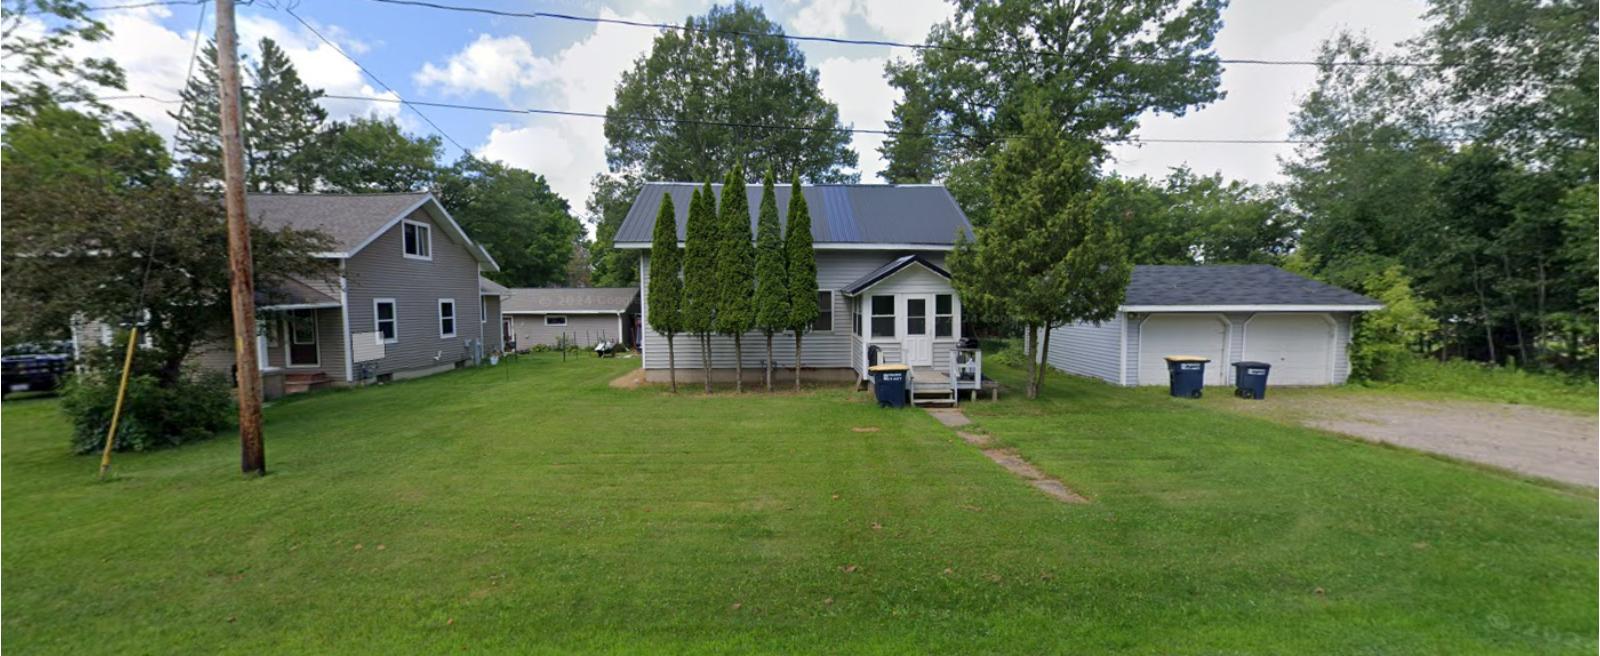
Laona sits in the heart of Forest County, surrounded by lakes, trails, and dense pine forests that give it a classic Northwoods character. It’s a small, quiet community, perfect for those who value space and nature over hustle and bustle. Local amenities include basic services and small-town shops, while more extensive offerings are within reach in nearby towns. Laona is also home to the historic Lumberjack Steam Train and Camp Five Museum, a nod to its timber roots. With affordable housing and outdoor beauty, it’s attractive to retirees and seasonal homeowners alike.
The relatively modest but steady rise in home values suggests a healthy local market driven by demand from buyers looking for peaceful retreats or remote living opportunities. Even with 2025 prices nearing $183,000, Laona remains more affordable than most Wisconsin towns. Its location and character make it ideal for buyers who want serenity without the higher price tags found elsewhere in the state.
19. Ladysmith – 110% Home Price Increase Since May 2010
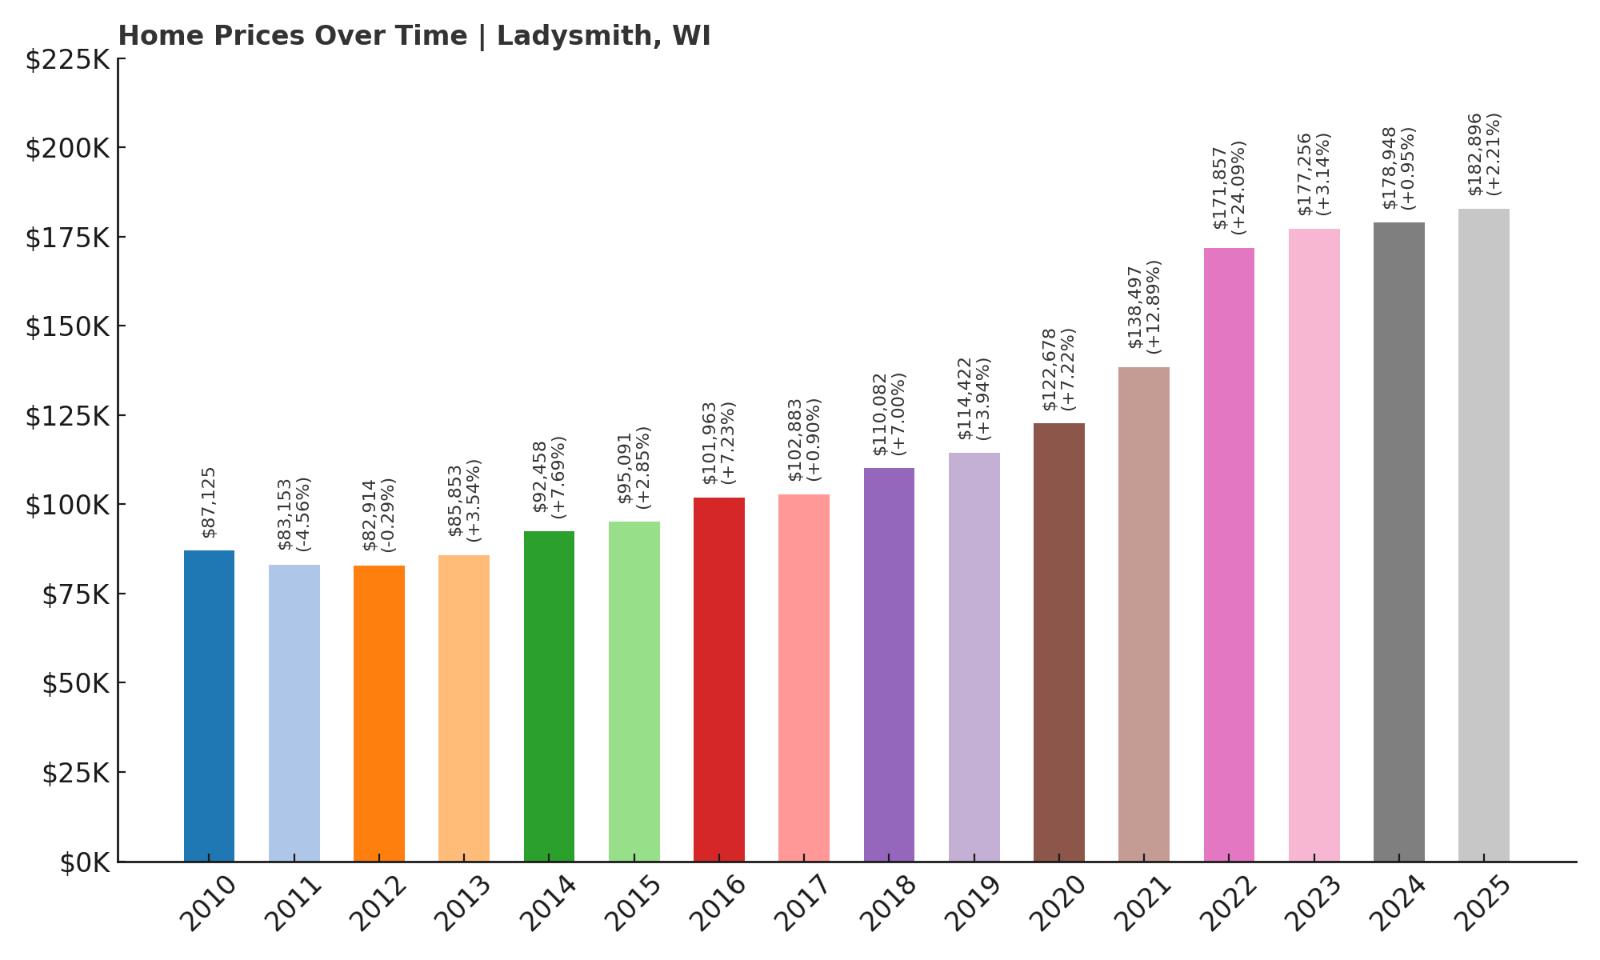
- 2010: $87,125
- 2011: $83,153 (-$3,972, -4.56% from previous year)
- 2012: $82,914 (-$239, -0.29% from previous year)
- 2013: $85,853 (+$2,939, +3.54% from previous year)
- 2014: $92,458 (+$6,605, +7.69% from previous year)
- 2015: $95,091 (+$2,633, +2.85% from previous year)
- 2016: $101,963 (+$6,872, +7.23% from previous year)
- 2017: $102,883 (+$920, +0.90% from previous year)
- 2018: $110,082 (+$7,199, +7.00% from previous year)
- 2019: $114,422 (+$4,340, +3.94% from previous year)
- 2020: $122,678 (+$8,256, +7.22% from previous year)
- 2021: $138,497 (+$15,818, +12.89% from previous year)
- 2022: $171,857 (+$33,360, +24.09% from previous year)
- 2023: $177,256 (+$5,399, +3.14% from previous year)
- 2024: $178,948 (+$1,692, +0.95% from previous year)
- 2025: $182,896 (+$3,948, +2.21% from previous year)
Ladysmith’s home values have more than doubled over the past 15 years. After a slow start in the early 2010s, the market picked up momentum from 2014 onward. The standout year was 2022, when prices jumped by over 24%—the single largest increase in any year for the town. Since then, growth has stabilized, with 2025 prices hovering around $182,896. That’s more than a 110% jump since 2010, putting it squarely in the affordable but appreciating category.
Ladysmith – An Affordable Market With Steady Demand
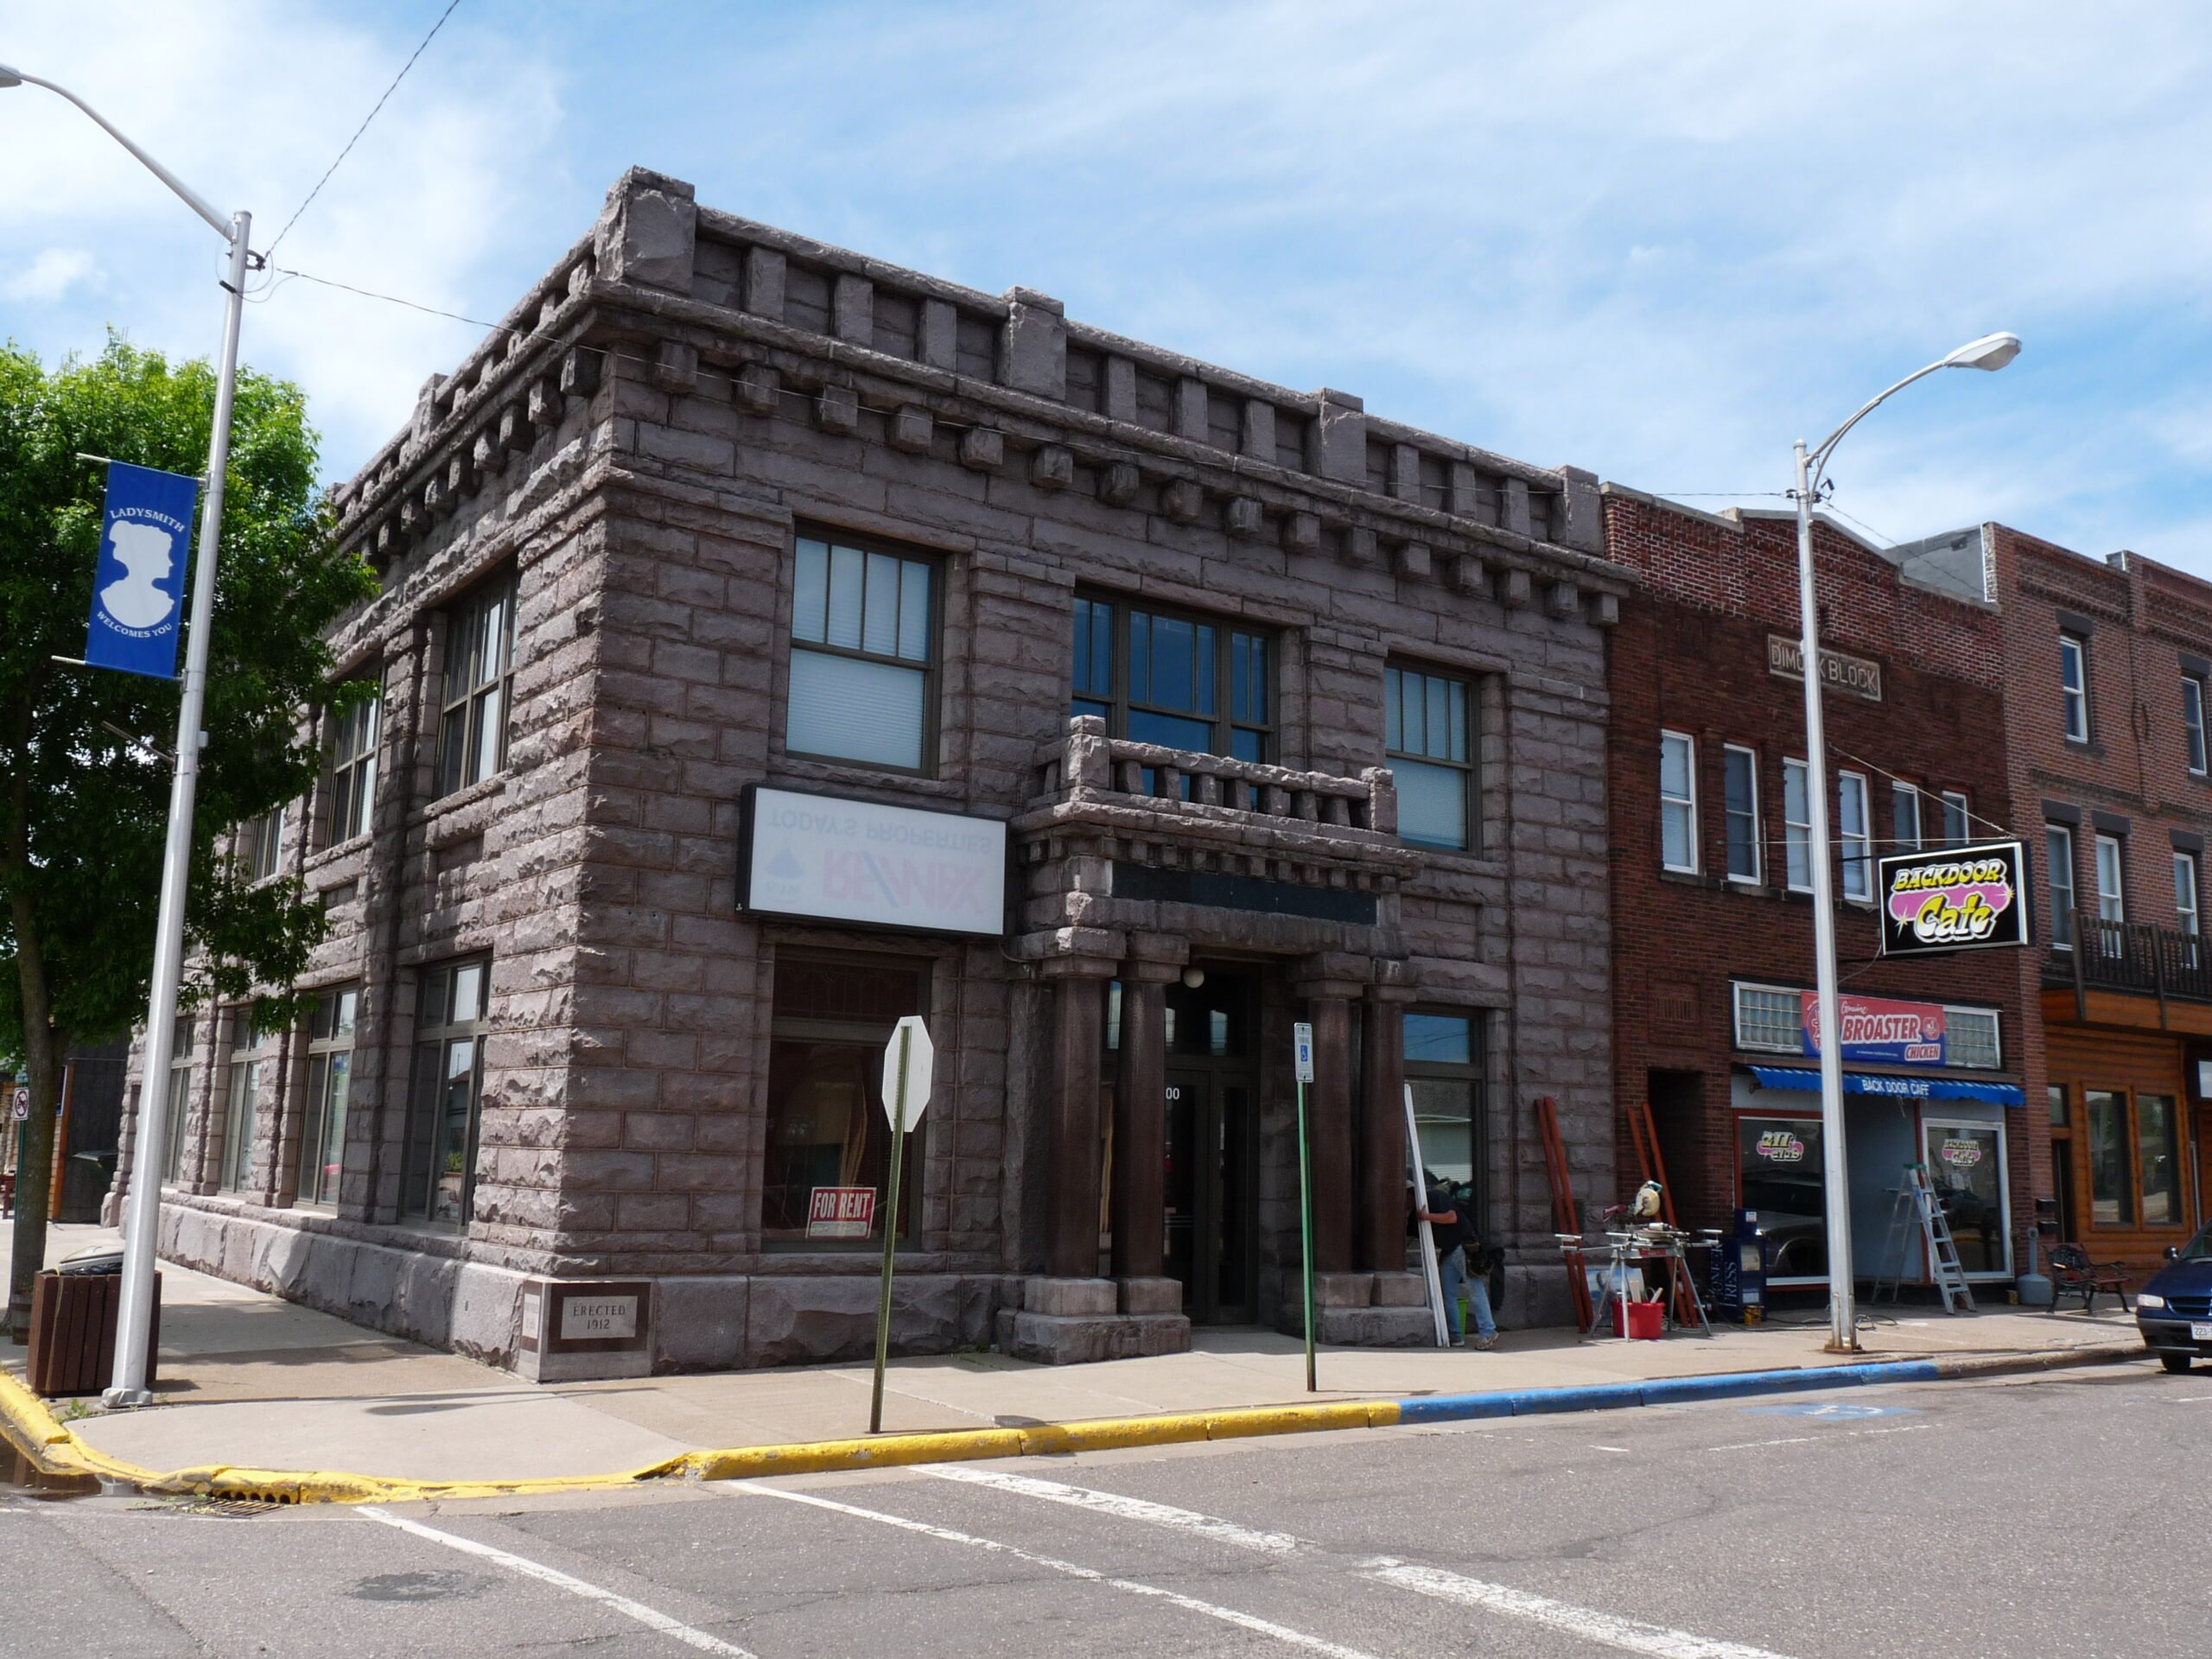
Located in Rusk County along the Flambeau River, Ladysmith blends affordability with charm. It offers a walkable downtown, riverfront parks, and access to fishing and kayaking that keep residents connected to the outdoors. Community amenities include schools, a hospital, and small businesses that support local life without the need to travel far. It’s a town that’s easy to live in and surprisingly scenic.
Ladysmith’s housing market reflects this appeal. After a brief slump in the early 2010s, home values began to recover and have risen steadily ever since. The explosive growth in 2022 shows how quickly demand can shift, but even with that leap, homes remain affordable by state standards. It’s a great fit for buyers looking for value in a town that has kept its character intact while slowly growing.
18. Niagara – 103% Home Price Increase Since May 2010
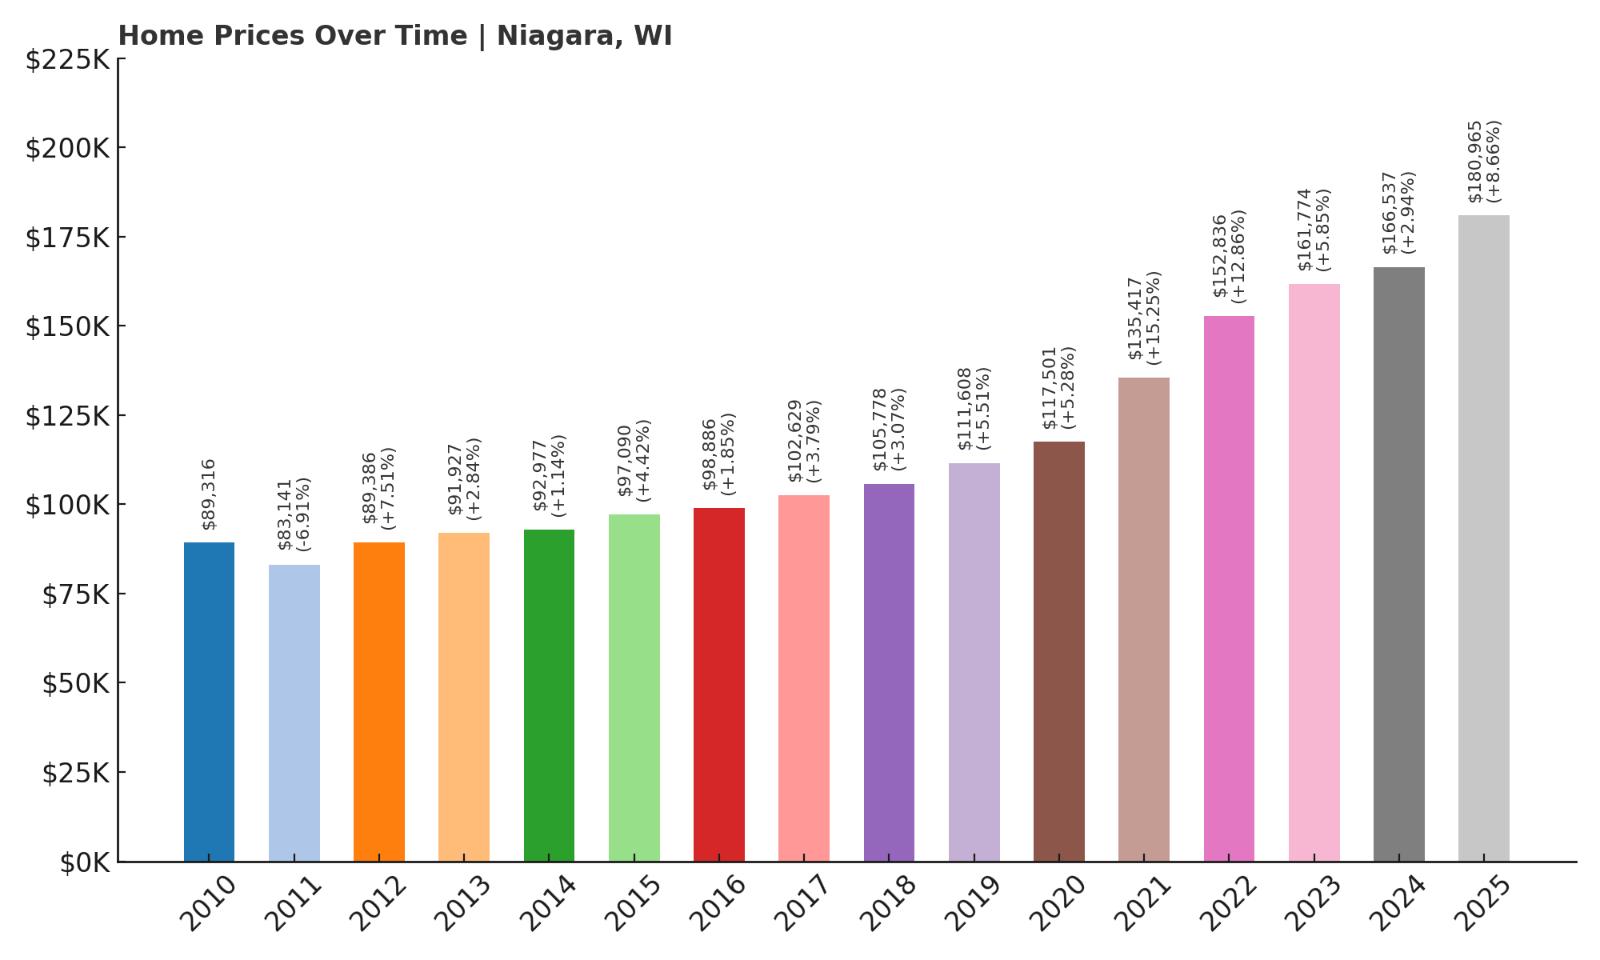
- 2010: $89,316
- 2011: $83,141 (-$6,175, -6.91% from previous year)
- 2012: $89,386 (+$6,246, +7.51% from previous year)
- 2013: $91,927 (+$2,541, +2.84% from previous year)
- 2014: $92,977 (+$1,049, +1.14% from previous year)
- 2015: $97,090 (+$4,114, +4.42% from previous year)
- 2016: $98,886 (+$1,795, +1.85% from previous year)
- 2017: $102,629 (+$3,743, +3.79% from previous year)
- 2018: $105,778 (+$3,149, +3.07% from previous year)
- 2019: $111,608 (+$5,830, +5.51% from previous year)
- 2020: $117,501 (+$5,893, +5.28% from previous year)
- 2021: $135,417 (+$17,916, +15.25% from previous year)
- 2022: $152,836 (+$17,419, +12.86% from previous year)
- 2023: $161,774 (+$8,938, +5.85% from previous year)
- 2024: $166,537 (+$4,762, +2.94% from previous year)
- 2025: $180,965 (+$14,428, +8.66% from previous year)
Niagara’s housing market has shown consistent upward momentum, with prices more than doubling since 2010. Despite a minor dip in 2011, values rebounded quickly and climbed nearly every year thereafter. By 2025, the average home price reached $180,965, up from under $90,000 just 15 years ago. A particularly sharp climb came in 2021 and 2022, signaling increased demand and economic activity in the area.
✅ Hotel #1
✅ Hotel #2
✅ Hotel #3
AN-APP-MAR19.jpg” alt=”Get pre-approved for home equity loan” width=”1628″ height=”742″>
Niagara – Quiet Growth Near the Michigan Border

Nestled in northern Marinette County near the Michigan border, Niagara offers a peaceful setting with proximity to nature and outdoor recreation. The town benefits from its scenic location along the Menominee River and easy access to nearby Iron Mountain, Michigan. It’s a quiet place to live, popular with retirees and families looking for lower-cost housing without sacrificing small-town comfort.
Home prices here have risen gradually but reliably, especially after 2020. The sharp increases of 2021 and 2022 hint at growing interest from buyers priced out of larger regional markets. Even with those gains, Niagara still offers excellent value compared to more developed parts of the state. Its affordability, combined with natural beauty and cross-border convenience, make it an appealing choice in 2025.
17. Richland Center – 80% Home Price Increase Since May 2010
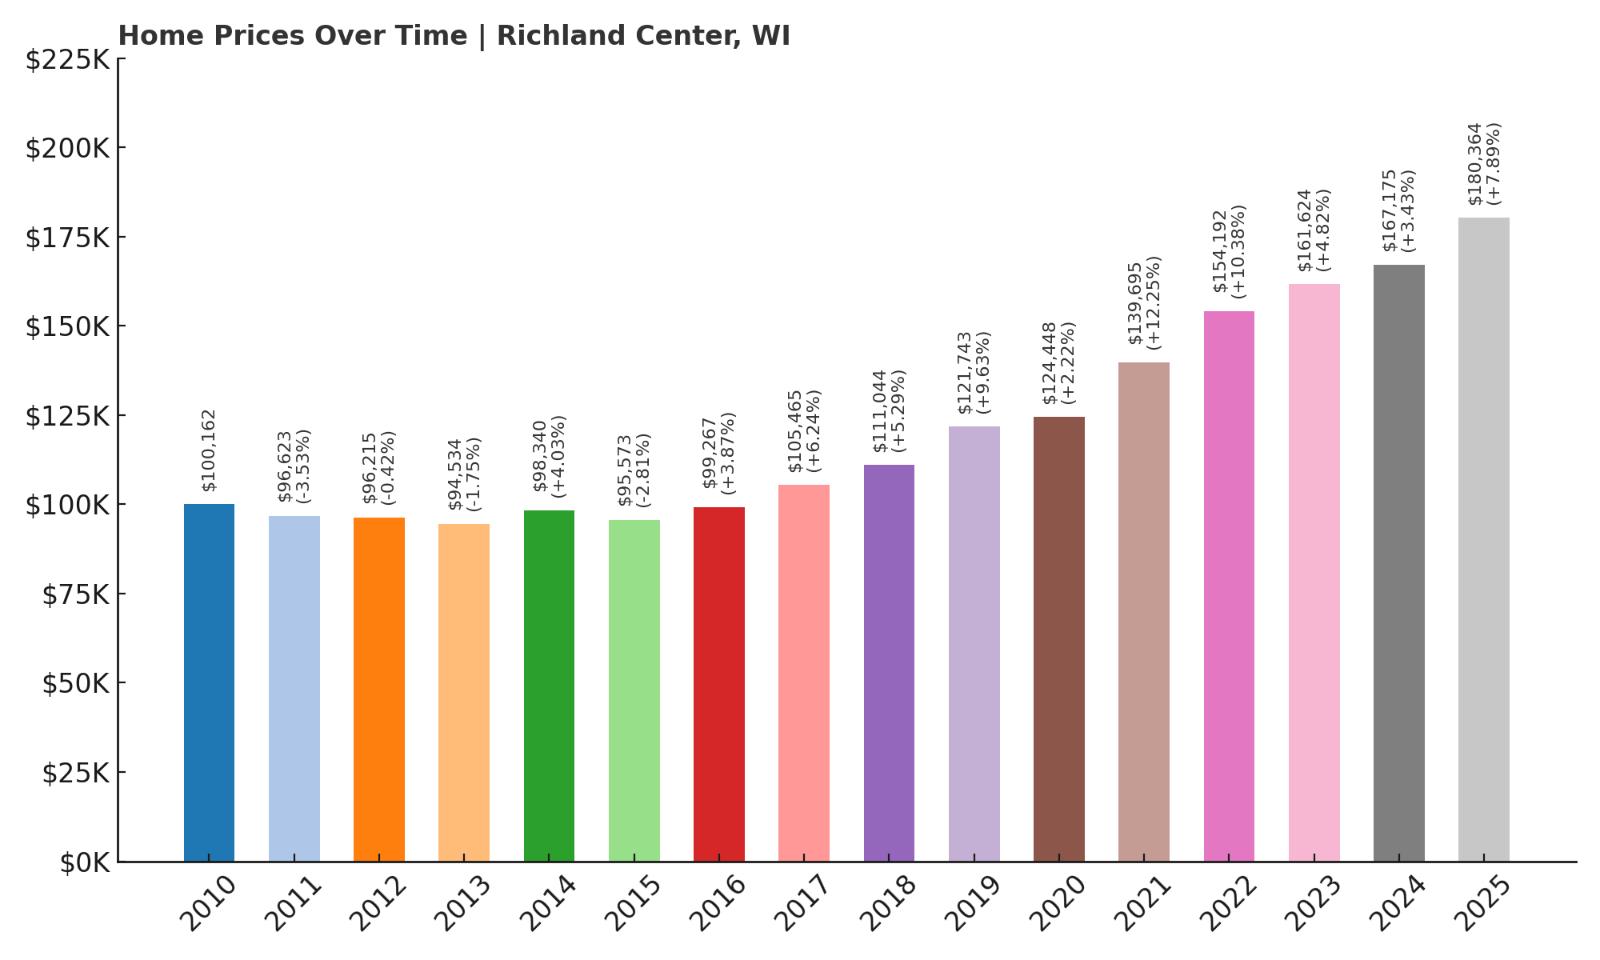
- 2010: $100,162
- 2011: $96,623 (-$3,539, -3.53% from previous year)
- 2012: $96,215 (-$408, -0.42% from previous year)
- 2013: $94,534 (-$1,680, -1.75% from previous year)
- 2014: $98,340 (+$3,805, +4.03% from previous year)
- 2015: $95,573 (-$2,767, -2.81% from previous year)
- 2016: $99,267 (+$3,694, +3.87% from previous year)
- 2017: $105,465 (+$6,198, +6.24% from previous year)
- 2018: $111,044 (+$5,579, +5.29% from previous year)
- 2019: $121,743 (+$10,699, +9.64% from previous year)
- 2020: $124,448 (+$2,705, +2.22% from previous year)
- 2021: $139,695 (+$15,247, +12.25% from previous year)
- 2022: $154,192 (+$14,497, +10.38% from previous year)
- 2023: $161,624 (+$7,431, +4.82% from previous year)
- 2024: $167,175 (+$5,551, +3.43% from previous year)
- 2025: $180,364 (+$13,189, +7.89% from previous year)
Richland Center has seen a solid and steady rise in home values, climbing 80% since 2010. The early years were slow, with small dips between 2010 and 2013, but things turned around by 2014 and prices have been trending upward ever since. Major spikes in 2021 and 2022 brought double-digit growth, reflecting a broader surge in demand across rural Wisconsin. In 2025, the average home in Richland Center costs $180,364—still far below statewide averages, but a meaningful increase from the sub-$100,000 market it had been in a decade prior. Even modest year-over-year growth in 2023 and 2024 supports the idea that this is a stable, low-volatility market for long-term buyers.
Richland Center – A Small City With Historic Appeal

Set in a scenic valley along the Pine River, Richland Center serves as the county seat of Richland County and offers more infrastructure than many other towns on this list. It has a hospital, a UW-Platteville campus, a performing arts center, and a walkable downtown filled with local shops and historic architecture. Frank Lloyd Wright fans may recognize it as the architect’s birthplace, and that connection adds a unique layer of cultural value to the area. It’s not a tourist destination, but its historical relevance and rural charm make it attractive to new residents who want more than just affordability.
The recent increases in home prices are partly due to the area’s balanced mix of services, housing availability, and location. It’s close enough to Madison for occasional commuting, but far enough to escape urban prices. For buyers looking for a mix of stability and heritage with room for appreciation, Richland Center offers excellent potential. And at under $200,000, it remains an extremely accessible option in southern Wisconsin for first-time buyers, remote workers, and retirees alike.
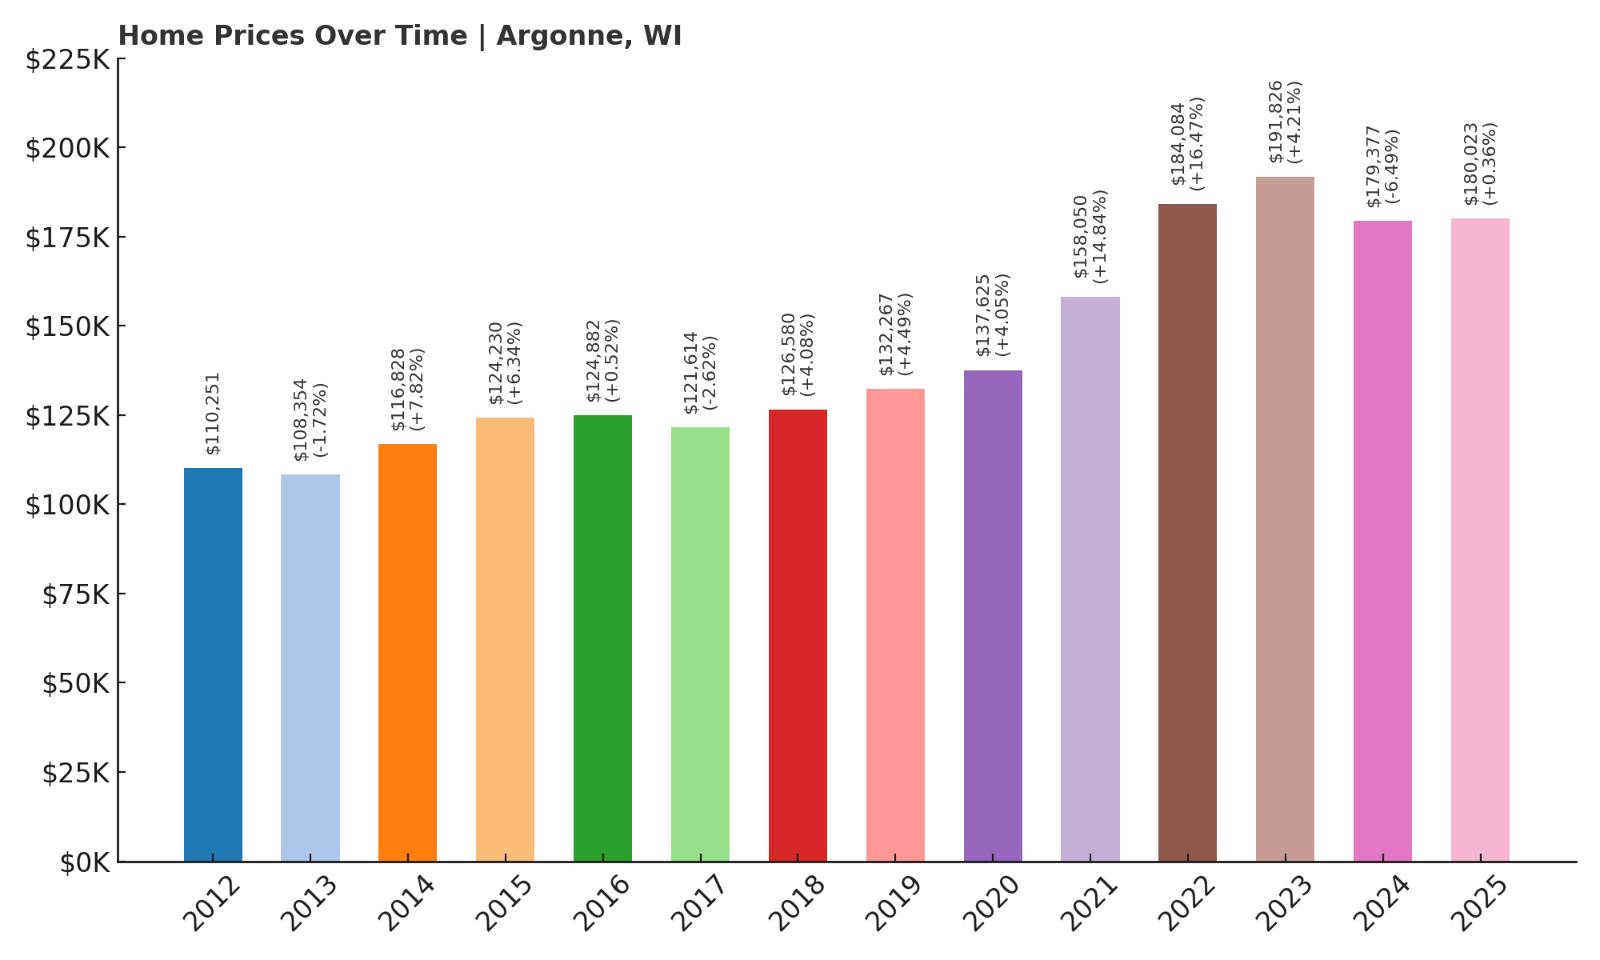
16. Argonne – 63% Home Price Increase Since May 2012
- 2010: N/A
- 2011: N/A
- 2012: $110,251
- 2013: $108,354 (-$1,897, -1.72% from previous year)
- 2014: $116,828 (+$8,474, +7.82% from previous year)
- 2015: $124,230 (+$7,402, +6.34% from previous year)
- 2016: $124,882 (+$652, +0.53% from previous year)
- 2017: $121,614 (-$3,268, -2.62% from previous year)
- 2018: $126,580 (+$4,966, +4.08% from previous year)
- 2019: $132,267 (+$5,688, +4.49% from previous year)
- 2020: $137,625 (+$5,358, +4.05% from previous year)
- 2021: $158,050 (+$20,424, +14.84% from previous year)
- 2022: $184,084 (+$26,035, +16.47% from previous year)
- 2023: $191,826 (+$7,741, +4.21% from previous year)
- 2024: $179,377 (-$12,448, -6.49% from previous year)
- 2025: $180,023 (+$646, +0.36% from previous year)
Since 2012, home prices in Argonne have grown 63%, from $110,251 to $180,023 in 2025. The price curve has seen its share of bumps—years like 2013 and 2017 posted minor declines, and 2024 marked the sharpest drop in over a decade. But over the long run, Argonne has proven resilient. A huge growth spurt between 2020 and 2022 boosted property values dramatically, adding nearly $50,000 to the average home value in just two years. Though things cooled afterward, 2025 still saw a slight uptick, suggesting that the market may be finding a new balance after rapid growth.
Argonne – Forest Living With Room to Grow

Argonne is tucked into Forest County in far northern Wisconsin, surrounded by state forest land and a quiet, rural lifestyle that’s increasingly attractive to remote workers and retirees. This tiny town doesn’t have a commercial center of its own, but its proximity to Crandon and the Chequamegon-Nicolet National Forest makes it ideal for outdoor enthusiasts. The lifestyle here is rustic and quiet, and the low density of development means residents enjoy plenty of privacy and space at prices that remain well below urban norms.
That big surge in home prices between 2020 and 2022 likely reflects a mix of pandemic-era migration and renewed interest in secluded areas. While some correction came in 2024, the long-term trend remains positive. If you’re seeking forested surroundings, fresh air, and a retreat-like quality to daily life, Argonne is a compelling value proposition. Even after its recent price run-up, homes remain well within reach for most buyers looking for something peaceful in northern Wisconsin.
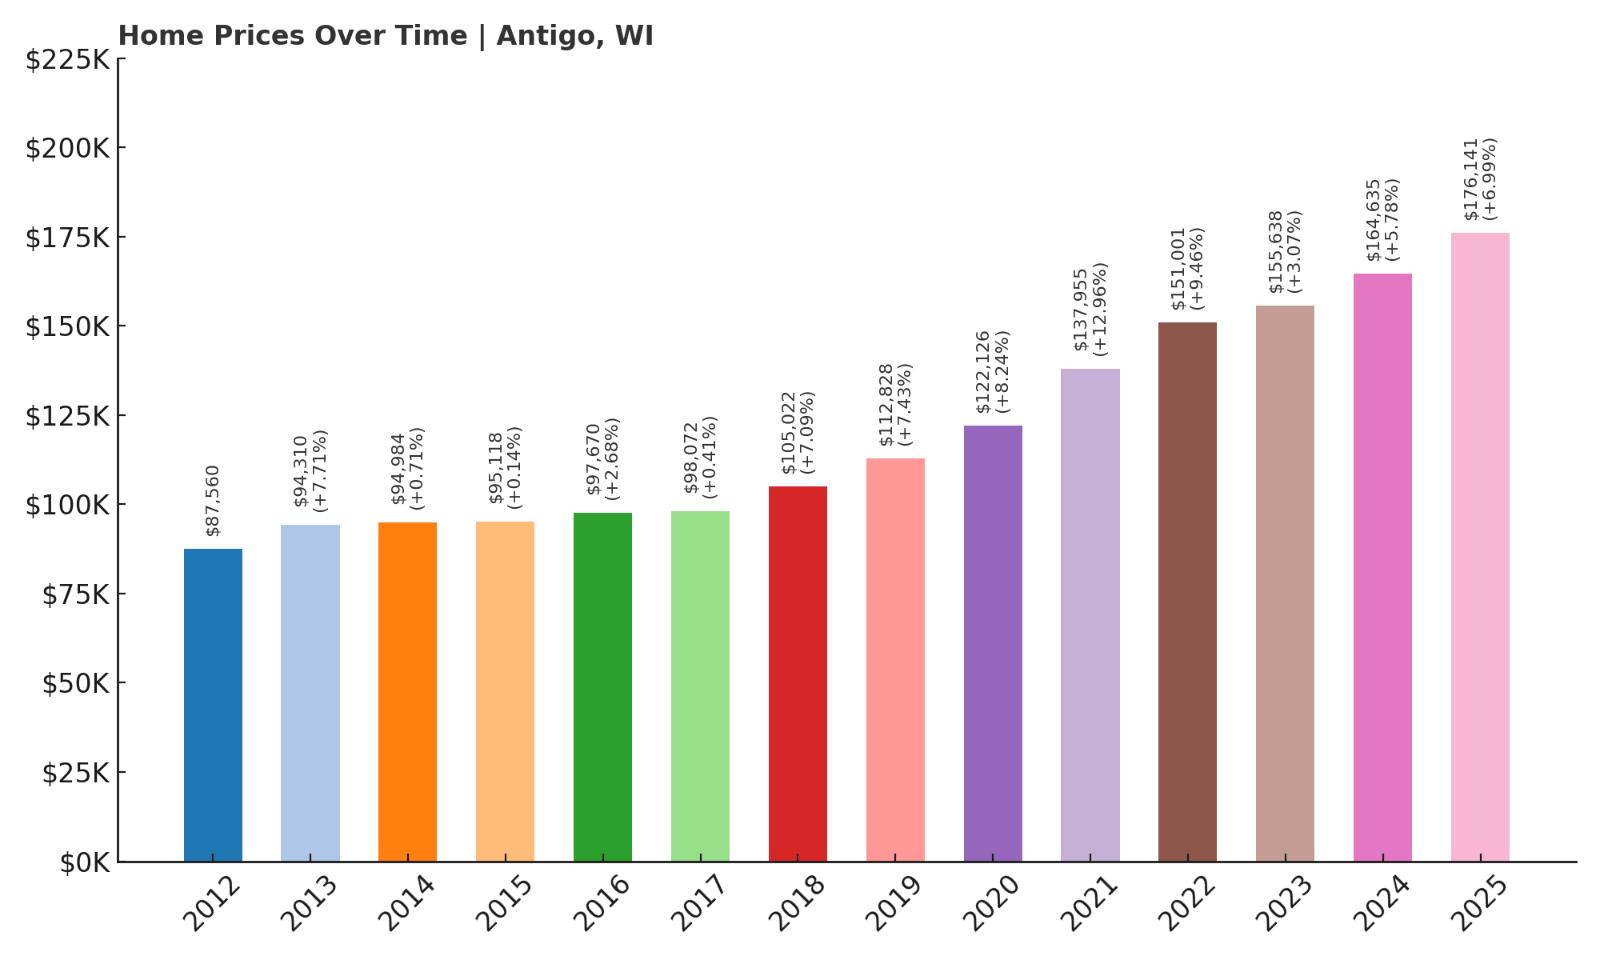
15. Antigo – 101% Home Price Increase Since May 2012
- 2010: N/A
- 2011: N/A
- 2012: $87,560
- 2013: $94,310 (+$6,750, +7.71% from previous year)
- 2014: $94,984 (+$674, +0.71% from previous year)
- 2015: $95,118 (+$133, +0.14% from previous year)
- 2016: $97,670 (+$2,552, +2.68% from previous year)
- 2017: $98,072 (+$402, +0.41% from previous year)
- 2018: $105,022 (+$6,951, +7.09% from previous year)
- 2019: $112,828 (+$7,805, +7.43% from previous year)
- 2020: $122,126 (+$9,298, +8.24% from previous year)
- 2021: $137,955 (+$15,830, +12.96% from previous year)
- 2022: $151,001 (+$13,046, +9.46% from previous year)
- 2023: $155,638 (+$4,636, +3.07% from previous year)
- 2024: $164,635 (+$8,997, +5.78% from previous year)
- 2025: $176,141 (+$11,507, +6.99% from previous year)
Antigo’s housing market has shown robust growth since 2012, with home prices rising by more than 100%. Starting at just $87,560 in 2012, values have more than doubled to reach $176,141 in 2025. Most of the early years were marked by modest gains, but that began to change in 2018 and continued through the early 2020s. Standout growth years like 2020 and 2021 saw double-digit percentage increases. Even after that acceleration, the trend has continued into 2025 with another healthy jump. Antigo’s gradual yet consistent rise suggests a dependable market without extreme volatility.
Antigo – A Well-Rounded Hub in Northern Wisconsin

As the county seat of Langlade County, Antigo offers a broader range of services than many towns on this list. It has a regional hospital, a local airport, and a public school system that serves surrounding communities. Antigo also hosts various festivals and cultural events that help foster a strong sense of local identity. It’s surrounded by farmlands, forests, and freshwater lakes, giving residents easy access to nature while still enjoying basic conveniences. For those who value both community and quiet, Antigo offers a rare balance in northern Wisconsin.
The city’s home price growth reflects this mix of amenities and rural appeal. It has steadily attracted buyers looking for affordability without sacrificing essential infrastructure. The fact that prices have more than doubled in just over a decade speaks to rising demand and improved perceptions of the area. Even with that increase, Antigo’s 2025 price tag remains accessible to many buyers who are priced out of more competitive housing markets elsewhere in the state. It’s a solid, long-term value with local character and year-round livability.
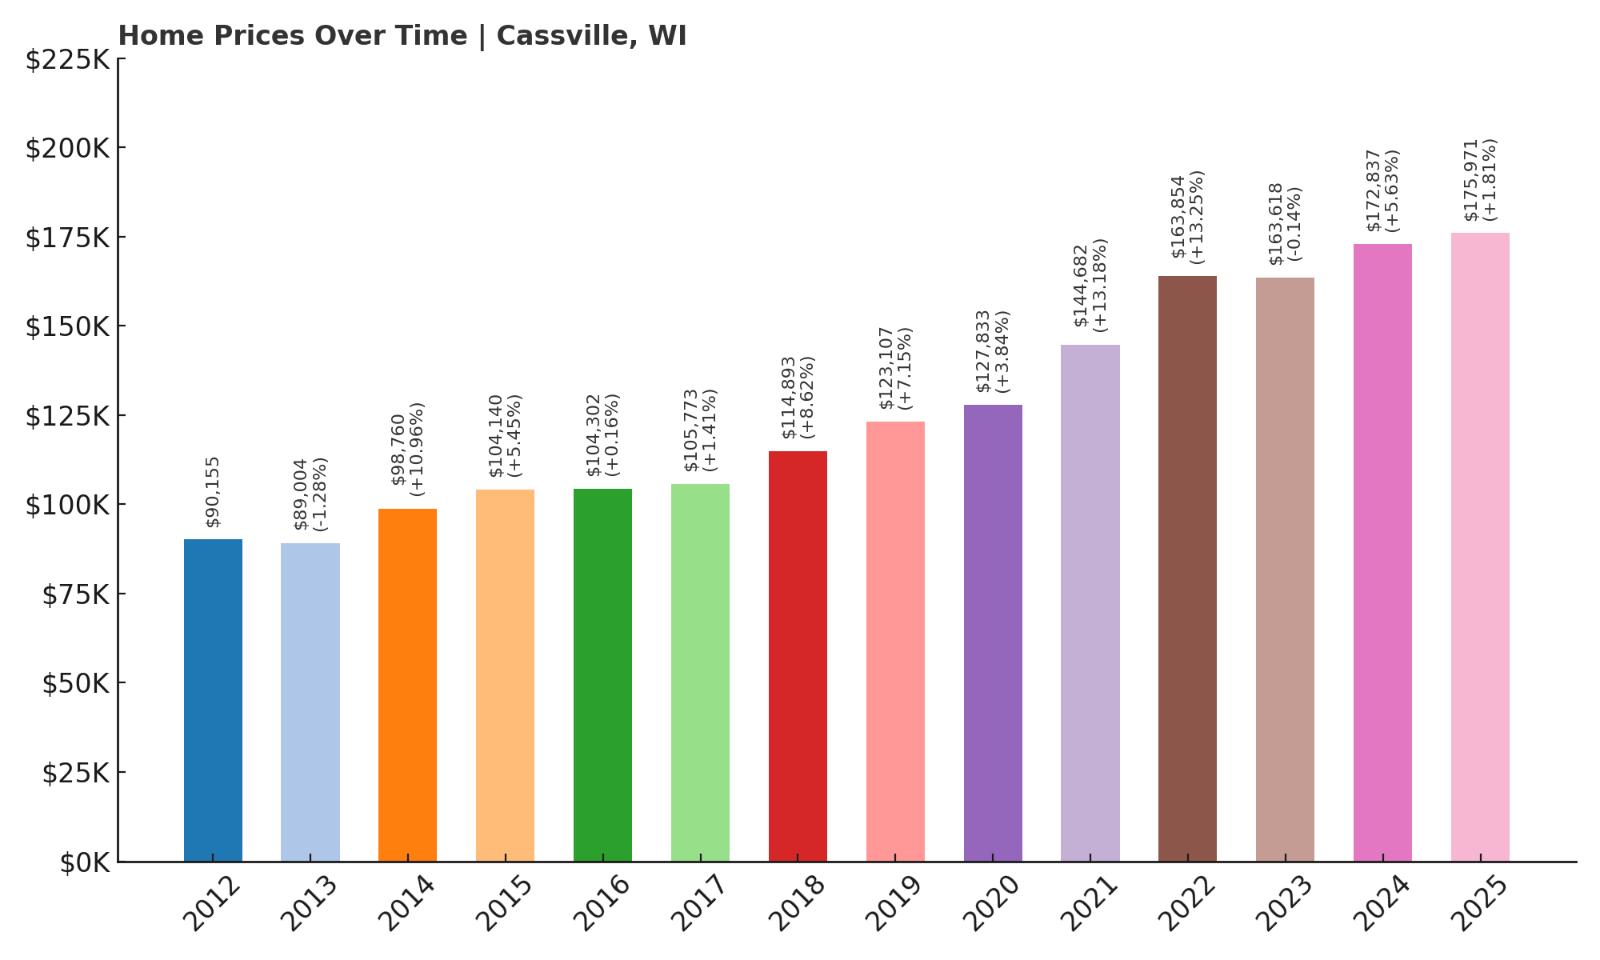
14. Cassville – 95% Home Price Increase Since May 2012
- 2010: N/A
- 2011: N/A
- 2012: $90,155
- 2013: $89,004 (-$1,151, -1.28% from previous year)
- 2014: $98,760 (+$9,756, +10.96% from previous year)
- 2015: $104,140 (+$5,381, +5.45% from previous year)
- 2016: $104,302 (+$162, +0.16% from previous year)
- 2017: $105,773 (+$1,471, +1.41% from previous year)
- 2018: $114,893 (+$9,119, +8.62% from previous year)
- 2019: $123,107 (+$8,215, +7.15% from previous year)
- 2020: $127,833 (+$4,725, +3.84% from previous year)
- 2021: $144,682 (+$16,849, +13.18% from previous year)
- 2022: $163,854 (+$19,172, +13.25% from previous year)
- 2023: $163,618 (-$237, -0.14% from previous year)
- 2024: $172,837 (+$9,219, +5.63% from previous year)
- 2025: $175,971 (+$3,134, +1.81% from previous year)
Home values in Cassville have grown nearly 95% since 2012, with the average price reaching $175,971 in 2025. The early years showed slow but steady appreciation, with noticeable growth between 2014 and 2019. Momentum picked up in 2021 and 2022 with double-digit jumps, before leveling off in recent years. Despite a flat 2023, prices rose again in 2024 and 2025, suggesting the market is holding steady. These patterns reflect buyer interest in rural towns that offer a sense of space and community at manageable prices.
Cassville – A Riverside Village With Unique Geography

Cassville is a picturesque village located along the Mississippi River in Grant County. Known for its bluffs, ferry access, and riverfront parks, the town draws people who appreciate scenic views and small-community living. It’s not densely populated, but it offers a surprising number of recreational options for its size, from boating to birdwatching. The village also features historic landmarks like Stonefield and the Governor Nelson Dewey home site, which reflect its early role in Wisconsin’s development. With natural beauty and quiet surroundings, it appeals to both permanent residents and second-home buyers.
The consistent rise in home values shows Cassville’s long-term appeal. It’s never been a fast-paced market, but the steady gains over the years reflect confidence and sustainability. The slight lull in 2023 doesn’t indicate a downturn—it’s likely just a pause following big increases in prior years. With 2025 prices still under $180,000, the town remains a good deal for buyers seeking a waterfront lifestyle without the premium cost usually tied to river towns. Cassville offers both tranquility and opportunity.
✅ Hotel #1
✅ Hotel #2
✅ Hotel #3
AN-APP-MAR19.jpg” alt=”Get pre-approved for home equity loan” width=”1628″ height=”742″>
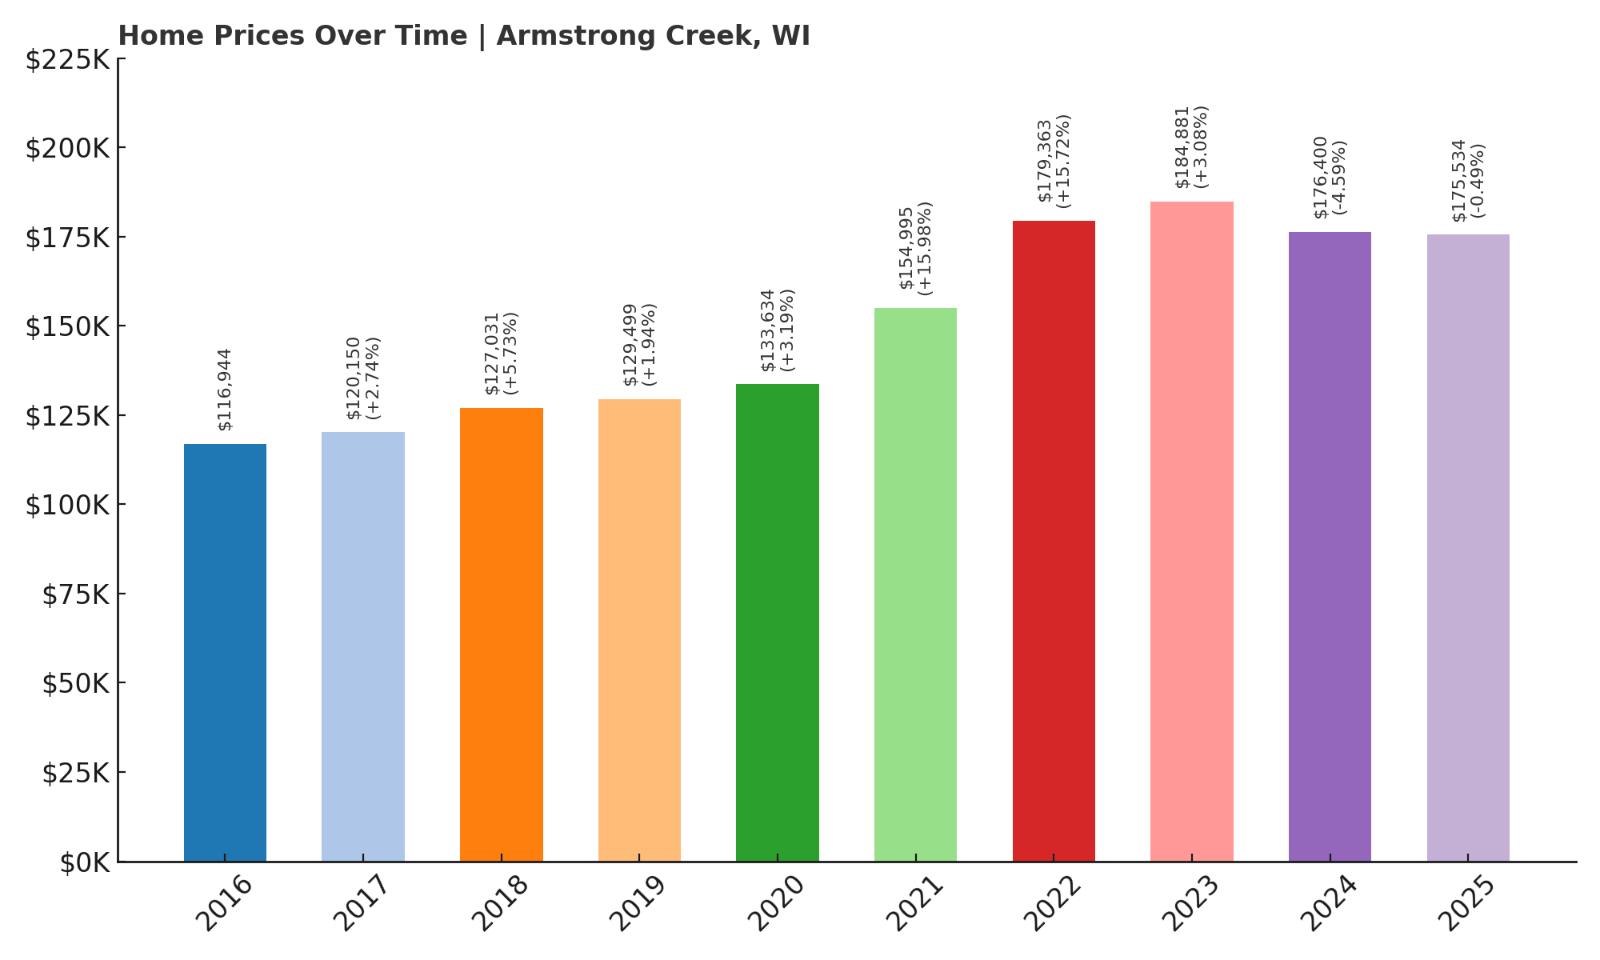
13. Armstrong Creek – 50% Home Price Increase Since May 2016
- 2010: N/A
- 2011: N/A
- 2012: N/A
- 2013: N/A
- 2014: N/A
- 2015: N/A
- 2016: $116,944
- 2017: $120,150 (+$3,205, +2.74% from previous year)
- 2018: $127,031 (+$6,881, +5.73% from previous year)
- 2019: $129,499 (+$2,469, +1.94% from previous year)
- 2020: $133,634 (+$4,135, +3.19% from previous year)
- 2021: $154,995 (+$21,361, +15.98% from previous year)
- 2022: $179,363 (+$24,369, +15.72% from previous year)
- 2023: $184,881 (+$5,518, +3.08% from previous year)
- 2024: $176,400 (-$8,481, -4.59% from previous year)
- 2025: $175,534 (-$866, -0.49% from previous year)
Armstrong Creek’s home prices have increased by 50% since 2016, starting at $116,944 and peaking just under $176,000 in recent years. The town experienced the most notable gains between 2020 and 2022, when values jumped nearly $50,000 over two years. Though prices declined slightly in 2024 and remained nearly flat in 2025, this cooling phase followed rapid appreciation. Overall, the long-term growth trend remains intact, and the 2025 value still represents a solid return over the past decade.
Armstrong Creek – Quiet Living in the Forest Region

Located in Forest County, Armstrong Creek is a quiet rural town surrounded by vast woodlands and access to outdoor recreation. It’s close to Nicolet National Forest and many ATV and snowmobile trails, making it ideal for nature lovers and seasonal residents. The community is small and tight-knit, with minimal commercial development, and that’s part of its charm. For buyers seeking privacy, space, and an off-the-grid lifestyle, this is one of the more affordable entry points in northern Wisconsin’s forest region.
The sharp rise in values during 2021–2022 likely reflects increasing demand for remote-friendly living and second homes. With many rural areas seeing increased interest during the pandemic years, Armstrong Creek saw rapid growth that has only partially reversed. Still, with home prices hovering around $175,000 in 2025, the town remains accessible to many types of buyers. Its affordability, combined with wilderness access, makes it a solid long-term bet for those wanting serenity and land without sky-high prices.
12. Pembine – 155% Home Price Increase Since May 2010
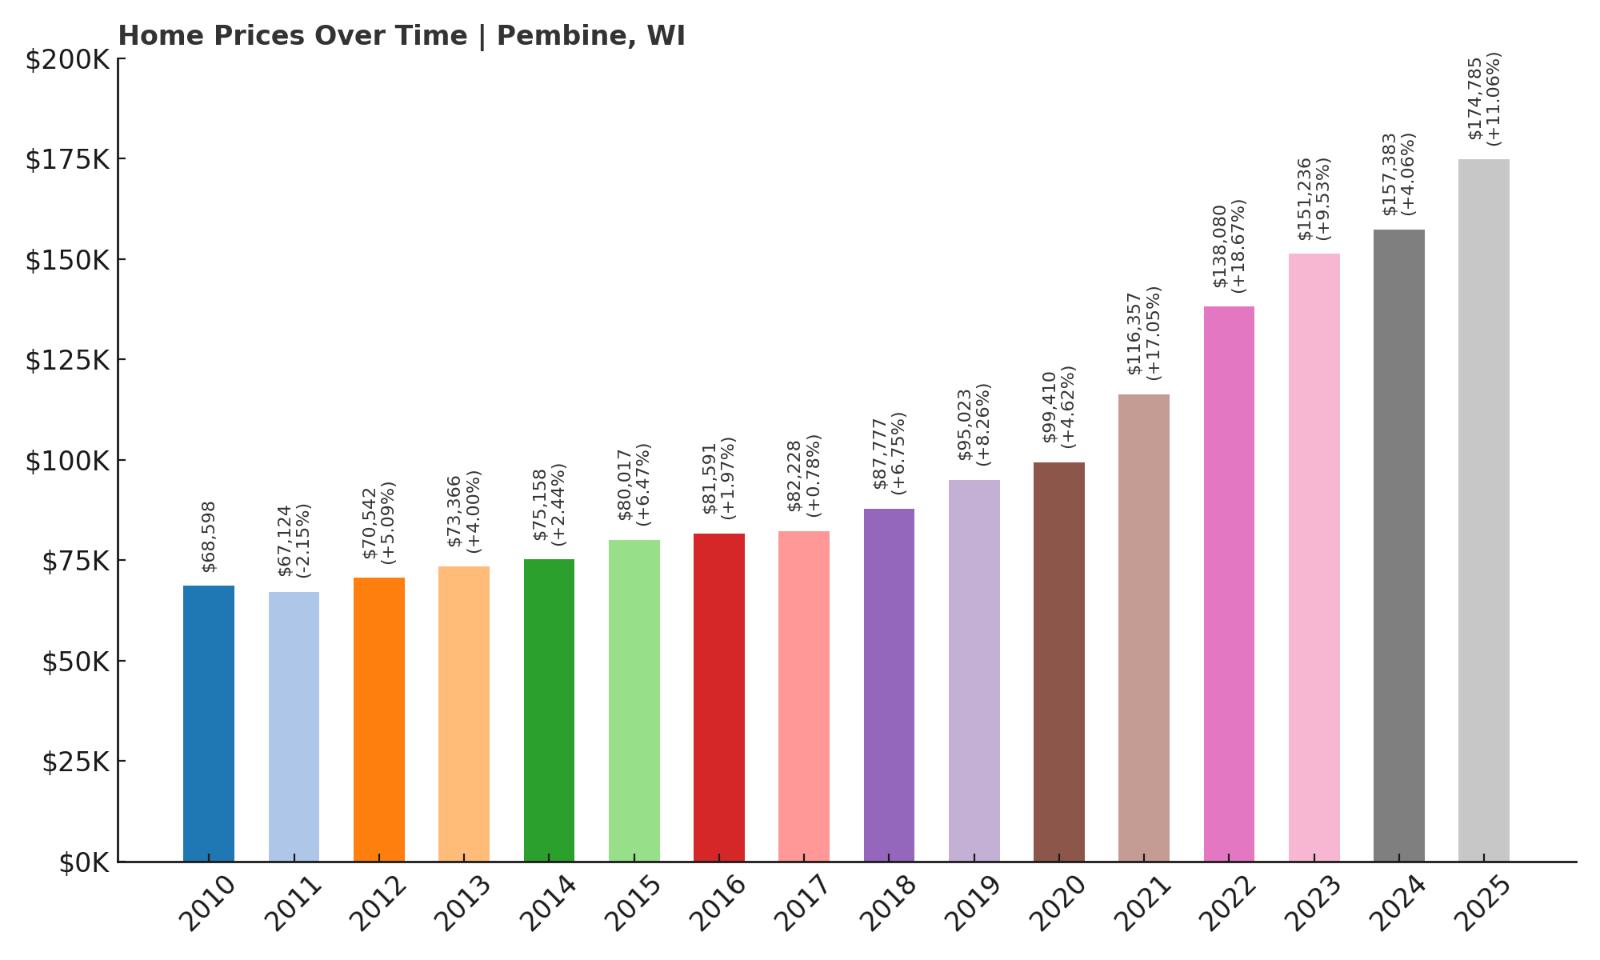
- 2010: $68,598
- 2011: $67,124 (-$1,473, -2.15% from previous year)
- 2012: $70,542 (+$3,418, +5.09% from previous year)
- 2013: $73,366 (+$2,823, +4.00% from previous year)
- 2014: $75,158 (+$1,792, +2.44% from previous year)
- 2015: $80,017 (+$4,860, +6.47% from previous year)
- 2016: $81,591 (+$1,574, +1.97% from previous year)
- 2017: $82,228 (+$637, +0.78% from previous year)
- 2018: $87,777 (+$5,549, +6.75% from previous year)
- 2019: $95,023 (+$7,245, +8.25% from previous year)
- 2020: $99,410 (+$4,387, +4.62% from previous year)
- 2021: $116,357 (+$16,947, +17.05% from previous year)
- 2022: $138,080 (+$21,723, +18.67% from previous year)
- 2023: $151,236 (+$13,157, +9.53% from previous year)
- 2024: $157,383 (+$6,147, +4.06% from previous year)
- 2025: $174,785 (+$17,402, +11.06% from previous year)
Pembine’s home prices have seen a dramatic increase of 155% since 2010, rising from a modest $68,598 to $174,785 in 2025. While the early years showed slow, steady growth, things accelerated significantly after 2020. Massive jumps of over 17% and 18% in 2021 and 2022, respectively, reflect increased demand for property in rural northern Wisconsin. Even as growth cooled slightly, prices have continued to rise, with a robust 11% gain in 2025 alone. With such consistent appreciation, Pembine has become one of the standout towns for affordability and growth in the state.
Pembine – A Northern Gateway With Big Appeal

Situated in Marinette County near the Michigan border, Pembine is a gateway to the northern wilderness and is popular among outdoor adventurers and retirees. Its proximity to rivers, lakes, and trails makes it a hub for fishing, snowmobiling, and hiking. The community is small but well connected by highway, giving it easier access to nearby services than more isolated northern towns. Residents enjoy a peaceful lifestyle with the bonus of being surrounded by nature and friendly neighbors who know one another by name.
Pembine’s striking home price growth suggests it’s no longer flying under the radar. The surge in values after 2020 likely reflects a mix of pandemic-era migration and a new appreciation for smaller towns that offer both space and affordability. Despite these sharp increases, housing remains affordable compared to the state average, making it a great option for first-time buyers, early retirees, or remote workers. The combination of outdoor access, peaceful living, and growing demand makes Pembine an increasingly attractive destination in Wisconsin’s housing landscape.
11. Clintonville – 153% Home Price Increase Since May 2010
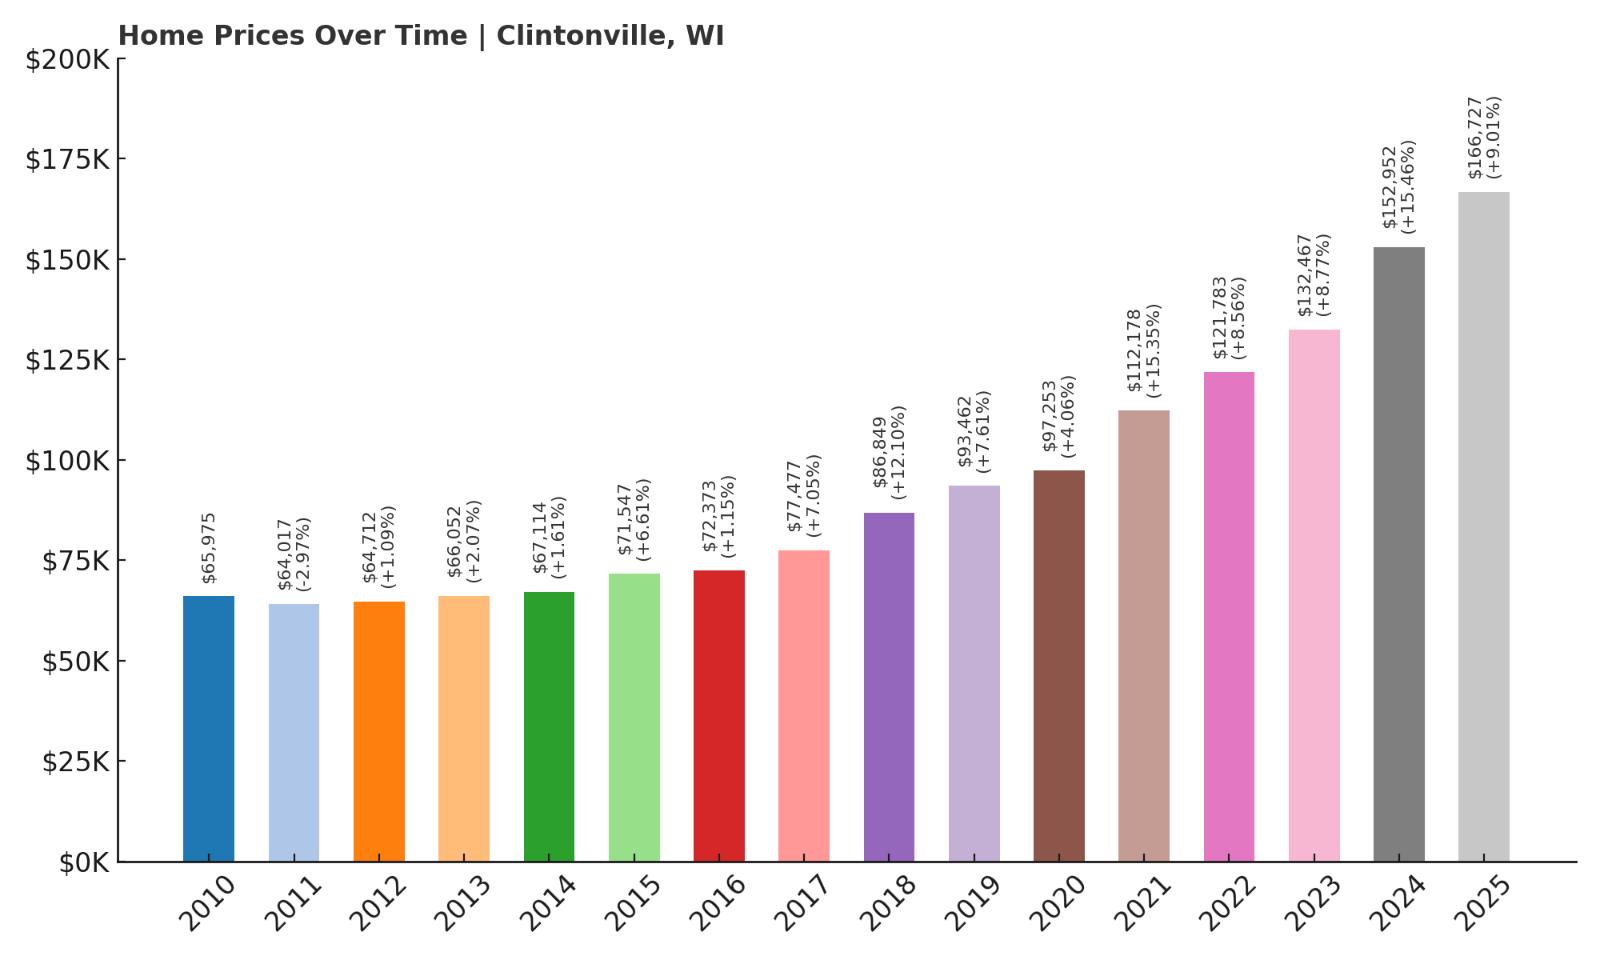
- 2010: $65,975
- 2011: $64,017 (-$1,958, -2.97% from previous year)
- 2012: $64,712 (+$695, +1.09% from previous year)
- 2013: $66,052 (+$1,340, +2.07% from previous year)
- 2014: $67,114 (+$1,062, +1.61% from previous year)
- 2015: $71,547 (+$4,432, +6.60% from previous year)
- 2016: $72,373 (+$827, +1.16% from previous year)
- 2017: $77,477 (+$5,104, +7.05% from previous year)
- 2018: $86,849 (+$9,372, +12.10% from previous year)
- 2019: $93,462 (+$6,613, +7.61% from previous year)
- 2020: $97,253 (+$3,792, +4.06% from previous year)
- 2021: $112,178 (+$14,924, +15.35% from previous year)
- 2022: $121,783 (+$9,605, +8.56% from previous year)
- 2023: $132,467 (+$10,684, +8.77% from previous year)
- 2024: $152,952 (+$20,486, +15.46% from previous year)
- 2025: $166,727 (+$13,774, +9.01% from previous year)
Clintonville’s housing market has grown by a whopping 153% since 2010, marking it as one of the fastest-appreciating affordable towns in Wisconsin. The city’s early years were slow, with gains mostly under 2% annually. But from 2015 onward, appreciation gathered momentum. By 2020, home values crossed the $100,000 mark for the first time, and they’ve surged ever since. The largest increases came between 2020 and 2024, including a massive 15.46% jump in 2024. With prices reaching $166,727 in 2025, the town is no longer as hidden as it once was—but it’s still incredibly affordable by state standards.
Clintonville – A Blue-Collar Town With Strong Roots
Located in Waupaca County, Clintonville is a small city with a long industrial history and a resilient local economy. It’s home to several manufacturing firms, including longstanding employers in the automotive and machinery sectors. The city also offers decent schools, public parks, and access to the Pigeon River, all of which make it attractive to families and workers seeking small-town stability. Clintonville’s downtown features classic Midwestern storefronts, and while the pace of life is slower here, it doesn’t lack community events or civic pride.
The town’s consistent home price growth points to strong fundamentals and increasing demand. Local jobs, decent infrastructure, and a no-frills lifestyle have helped keep the housing market active and healthy. Clintonville isn’t a resort town or tourist magnet—it’s a working town, and that’s exactly why it appeals to many buyers. You get reliability, a sense of permanence, and a home you can afford without compromise. With home values rising steadily yet still modest overall, it’s a solid choice for value-driven buyers who don’t mind a little grit alongside opportunity.
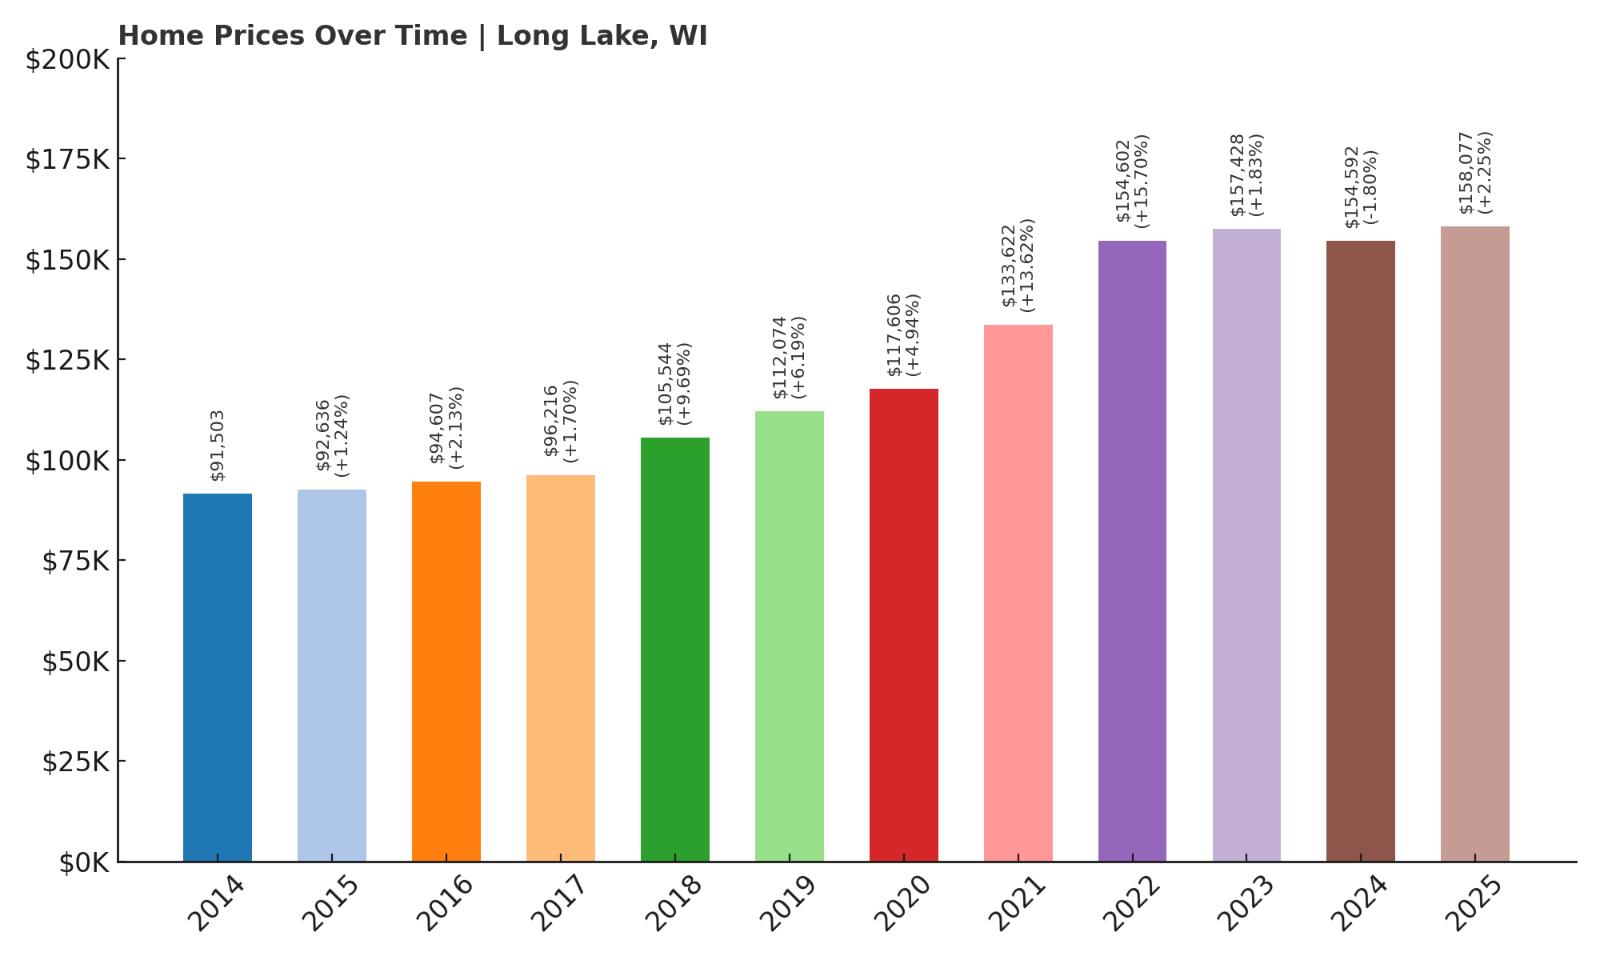
10. Long Lake – 73% Home Price Increase Since May 2014
- 2010: N/A
- 2011: N/A
- 2012: N/A
- 2013: N/A
- 2014: $91,503
- 2015: $92,636 (+$1,132, +1.24% from previous year)
- 2016: $94,607 (+$1,972, +2.13% from previous year)
- 2017: $96,216 (+$1,609, +1.70% from previous year)
- 2018: $105,544 (+$9,328, +9.69% from previous year)
- 2019: $112,074 (+$6,530, +6.19% from previous year)
- 2020: $117,606 (+$5,532, +4.94% from previous year)
- 2021: $133,622 (+$16,016, +13.62% from previous year)
- 2022: $154,602 (+$20,980, +15.70% from previous year)
- 2023: $157,428 (+$2,826, +1.83% from previous year)
- 2024: $154,592 (-$2,836, -1.80% from previous year)
- 2025: $158,077 (+$3,485, +2.25% from previous year)
Since 2014, home prices in Long Lake have grown by 73%, climbing from just over $91,000 to $158,077 in 2025. The town saw relatively steady increases in the early years, followed by a burst of growth between 2020 and 2022. Those two years alone added more than $35,000 to the average home price. A minor dip in 2024 has since been reversed with a modest rebound in 2025, showing that the market here remains fundamentally strong even after a correction. Overall, Long Lake presents a solid growth story with prices still below many urban benchmarks.
Long Lake – Scenic Seclusion With Steady Demand

Long Lake is located in Florence County near the state’s northern border, and true to its name, it’s known for its beautiful bodies of water and secluded woodland settings. The area draws nature lovers, retirees, and seasonal visitors who enjoy boating, fishing, and cabin-style living. There’s not much in the way of retail or commercial development, which is part of the draw. People come here for space, solitude, and the slow rhythm of life by the lake. That hasn’t changed, even as more buyers have discovered the region in recent years.
The surge in home prices during 2020–2022 suggests growing recognition of the town’s unique appeal. It may not offer the conveniences of larger towns, but for those seeking natural beauty and peace, Long Lake delivers. Homes remain affordable despite growth, and the combination of location, scenery, and privacy continues to attract those willing to trade urban amenities for a quieter life. With demand holding steady and room still to grow, Long Lake is well positioned as an affordable lake-country option.
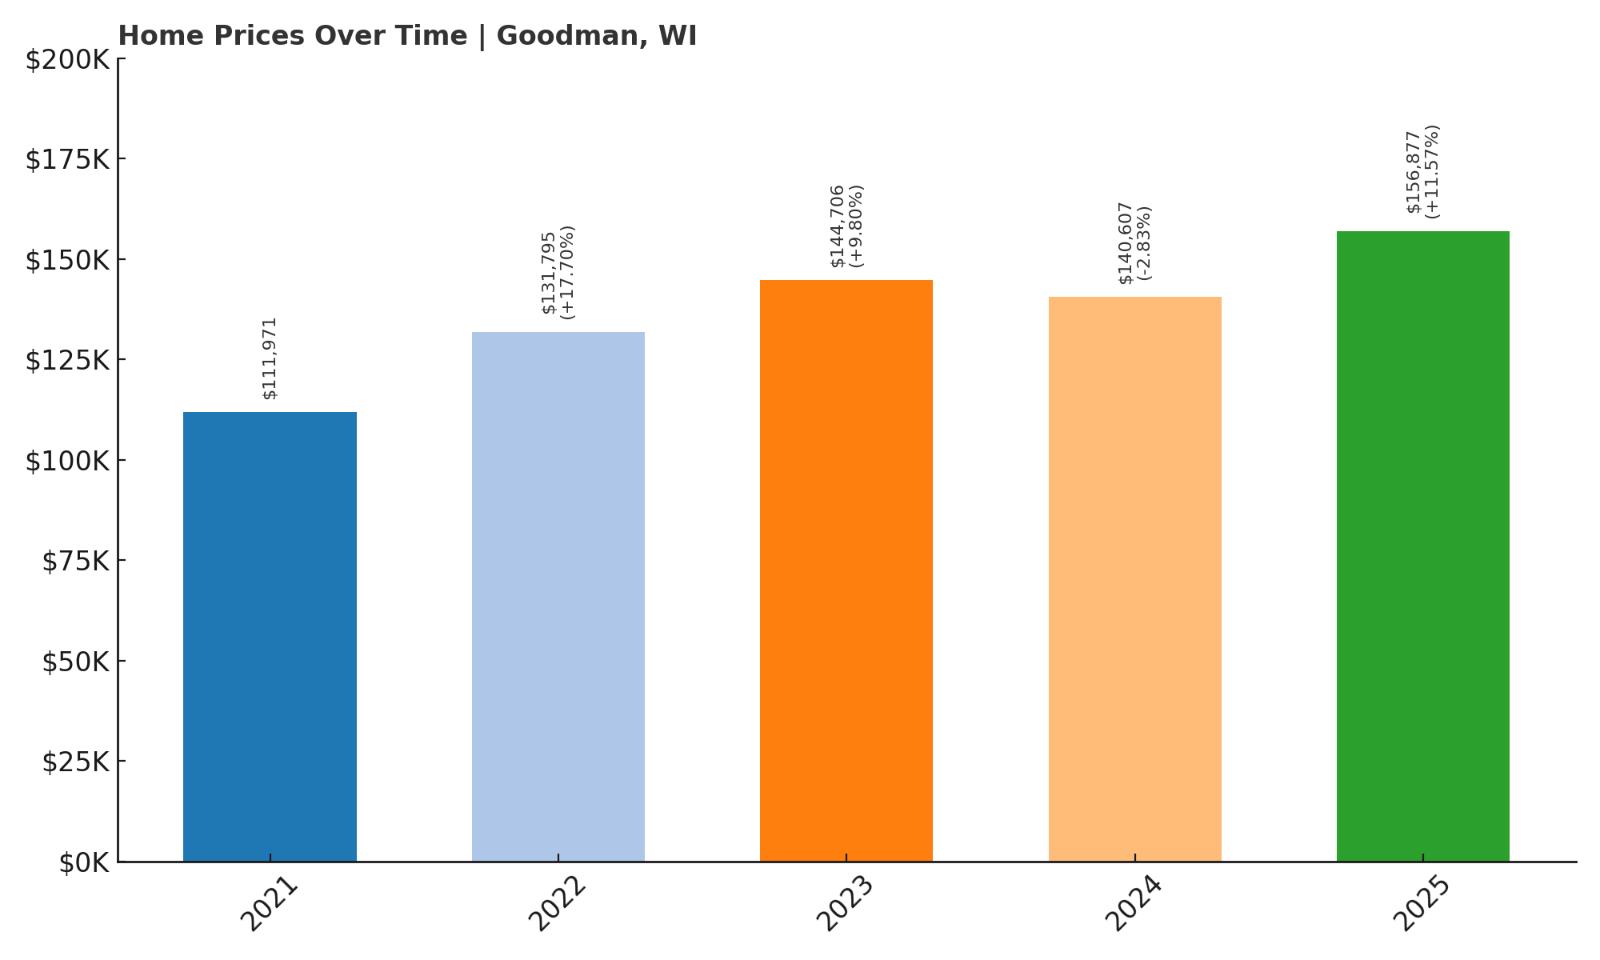
9. Goodman – 40% Home Price Increase Since May 2021
- 2010: N/A
- 2011: N/A
- 2012: N/A
- 2013: N/A
- 2014: N/A
- 2015: N/A
- 2016: N/A
- 2017: N/A
- 2018: N/A
- 2019: N/A
- 2020: N/A
- 2021: $111,971
- 2022: $131,795 (+$19,824, +17.70% from previous year)
- 2023: $144,706 (+$12,911, +9.80% from previous year)
- 2024: $140,607 (-$4,099, -2.83% from previous year)
- 2025: $156,877 (+$16,270, +11.57% from previous year)
Goodman has seen a sharp 40% increase in home prices in just four years, beginning with reliable data from 2021. The town’s average home value jumped from $111,971 to $156,877 by 2025. The growth hasn’t been perfectly linear—2024 saw a minor dip—but the rebound in 2025 was significant, with prices gaining over 11%. The largest leap came in 2022, when values rose nearly 18%, suggesting heightened interest in this remote northern location. Even with recent volatility, the upward trend is clear and offers long-term potential for buyers seeking affordable but appreciating real estate.
Goodman – Deep in the Northwoods, Rising in Demand

Located in the heart of Marinette County’s forest region, Goodman is a quiet, heavily wooded town that attracts people looking to disconnect from fast-paced city life. With easy access to hiking, hunting, and snowmobiling trails, it’s a haven for outdoor enthusiasts. Most residents live in single-family homes, and many seasonal visitors own cabins or vacation properties. The economy is modest, but the natural beauty and peaceful setting give it lasting appeal. Amenities are limited, but that’s part of the draw—Goodman is a place to escape, not to shop.
The increase in housing values may reflect this growing demand for remote living opportunities, especially since 2020. The town’s affordability compared to other Northwoods destinations also makes it attractive to buyers priced out of more developed regions. With property values still below $160,000, Goodman remains budget-friendly while offering long-term upside. For those seeking solitude, space, and simplicity, it’s one of Wisconsin’s most compelling small towns for value-seeking homeowners and retirees alike.
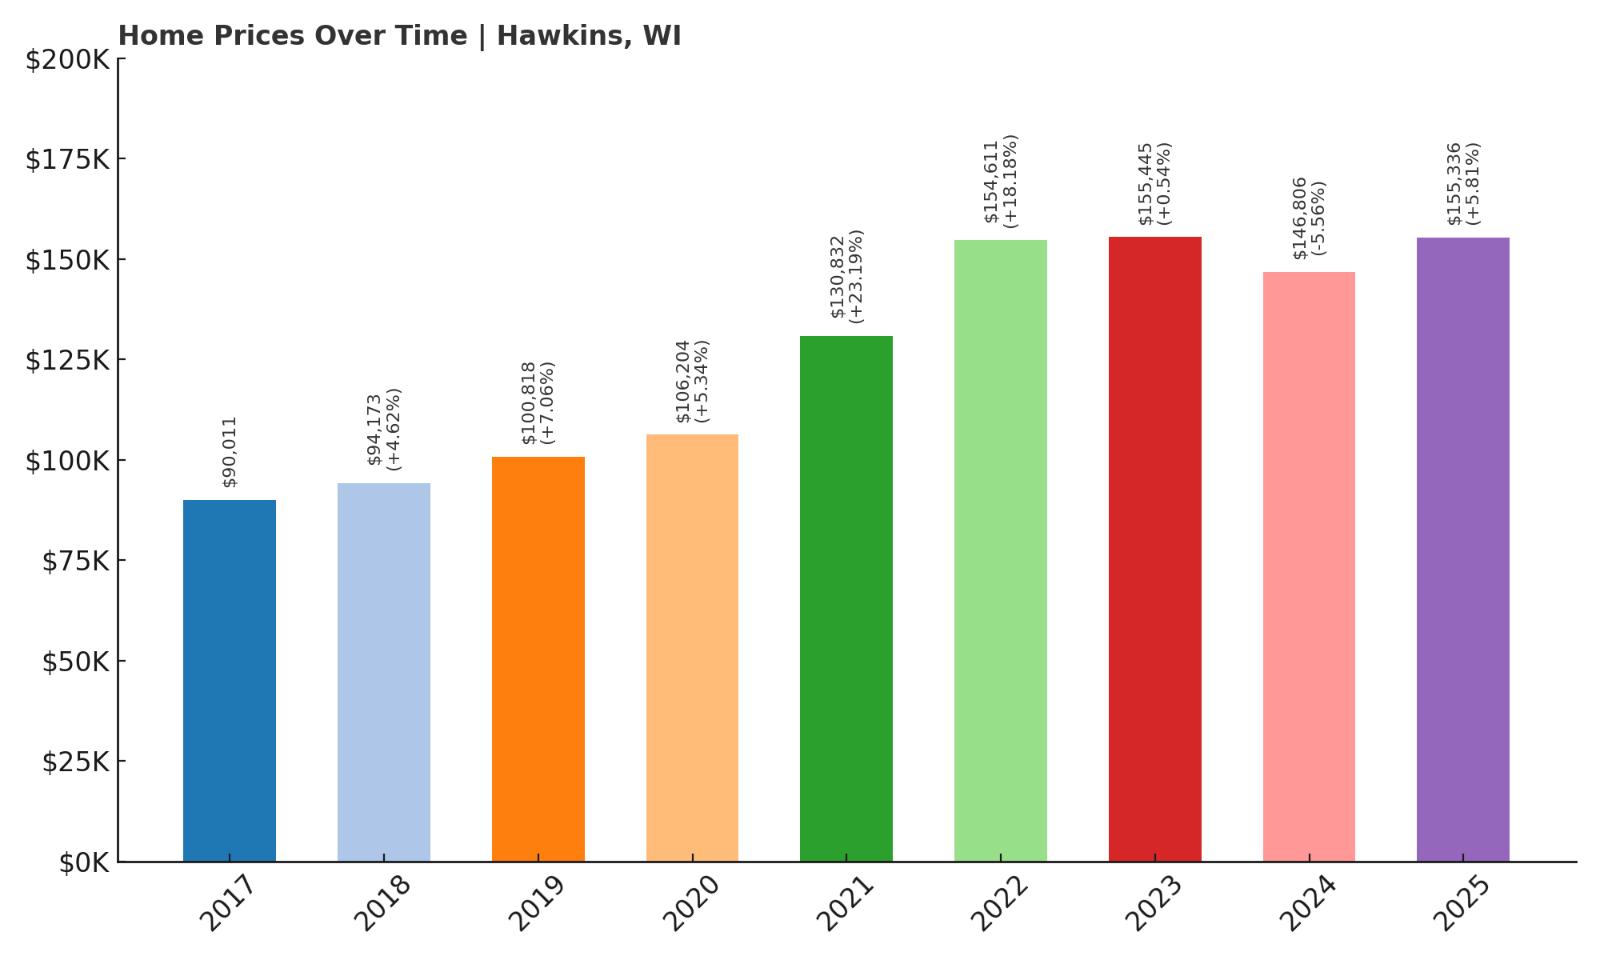
8. Hawkins – 73% Home Price Increase Since May 2017
- 2010: N/A
- 2011: N/A
- 2012: N/A
- 2013: N/A
- 2014: N/A
- 2015: N/A
- 2016: N/A
- 2017: $90,011
- 2018: $94,173 (+$4,162, +4.62% from previous year)
- 2019: $100,818 (+$6,645, +7.06% from previous year)
- 2020: $106,204 (+$5,386, +5.34% from previous year)
- 2021: $130,832 (+$24,628, +23.19% from previous year)
- 2022: $154,611 (+$23,779, +18.18% from previous year)
- 2023: $155,445 (+$834, +0.54% from previous year)
- 2024: $146,806 (-$8,639, -5.56% from previous year)
- 2025: $155,336 (+$8,530, +5.81% from previous year)
Hawkins has seen home values rise by 73% since 2017, with prices moving from $90,011 to $155,336 in 2025. The town’s most remarkable growth came in 2021 and 2022, with two consecutive years of double-digit percentage gains. These spikes account for much of the total appreciation. After a brief pause and decline in 2024, the market rebounded with a solid 5.81% increase in 2025. The pattern suggests a market that’s cooling slightly but still capable of strong performance. With values still under $160,000, Hawkins remains firmly in affordable territory.
Hawkins – A Tightly Knit Community in Nature’s Backyard

Hawkins is a small village in Rusk County, located in central Wisconsin and surrounded by forests, lakes, and rolling countryside. This rural area is ideal for people who enjoy quiet living and outdoor activities like hunting, ATV riding, and fishing. While the local economy is small, the community is tight-knit and friendly, and many residents have lived here for generations. It’s the kind of place where people wave to each other from porches, and weekend fish fries are still a thing. That sense of continuity and calm makes it attractive for retirees and families looking to put down roots.
The surge in home prices after 2020 shows that even small places like Hawkins are drawing attention as remote work and lifestyle changes reshape how people choose where to live. The big price gains in 2021–2022 likely reflect new buyers entering the market, while the 2024 dip appears to have been temporary. In 2025, a renewed rise suggests confidence in the market remains. With prices below average and quality of life high, Hawkins continues to offer value in a changing housing landscape.
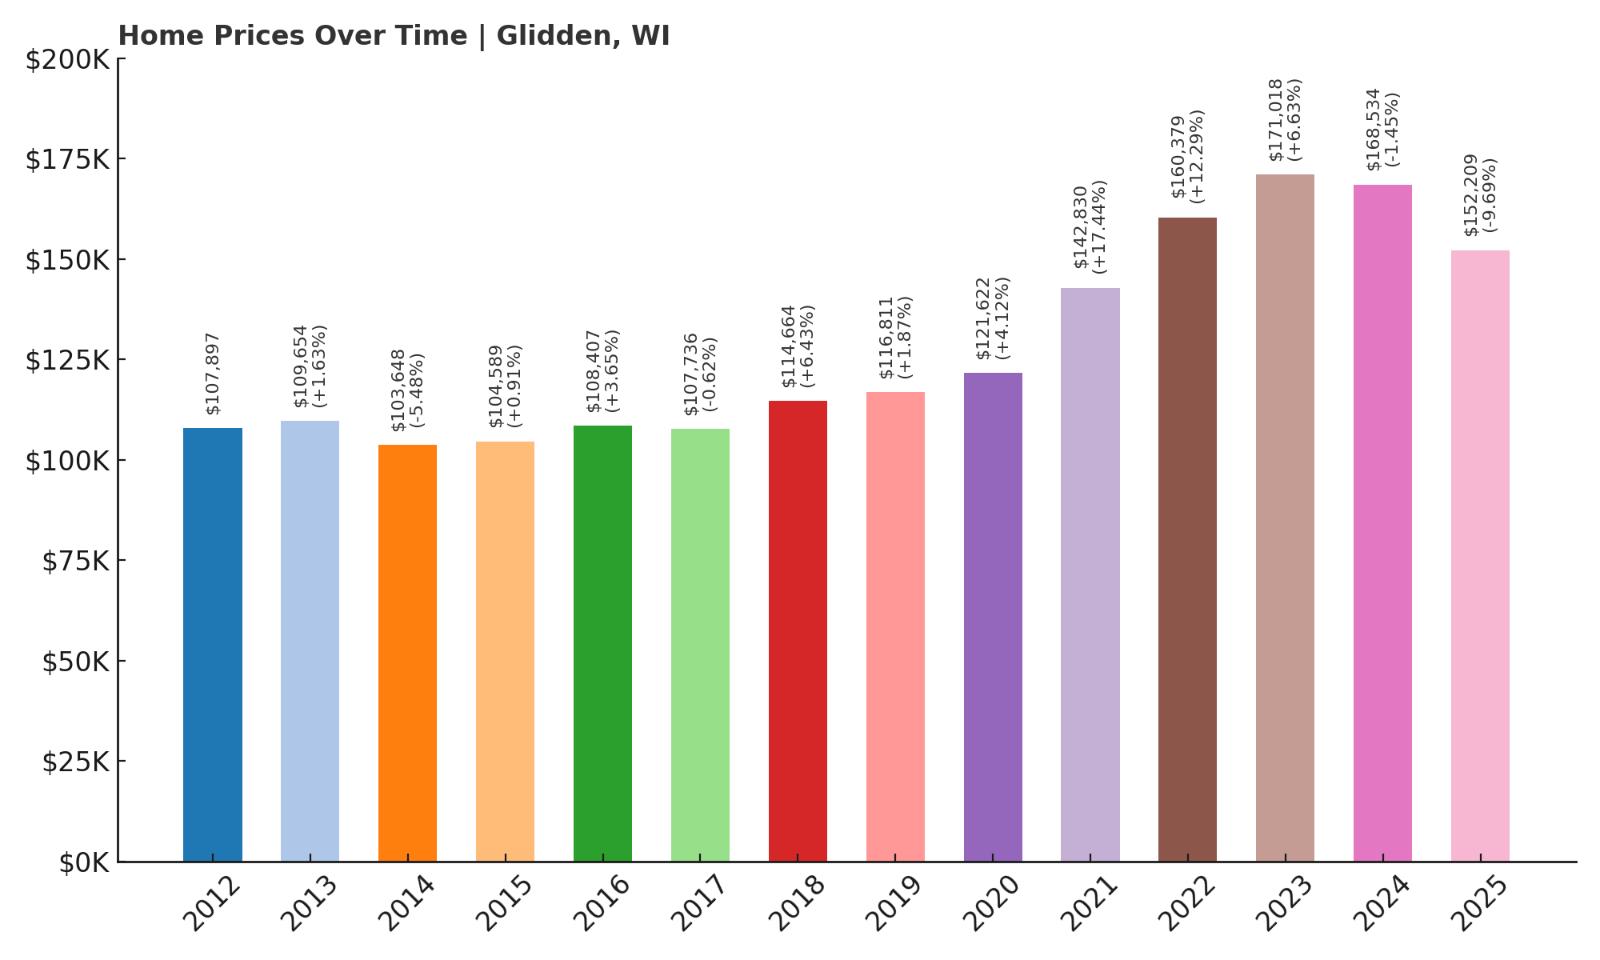
7. Glidden – 41% Home Price Increase Since May 2012
- 2010: N/A
- 2011: N/A
- 2012: $107,897
- 2013: $109,654 (+$1,757, +1.63% from previous year)
- 2014: $103,648 (-$6,006, -5.48% from previous year)
- 2015: $104,589 (+$941, +0.91% from previous year)
- 2016: $108,407 (+$3,818, +3.65% from previous year)
- 2017: $107,736 (-$671, -0.62% from previous year)
- 2018: $114,664 (+$6,928, +6.43% from previous year)
- 2019: $116,811 (+$2,147, +1.87% from previous year)
- 2020: $121,622 (+$4,811, +4.12% from previous year)
- 2021: $142,830 (+$21,208, +17.44% from previous year)
- 2022: $160,379 (+$17,548, +12.29% from previous year)
- 2023: $171,018 (+$10,639, +6.63% from previous year)
- 2024: $168,534 (-$2,483, -1.45% from previous year)
- 2025: $152,209 (-$16,325, -9.69% from previous year)
Glidden’s home prices have increased by 41% since 2012, though not without recent turbulence. After years of gradual appreciation, the town saw a major uptick from 2020 through 2023, including a massive 17.44% gain in 2021. However, back-to-back declines in 2024 and 2025 brought prices down to $152,209—still well above where they started, but a sign that momentum has slowed. While the market may be adjusting after a high-growth period, Glidden remains relatively affordable and still up significantly over the long term.
Glidden – A Hidden Corner of the Chequamegon Region

Located in Ashland County near the edge of the Chequamegon National Forest, Glidden is a small town known for its natural beauty and access to outdoor recreation. The area has long attracted hunters, anglers, and cabin owners looking for an escape into the woods. Glidden’s charm lies in its simplicity—there are no chain stores or traffic lights, just a post office, a gas station, and plenty of space to breathe. It’s quiet, remote, and unhurried, which makes it appealing to people who value privacy and self-sufficiency.
Home prices in Glidden have reflected broader trends in rural demand, especially during the post-2020 wave of interest in off-the-grid living. While recent declines may concern short-term investors, long-term homeowners are still sitting on meaningful gains. The current average price remains affordable for most buyers, especially those looking for a permanent residence or a second home near forest trails and lakes. With its natural assets and history of stable value growth, Glidden continues to be a smart pick for buyers seeking a quiet place with potential.
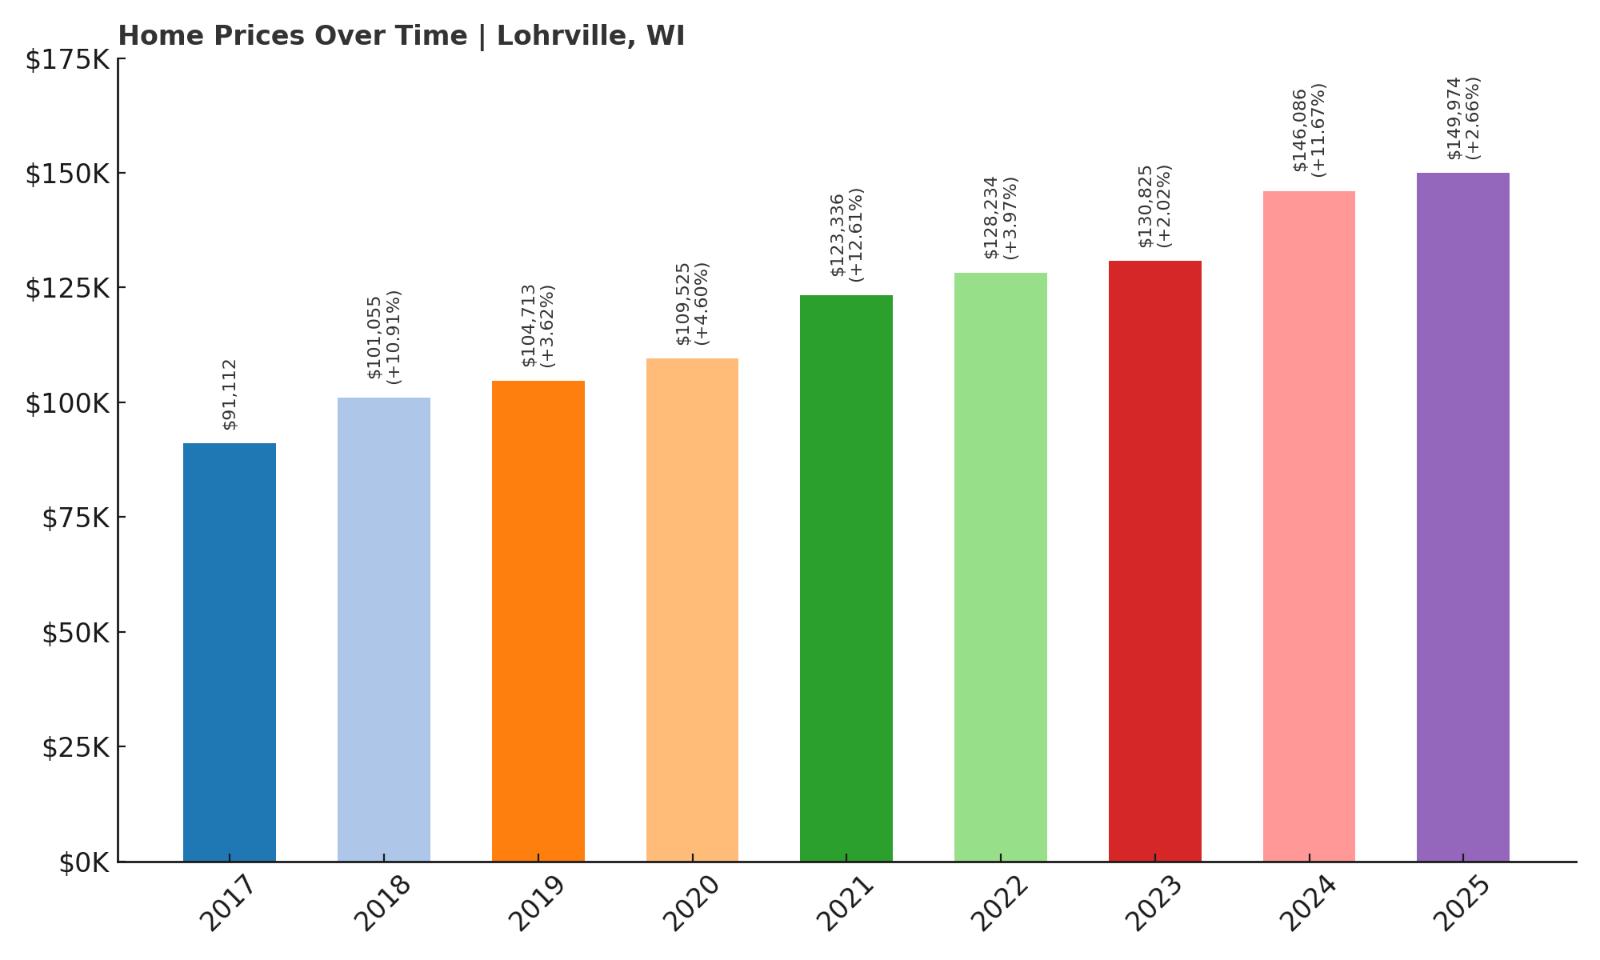
6. Lohrville – 64% Home Price Increase Since May 2017
- 2010: N/A
- 2011: N/A
- 2012: N/A
- 2013: N/A
- 2014: N/A
- 2015: N/A
- 2016: N/A
- 2017: $91,112
- 2018: $101,055 (+$9,943, +10.91% from previous year)
- 2019: $104,713 (+$3,658, +3.62% from previous year)
- 2020: $109,525 (+$4,812, +4.60% from previous year)
- 2021: $123,336 (+$13,811, +12.61% from previous year)
- 2022: $128,234 (+$4,898, +3.97% from previous year)
- 2023: $130,825 (+$2,591, +2.02% from previous year)
- 2024: $146,086 (+$15,261, +11.67% from previous year)
- 2025: $149,974 (+$3,888, +2.66% from previous year)
Since 2017, Lohrville has experienced a 64% increase in home values, climbing from $91,112 to nearly $150,000 in 2025. This growth has been driven by steady, manageable gains punctuated by stronger surges in 2018, 2021, and 2024. Even during years of smaller increases, the market never turned negative. That consistency makes Lohrville an attractive choice for buyers looking for a low-volatility housing market. The sharp 11.67% jump in 2024 signals that demand is still healthy, even if 2025’s gain of 2.66% suggests a more balanced pace moving forward.
✅ Hotel #1
✅ Hotel #2
✅ Hotel #3
AN-APP-MAR19.jpg” alt=”Get pre-approved for home equity loan” width=”1628″ height=”742″>
Lohrville – A Quiet Pocket With Growing Interest

Lohrville is a small village in Waushara County, part of central Wisconsin’s lake country. It’s a modest community with a population under 500, known more for its quiet pace of life than for any particular landmark. That low profile is part of what’s made it attractive in recent years—homebuyers are increasingly looking beyond the usual destinations for affordability and peace. Lohrville has good access to state parks, small lakes, and outdoor activities, and it’s within a short drive of larger towns like Wautoma, where additional services and shops are located.
The housing market here has followed the broader rural Wisconsin trend: modest prices, reliable growth, and a spike in demand during the pandemic era. That interest hasn’t gone away. Lohrville’s affordability is still among the best in the region, with 2025 home prices well below the state average. It’s especially suited for retirees, solo buyers, or families looking for a place where they can own a home without financial strain. With solid historical appreciation and rural charm, Lohrville offers an under-the-radar option that continues to reward patient buyers.
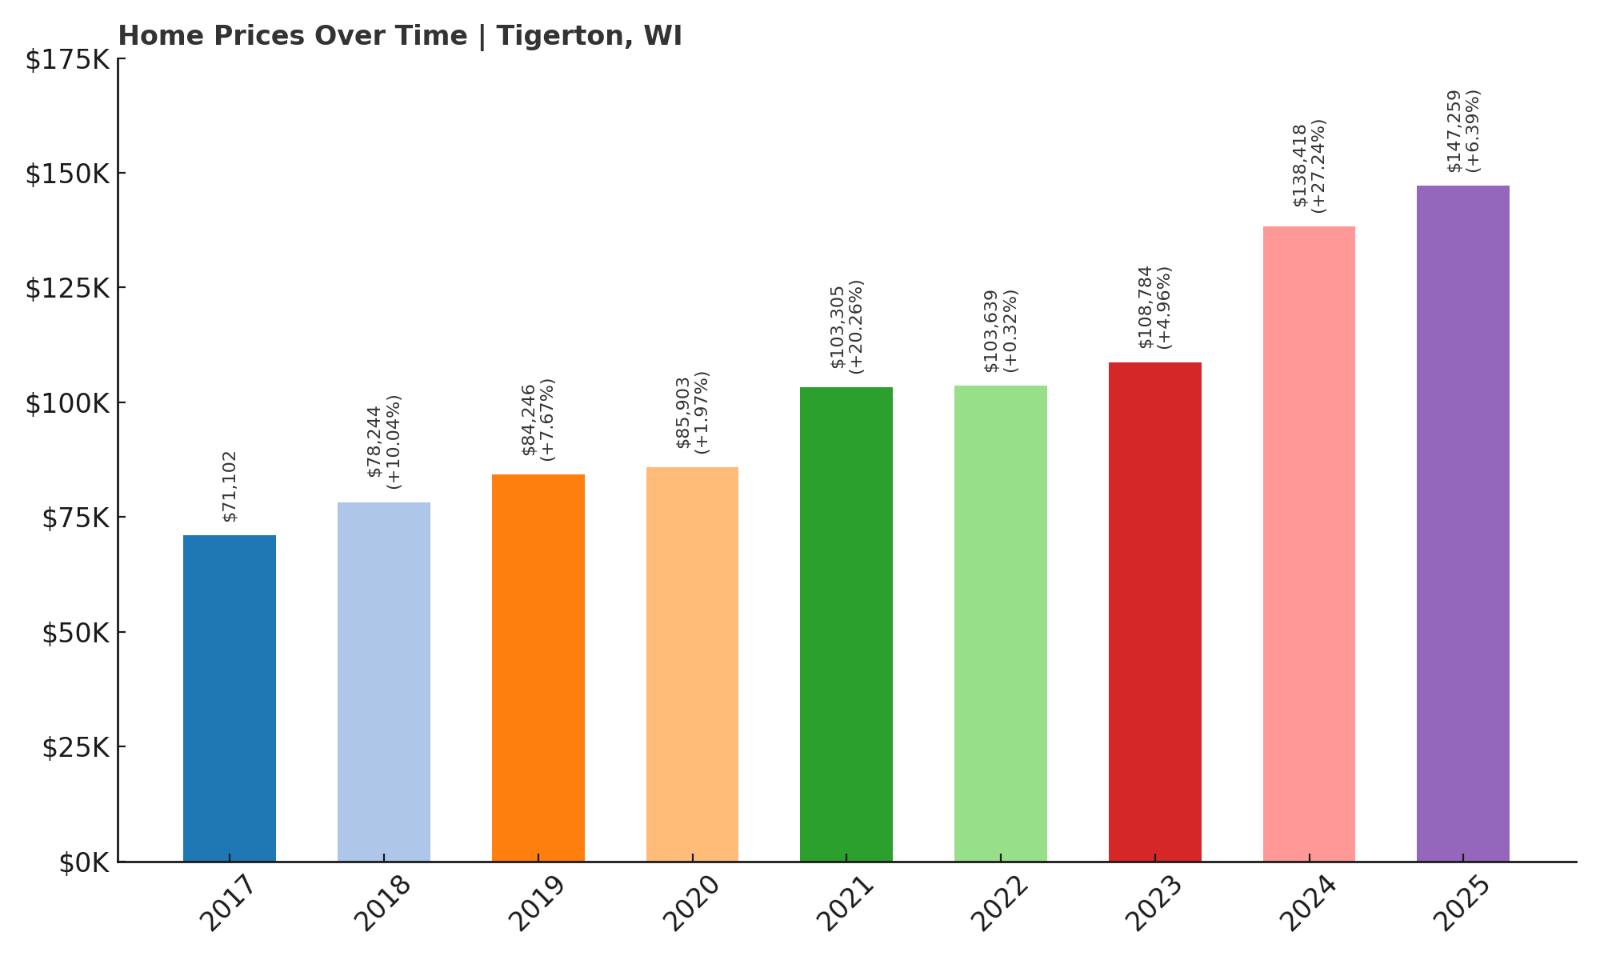
5. Tigerton – 107% Home Price Increase Since May 2017
- 2010: N/A
- 2011: N/A
- 2012: N/A
- 2013: N/A
- 2014: N/A
- 2015: N/A
- 2016: N/A
- 2017: $71,102
- 2018: $78,244 (+$7,142, +10.05% from previous year)
- 2019: $84,246 (+$6,002, +7.67% from previous year)
- 2020: $85,903 (+$1,657, +1.97% from previous year)
- 2021: $103,305 (+$17,402, +20.26% from previous year)
- 2022: $103,639 (+$334, +0.32% from previous year)
- 2023: $108,784 (+$5,145, +4.96% from previous year)
- 2024: $138,418 (+$29,634, +27.24% from previous year)
- 2025: $147,259 (+$8,841, +6.39% from previous year)
Tigerton’s home values have more than doubled since 2017, rising from $71,102 to $147,259 in 2025—a 107% increase. The town’s growth pattern includes both sharp spikes and slower, steady years. The standout year was 2024, when values jumped more than 27%, following a relatively quiet few years prior. The 2021 increase of over 20% also marked a major turning point, signaling a shift in demand. Overall, the pace may be uneven, but the trajectory is clearly upward, making Tigerton a compelling affordable town with strong appreciation potential.
Tigerton – A Village on the Rise in Shawano County

Located in Shawano County, Tigerton is a small village with a population under 800, tucked between rolling farmland and forestland. Historically known for its sawmill roots, the village has kept its rural character while welcoming a new wave of buyers in recent years. It’s close to the Embarrass River and provides a scenic backdrop for fishing, canoeing, and quiet weekend getaways. Though small in size, Tigerton has community events, parks, and a quaint downtown strip that adds to its charm. Most residents live in single-family homes with generous yard space.
Rising interest in quiet, affordable communities has clearly boosted Tigerton’s housing market. The huge price gains in 2021 and 2024 show that the town is on more buyers’ radar now, especially as home shoppers look to rural areas for lower costs and better quality of life. Yet, even with recent jumps, housing remains under $150,000 on average—a solid price point in today’s market. Tigerton’s affordability and steady growth make it a smart choice for long-term homeowners or those seeking entry-level investment properties in a stable region.
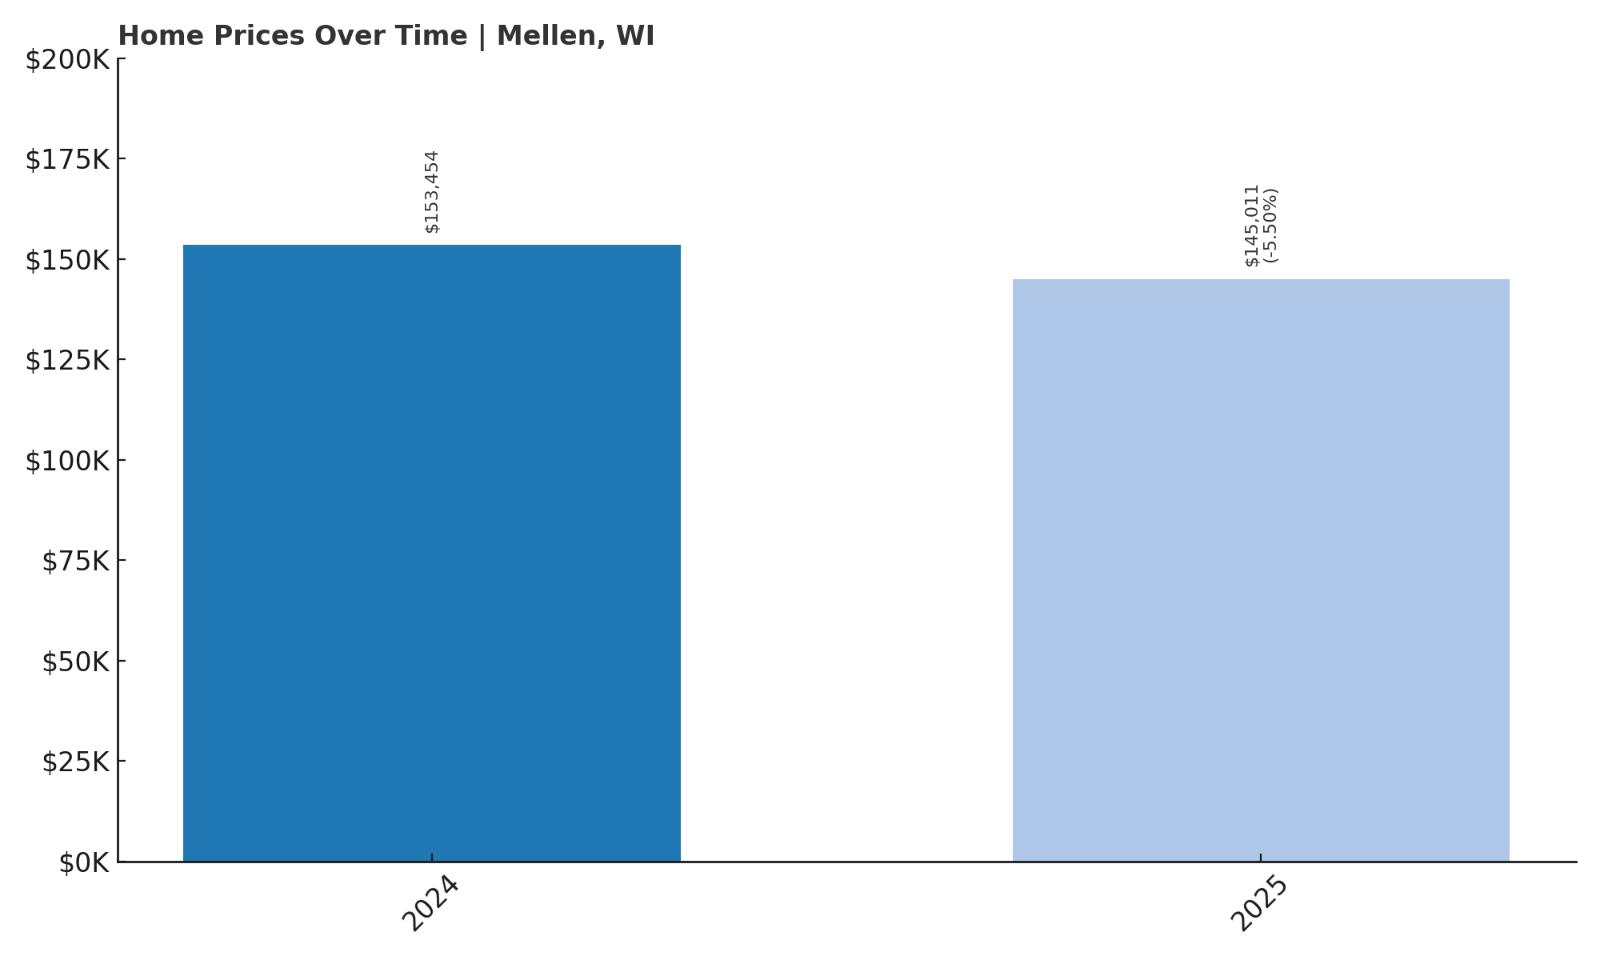
4. Mellen – −5% Home Price Decrease Since May 2024
- 2010: N/A
- 2011: N/A
- 2012: N/A
- 2013: N/A
- 2014: N/A
- 2015: N/A
- 2016: N/A
- 2017: N/A
- 2018: N/A
- 2019: N/A
- 2020: N/A
- 2021: N/A
- 2022: N/A
- 2023: N/A
- 2024: $153,454
- 2025: $145,011 (−$8,443, −5.50% from previous year)
Mellen is one of the few towns on this list to show a decline in home prices, with a drop of 5.5% from 2024 to 2025. With no available historical data prior to 2024, it’s difficult to draw conclusions about long-term trends. However, the decrease may reflect a short-term correction after an earlier surge in prices, or it could simply indicate natural volatility in a very small, rural market. At $145,011 in 2025, Mellen still falls comfortably within the affordable range compared to statewide averages. More data over time will clarify whether this dip is a blip or part of a broader trend.
Mellen – A Remote Outpost with a Unique Location
Mellen is located in Ashland County, near the southern edge of the Chequamegon National Forest and not far from Copper Falls State Park—one of Wisconsin’s most scenic natural areas. With a population under 700, it’s a town defined by its proximity to wilderness rather than commercial development. Residents here enjoy sweeping forest views, waterfall hikes, and dark, quiet nights. It’s not a place with many shops or attractions, but that’s precisely why some people love it. Mellen is about unplugging and living closer to the land.
The slight decline in home values in 2025 might reflect decreased demand following a spike or limited inventory in such a small market. Still, even at just over $145,000, homes remain affordable and appealing to those drawn to off-grid lifestyles or nature-based recreation. Mellen may not be on most buyers’ radars, but for those who find it, it offers affordability, beauty, and solitude at a price that’s hard to beat. If long-term value stability returns, it could become a solid pick for those who prefer peace over proximity.
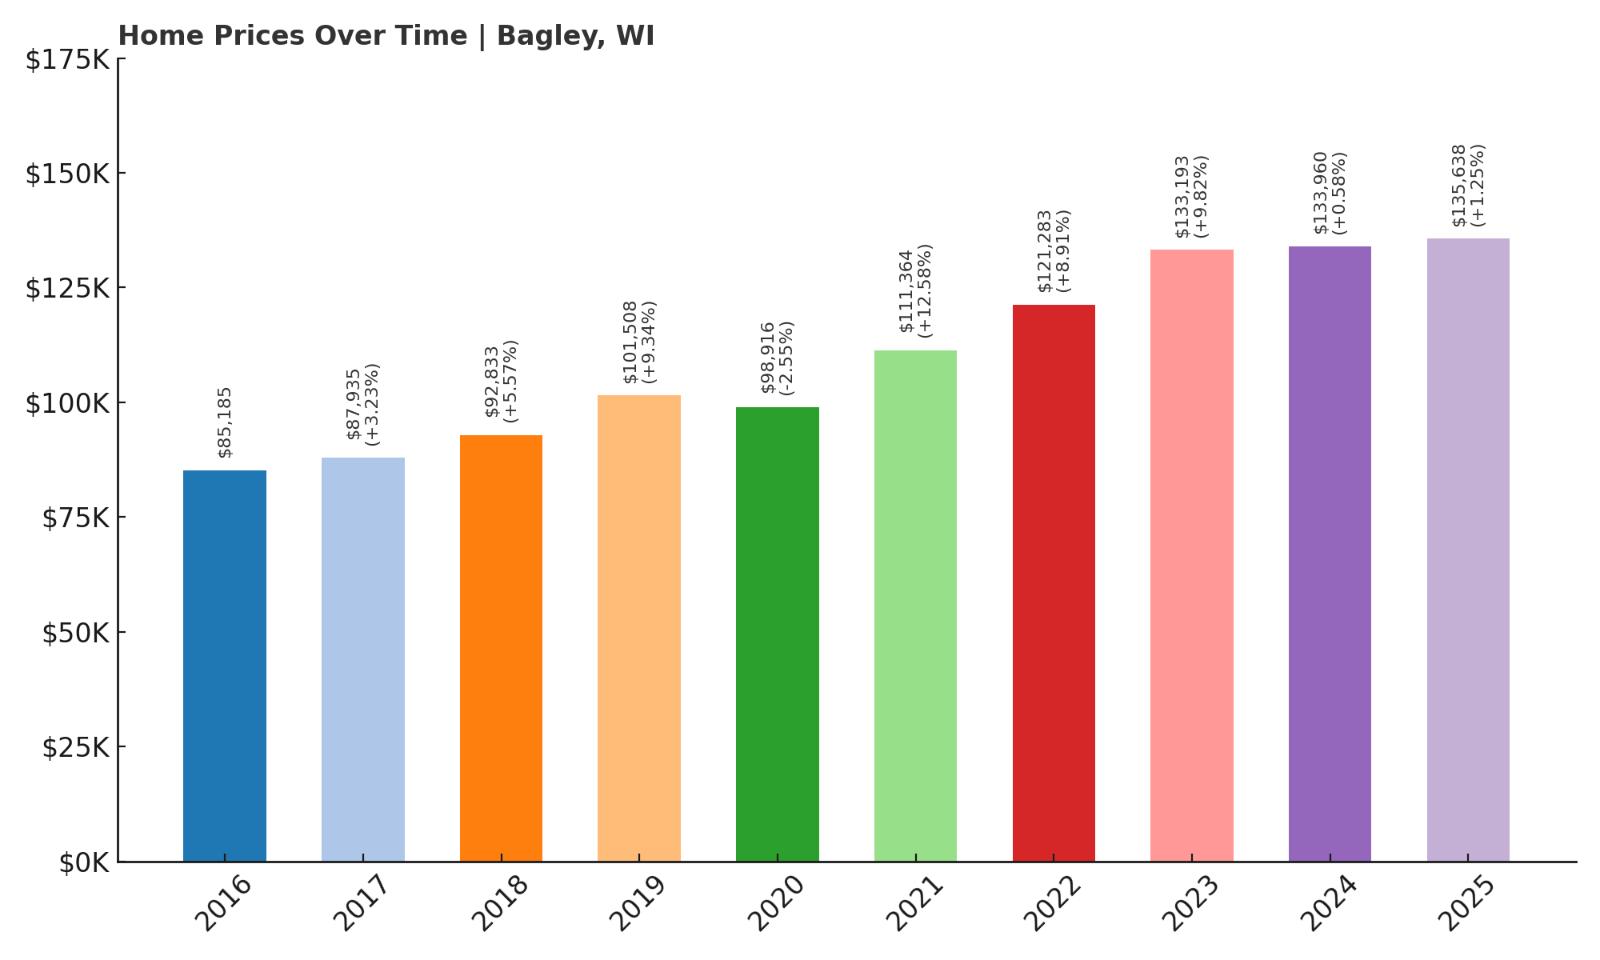
3. Bagley – 59% Home Price Increase Since May 2016
- 2010: N/A
- 2011: N/A
- 2012: N/A
- 2013: N/A
- 2014: N/A
- 2015: N/A
- 2016: $85,185
- 2017: $87,935 (+$2,750, +3.23% from previous year)
- 2018: $92,833 (+$4,898, +5.57% from previous year)
- 2019: $101,508 (+$8,675, +9.34% from previous year)
- 2020: $98,916 (−$2,592, −2.55% from previous year)
- 2021: $111,364 (+$12,448, +12.58% from previous year)
- 2022: $121,283 (+$9,919, +8.91% from previous year)
- 2023: $133,193 (+$11,910, +9.82% from previous year)
- 2024: $133,960 (+$766, +0.58% from previous year)
- 2025: $135,638 (+$1,679, +1.25% from previous year)
Bagley has experienced a 59% increase in home prices since 2016, growing from $85,185 to $135,638 by 2025. Though the town saw a dip in 2020, prices rebounded strongly with double-digit growth in both 2021 and 2022. The pace of growth has since cooled, with modest gains in 2024 and 2025. Overall, Bagley remains one of the most affordable towns in Wisconsin, offering slow but steady appreciation without the price volatility seen in more competitive markets.
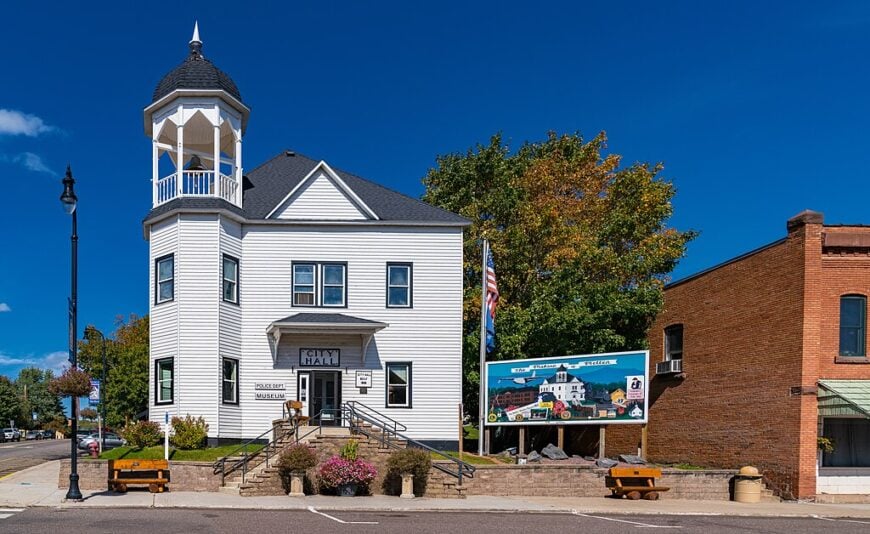
Bagley – A Riverside Village with Small-Town Charm

Bagley is a tiny village in Grant County, located right on the Mississippi River. It’s a quiet community known for its riverside views, campgrounds, and relaxed pace of life. Popular with weekenders and anglers, it has a seasonal character—many homes here are cabins or vacation properties. Despite that, year-round residents enjoy a strong sense of community and a peaceful setting that’s hard to find elsewhere. The town is especially attractive to those seeking second homes or retirement getaways without spending big.
The town’s real estate has grown gradually, and its low entry price has kept it attractive to budget-conscious buyers. While appreciation has slowed in recent years, Bagley remains a solid place to buy affordably with long-term potential. Its riverfront location, rural setting, and unpretentious vibe make it a hidden favorite among those looking to escape the city. If river views, affordability, and calm are on your wishlist, Bagley is hard to beat.
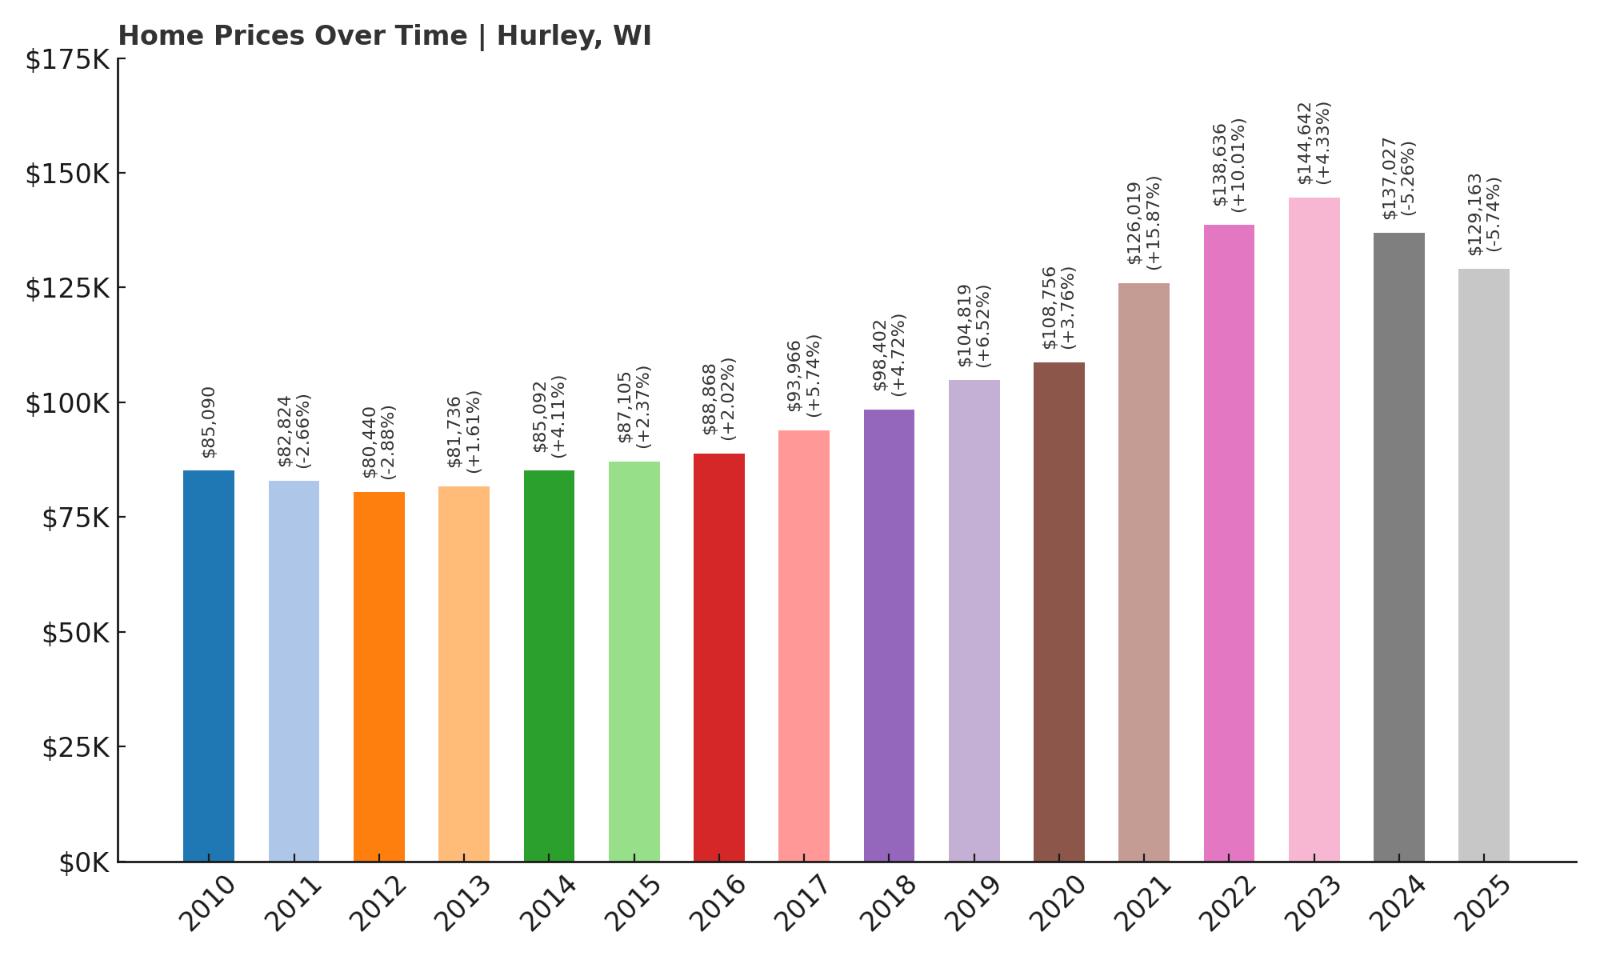
2. Hurley – 52% Home Price Increase Since May 2010
- 2010: $85,090
- 2011: $82,824 (−$2,266, −2.66% from previous year)
- 2012: $80,440 (−$2,385, −2.88% from previous year)
- 2013: $81,736 (+$1,296, +1.61% from previous year)
- 2014: $85,092 (+$3,357, +4.11% from previous year)
- 2015: $87,105 (+$2,013, +2.37% from previous year)
- 2016: $88,868 (+$1,762, +2.02% from previous year)
- 2017: $93,966 (+$5,099, +5.74% from previous year)
- 2018: $98,402 (+$4,435, +4.72% from previous year)
- 2019: $104,819 (+$6,417, +6.52% from previous year)
- 2020: $108,756 (+$3,937, +3.76% from previous year)
- 2021: $126,019 (+$17,264, +15.87% from previous year)
- 2022: $138,636 (+$12,617, +10.01% from previous year)
- 2023: $144,642 (+$6,006, +4.33% from previous year)
- 2024: $137,027 (−$7,615, −5.26% from previous year)
- 2025: $129,163 (−$7,864, −5.74% from previous year)
Hurley’s home values rose by 52% from 2010 to 2025, although the last two years saw modest pullbacks. Prices peaked in 2023 at $144,642 before dropping in both 2024 and 2025. Still, with a long history of appreciation and values remaining above $129,000, the market here appears to be undergoing a correction rather than a collapse. The earlier years—particularly 2021 and 2022—saw rapid gains, which may have temporarily outpaced demand. In the long term, Hurley remains an affordable town with a stable base for recovery.
Hurley – A Mining Town with a Rugged Reputation

Located in Iron County on the Michigan border, Hurley has a colorful history rooted in the mining and lumber industries. It’s long been a blue-collar town with strong community ties, cold winters, and resilient people. Today, it offers scenic views of the nearby Penokee Range, access to snowmobile trails, and proximity to ski resorts in neighboring Ironwood. While small in population, the town has a well-established infrastructure, including schools, healthcare, and local shops.
The recent price declines may reflect broader cooling across rural northern markets, but Hurley’s long-term affordability keeps it appealing. It offers year-round outdoor activities, a lower cost of living, and properties that provide real value. For buyers who don’t mind snow and prefer grit over gloss, Hurley offers a grounded, affordable lifestyle in a town that still knows how to take care of its own. The price dip could even make 2025 an opportune time to buy.
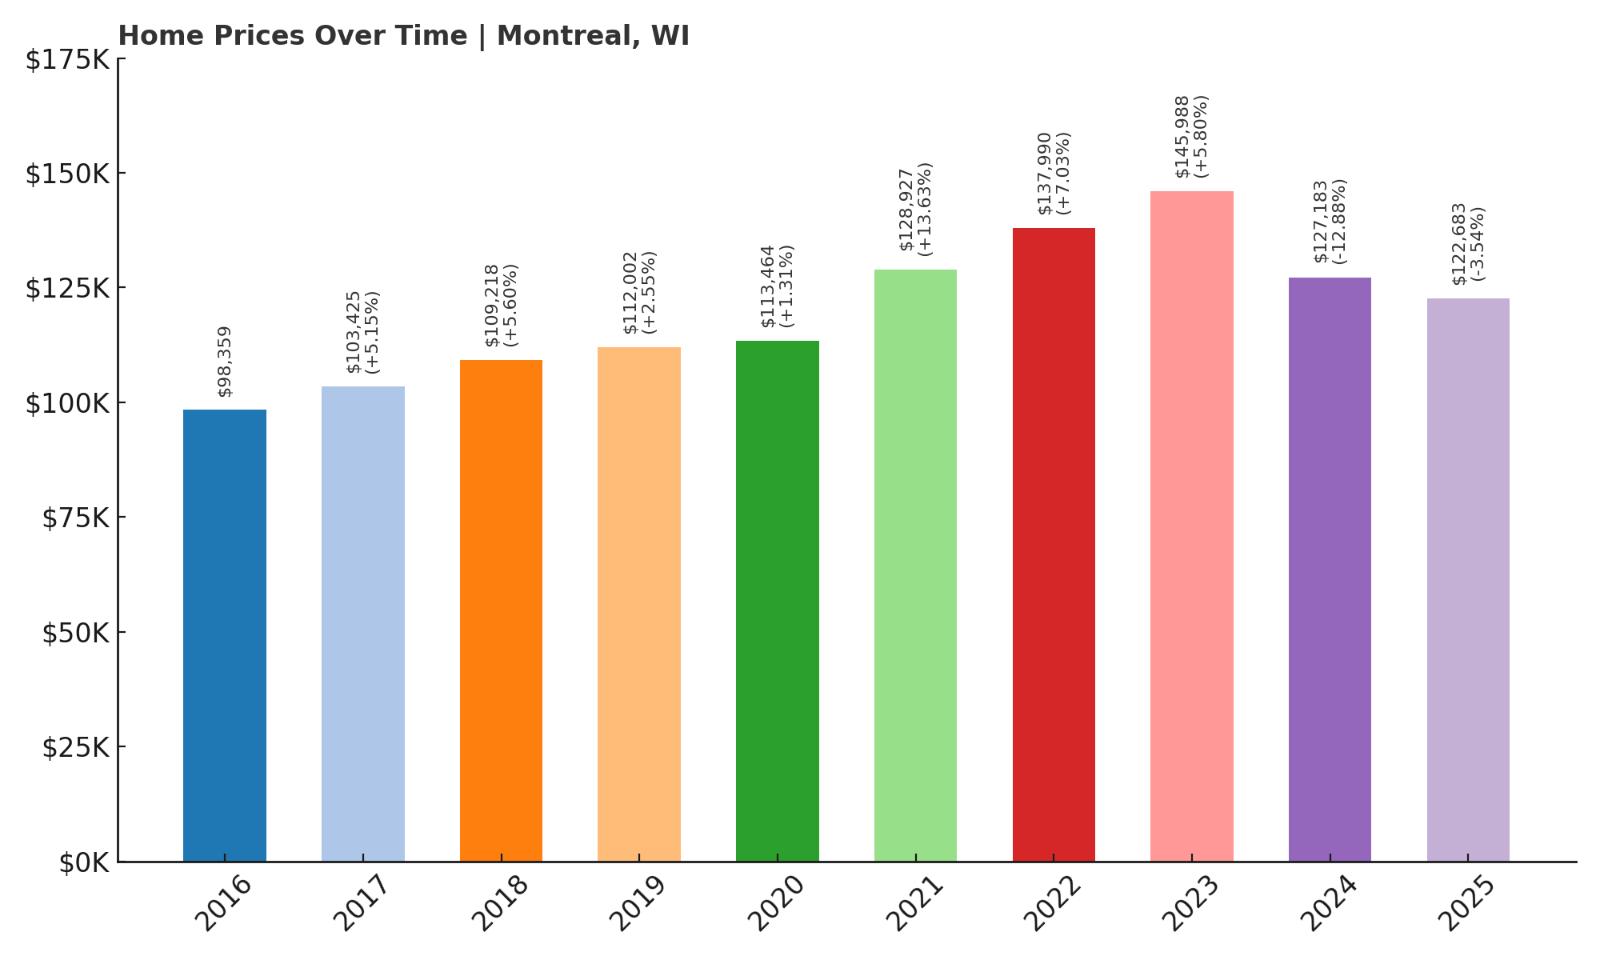
1. Montreal – 25% Home Price Increase Since May 2016
- 2010: N/A
- 2011: N/A
- 2012: N/A
- 2013: N/A
- 2014: N/A
- 2015: N/A
- 2016: $98,359
- 2017: $103,425 (+$5,066, +5.15% from previous year)
- 2018: $109,218 (+$5,793, +5.60% from previous year)
- 2019: $112,002 (+$2,784, +2.55% from previous year)
- 2020: $113,464 (+$1,462, +1.31% from previous year)
- 2021: $128,927 (+$15,464, +13.63% from previous year)
- 2022: $137,990 (+$9,062, +7.03% from previous year)
- 2023: $145,988 (+$7,998, +5.80% from previous year)
- 2024: $127,183 (−$18,805, −12.88% from previous year)
- 2025: $122,683 (−$4,499, −3.54% from previous year)
Montreal’s home prices increased 25% since 2016, despite recent pullbacks in 2024 and 2025. Prices rose consistently for seven straight years before dipping sharply in 2024. While 2025 saw another minor decline, values remain well above their 2016 levels. This suggests a market that may be stabilizing after a period of fast growth. Even at $122,683, homes in Montreal are among the most affordable in Wisconsin, especially considering the town’s proximity to ski country and outdoor attractions.
Montreal – A Ski Country Gem with Frontier Spirit

Montreal is a small city in Iron County with a rich mining history and a reputation as one of the snowiest places in Wisconsin. Nestled among the hills and forests near the Wisconsin-Michigan border, it’s a short drive from ski resorts in Ironwood and outdoor opportunities year-round. Montreal offers a peaceful setting with well-built older homes, and it’s one of the few towns in the region with a grid layout and some architectural charm thanks to its company-town origins. It’s quiet, snowy, and friendly—ideal for those who don’t mind winter and want space to breathe.
Despite recent declines, Montreal’s long-term trend is upward, and its low entry price means buyers still get considerable value. For snowmobilers, skiers, and those who love cold-weather living, it offers easy access to trails and slopes. With homes still well under $125,000, the town continues to draw attention from those priced out of trendier northern towns. If you’re after affordable living in ski country, Montreal deserves a close look.