
New York’s housing market might feel solid—but history suggests otherwise in certain towns. According to the Zillow Home Value Index, dozens of communities across the state are showing classic signs of a looming price correction. After analyzing 15 years of market data—including historical crashes, volatility, and recent overextensions—20 towns stand out as especially vulnerable. From high-end enclaves in the Hamptons to affordable upstate towns, these places all share one dangerous trait: home prices that no longer reflect local economic realities.
20. Harriman – Crash Risk Percentage: 69.15%
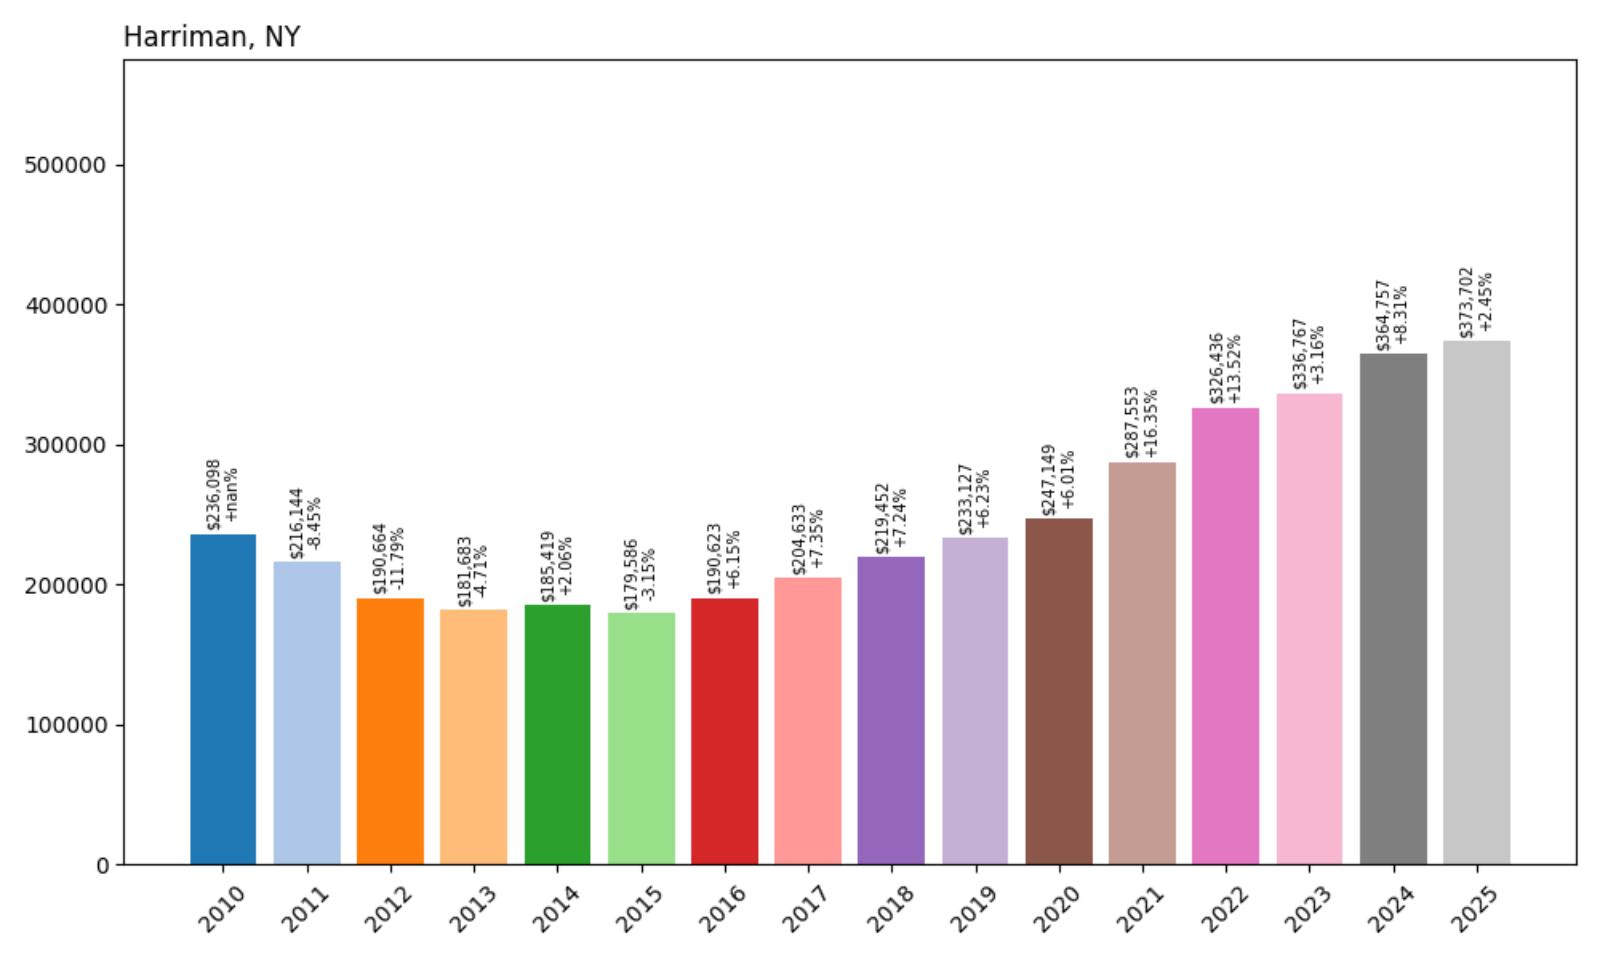
- Crash Risk Percentage: 69.15%
- Historical crashes (8%+ drops): 2
- Worst historical crash: 11.8% (2012)
- Total price increase since 2010: 58.3%
- Overextended above long-term average: 50.5%
- Price volatility (annual swings): 7.7%
- Current 2025 price: $373,702
Harriman’s housing market shows a troubling pattern of recurring instability, with two historical crashes including a devastating 11.8% drop in 2012. The town’s 58.3% price increase since 2010 has pushed values 50.5% above their long-term average, creating conditions similar to those that preceded previous corrections. The 7.7% annual volatility indicates ongoing market instability that contributes to the elevated crash risk.
Harriman – Orange County’s Repeat Offender
Located in Orange County, Harriman has established a clear pattern of boom-bust cycles that make it particularly vulnerable to future corrections. The town’s two historical crashes demonstrate a market that lacks stability and is prone to dramatic swings when economic conditions change. The current median price of approximately $374,000 represents significant appreciation from 2010 levels, but this growth has pushed the market into overextended territory once again.
The combination of recurring crash patterns and current overextension creates particularly dangerous conditions for property owners. With prices operating 50.5% above sustainable levels and a clear history of significant corrections, Harriman exhibits the classic warning signs of a market poised for another downturn. The town’s previous experience with an 11.8% crash provides a template for how quickly values can decline when market conditions shift.
19. West Hurley – Crash Risk Percentage: 69.25%
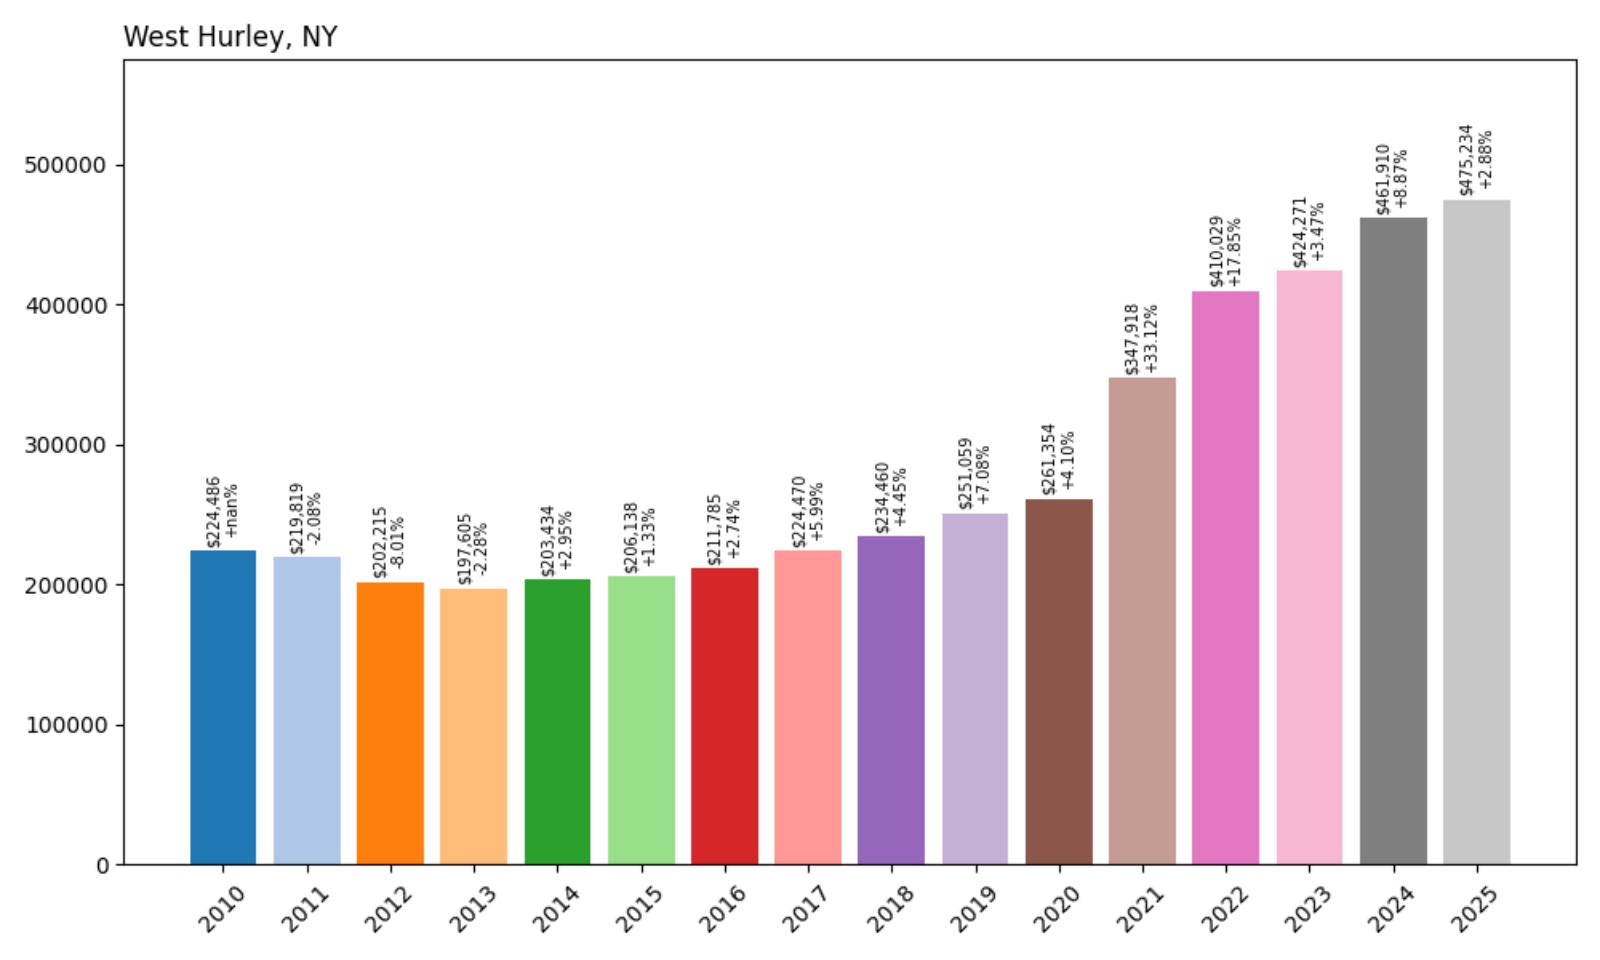
- Crash Risk Percentage: 69.25%
- Historical crashes (8%+ drops): 1
- Worst historical crash: 8.0% (2012)
- Total price increase since 2010: 111.7%
- Overextended above long-term average: 66.9%
- Price volatility (annual swings): 9.5%
- Current 2025 price: $475,234
West Hurley presents a concerning combination of extreme price appreciation and significant overextension, with values increasing 111.7% since 2010 and now operating 66.9% above their historical average. The town’s 8.0% crash in 2012 demonstrates the market’s vulnerability to correction, while the current 9.5% annual volatility indicates ongoing instability. These conditions create elevated risk for potential downturn.
West Hurley – Ulster County’s Overheated Market

Located in Ulster County’s scenic Hudson Valley region, West Hurley has experienced dramatic price appreciation that appears disconnected from local economic fundamentals. The town’s current median price of nearly $476,000 represents more than a doubling of values since 2010, creating affordability challenges that extend far beyond local wage growth. The 2012 correction of 8.0% provides historical context for how this market behaves during downturns.
The extreme overextension of 66.9% above historical averages suggests that West Hurley is operating in mathematically unsustainable territory. The town’s appeal to buyers seeking alternatives to more expensive urban markets has created speculative conditions that appear driven more by external demand than local economic capacity. With high volatility and extreme price appreciation, the market faces fundamental imbalances that historical data suggests cannot be maintained.
18. Malden – Crash Risk Percentage: 69.90%
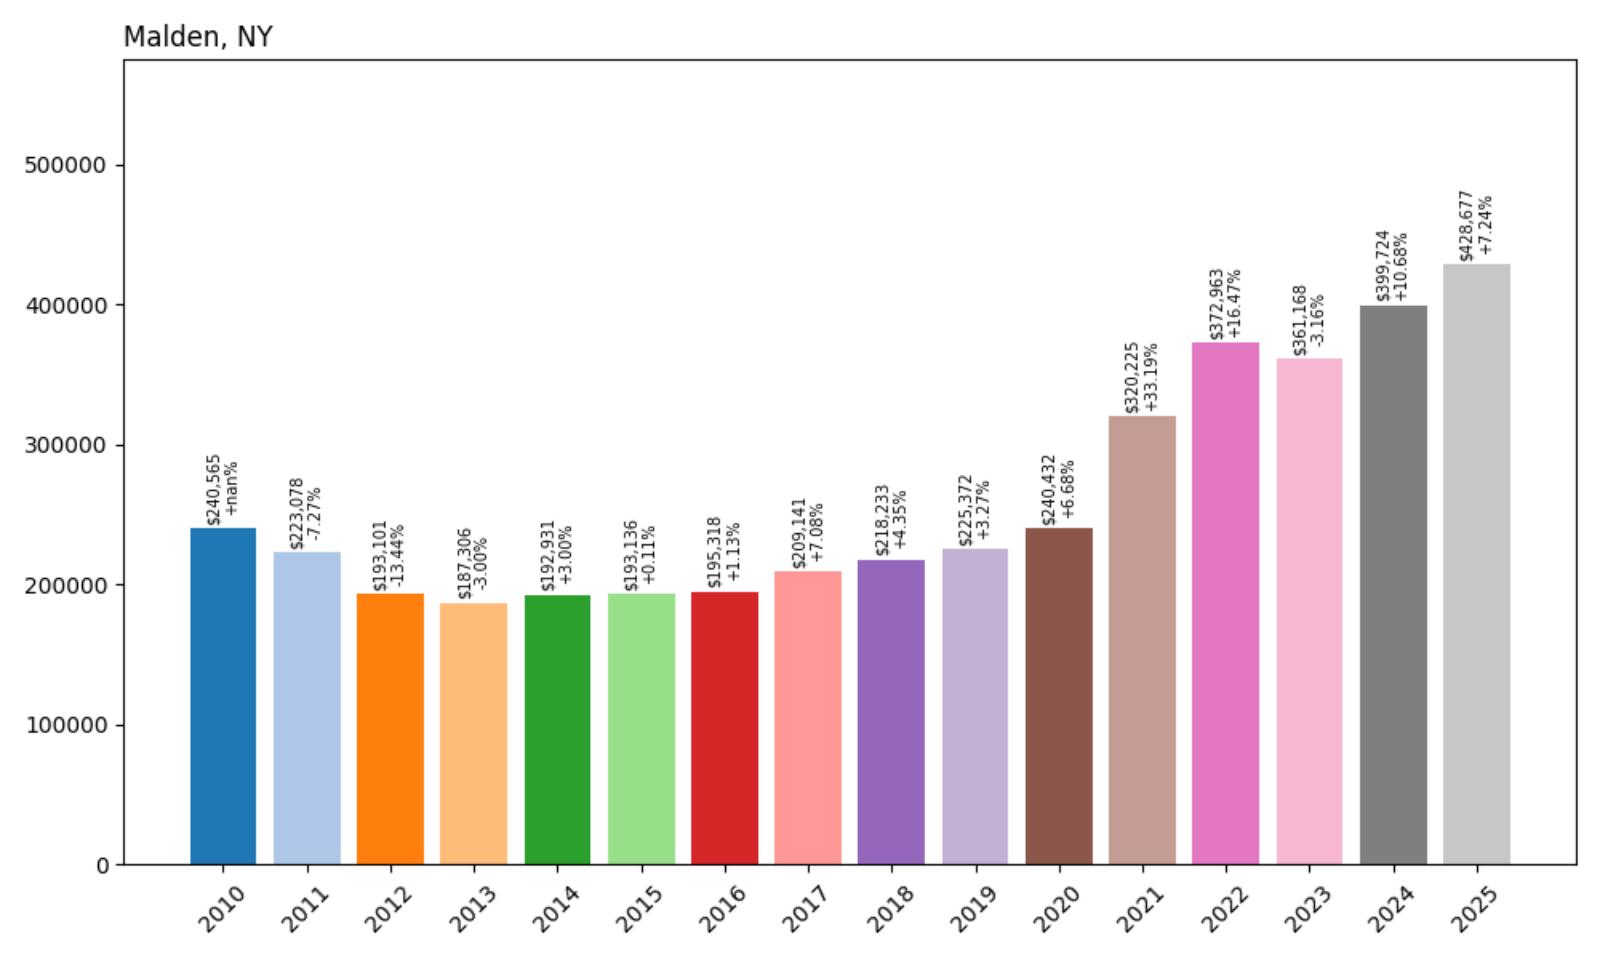
- Crash Risk Percentage: 69.90%
- Historical crashes (8%+ drops): 1
- Worst historical crash: 13.4% (2012)
- Total price increase since 2010: 78.2%
- Overextended above long-term average: 63.3%
- Price volatility (annual swings): 10.8%
- Current 2025 price: $428,677
Malden’s housing market demonstrates particularly dangerous conditions, with the worst historical crash in our analysis at 13.4% in 2012 and current prices operating 63.3% above sustainable levels. The town’s 78.2% price increase since 2010 has created extreme overextension, while the 10.8% annual volatility indicates a highly unstable market. These conditions suggest elevated risk for significant correction.
Malden – Ulster County’s Most Vulnerable Market

Located in Ulster County, Malden has experienced some of the most extreme price swings in the region, with its 13.4% crash in 2012 serving as a stark reminder of how quickly this market can unravel. The town’s current median price of approximately $429,000 represents dramatic appreciation from 2010 levels, creating conditions that appear fundamentally unsustainable. The high volatility of 10.8% indicates a market driven more by speculation than stable demand.
The combination of extreme historical crashes and current overextension creates particularly dangerous conditions for property owners. With prices operating 63.3% above sustainable levels and a clear history of devastating corrections, Malden exhibits the classic warning signs of a market poised for another significant downturn. The town’s previous experience with double-digit crashes provides a template for the severity of corrections that can occur when market conditions shift.
17. Woodridge – Crash Risk Percentage: 70.15%
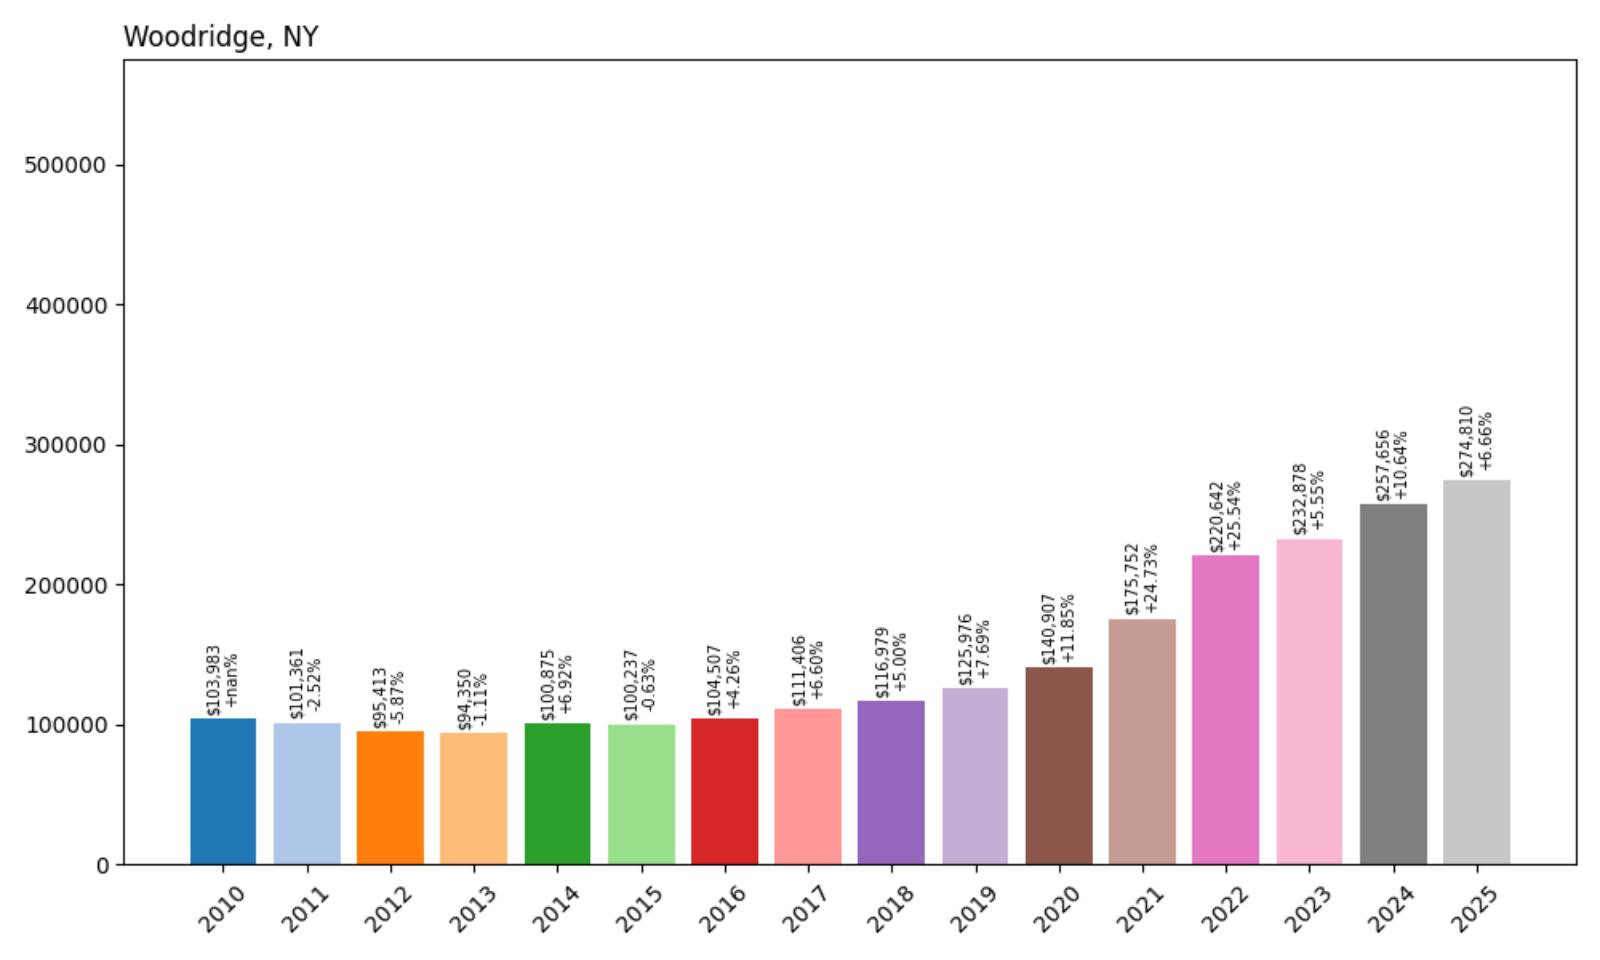
- Crash Risk Percentage: 70.15%
- Historical crashes (8%+ drops): 0
- No major crashes recorded
- Total price increase since 2010: 164.3%
- Overextended above long-term average: 86.5%
- Price volatility (annual swings): 8.8%
- Current 2025 price: $274,810
Woodridge represents one of the most extreme cases of price appreciation in our analysis, with values increasing 164.3% since 2010 and now operating 86.5% above their historical average. Despite having no recorded major crashes, the town’s extreme overextension and 8.8% annual volatility suggest a market that has become fundamentally unsustainable. The lack of historical correction precedent may actually increase vulnerability when downturns occur.
Woodridge – Sullivan County’s Untested Bubble

Located in Sullivan County, Woodridge has experienced the second-most dramatic price appreciation in our analysis, with values increasing more than 164% since 2010. The town’s transformation from an extremely affordable rural community to a market approaching $275,000 median prices represents a fundamental shift that appears disconnected from local economic capacity. The absence of previous major crashes means this market is untested during significant downturns.
The extreme overextension of 86.5% above historical averages suggests that Woodridge is operating in mathematically unsustainable territory. The town’s appeal to buyers seeking value in the broader New York market has created speculative conditions that appear driven more by external demand than local economic fundamentals. With prices having increased 164.3% since 2010, the market faces unprecedented imbalances that historical data suggests cannot be maintained.
16. Bridgeport – Crash Risk Percentage: 70.60%
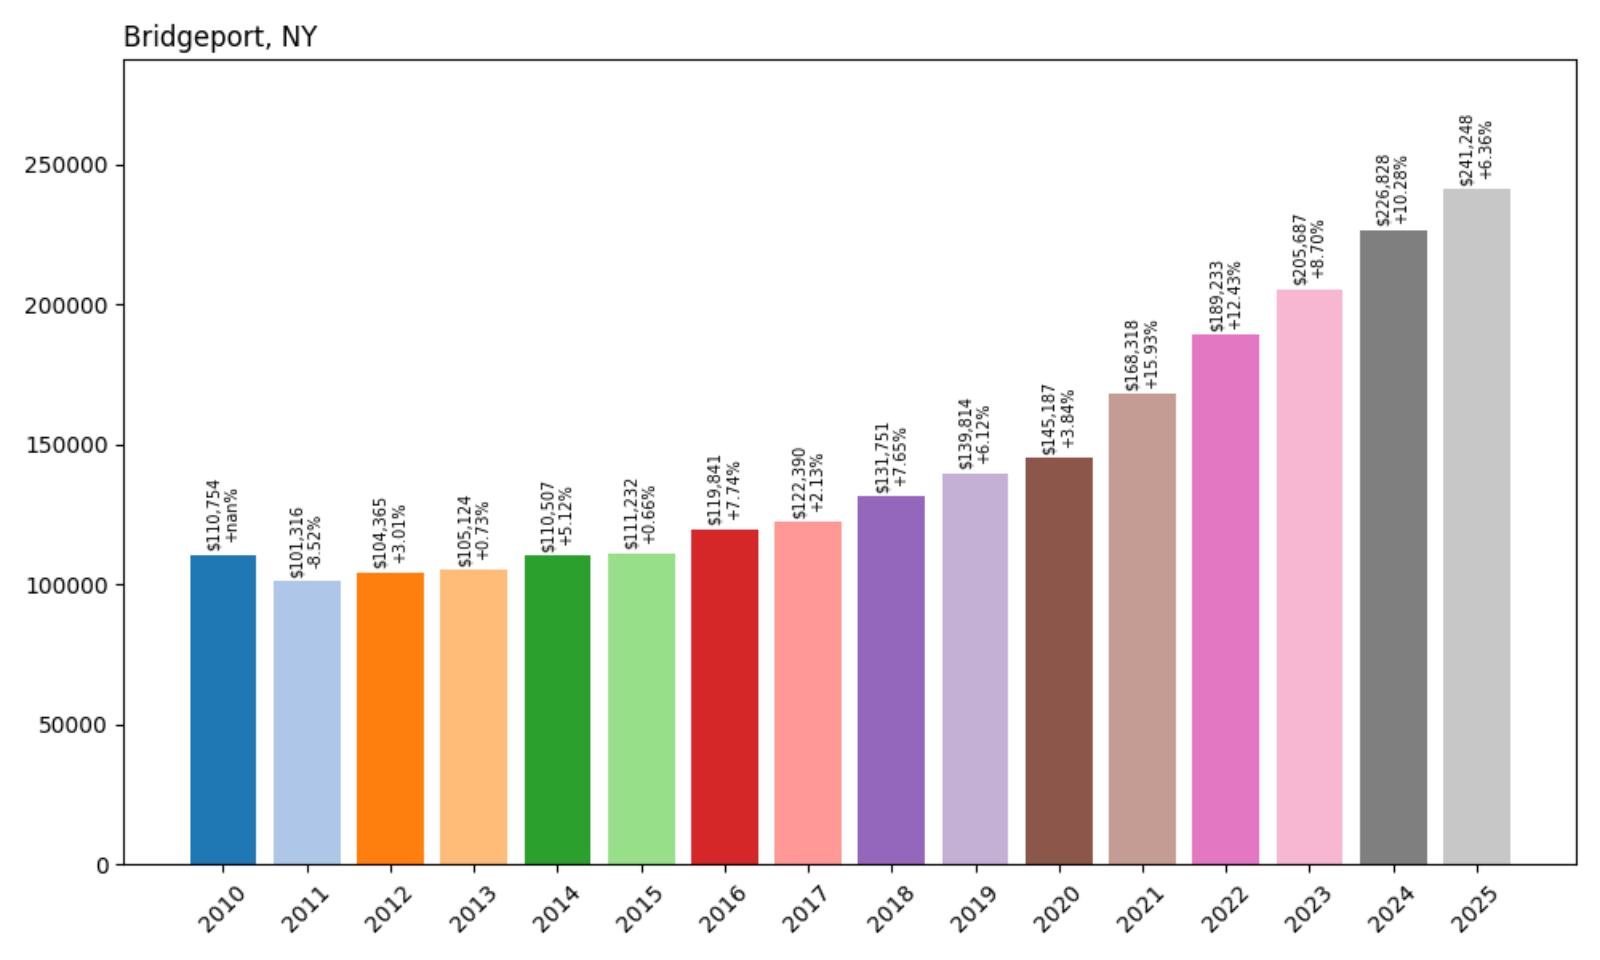
- Crash Risk Percentage: 70.60%
- Historical crashes (8%+ drops): 1
- Worst historical crash: 8.5% (2011)
- Total price increase since 2010: 117.8%
- Overextended above long-term average: 65.4%
- Price volatility (annual swings): 5.8%
- Current 2025 price: $241,248
Bridgeport presents concerning market conditions with extreme price appreciation of 117.8% since 2010 and current values operating 65.4% above their historical average. The town’s 8.5% crash in 2011 demonstrates the market’s vulnerability to correction, while the current overextension suggests conditions ripe for another downturn. Despite relatively lower volatility at 5.8%, the fundamental imbalances create elevated crash risk.
Bridgeport – Sullivan County’s Overextended Market
Located in Sullivan County, Bridgeport has experienced dramatic price appreciation that has more than doubled median values since 2010. The town’s current median price of approximately $241,000 represents significant growth from its affordable rural roots, creating conditions that appear disconnected from local economic fundamentals. The 2011 correction of 8.5% provides historical context for how this market behaves during economic downturns.
The extreme overextension of 65.4% above historical averages suggests that Bridgeport is operating beyond sustainable levels. The town’s appeal to buyers seeking value in the broader New York market has created price inflation that the local economy may not be able to support long-term. With prices having increased 117.8% since 2010, the market faces fundamental imbalances that historical data suggests are unsustainable.
15. Greenport – Crash Risk Percentage: 70.85%
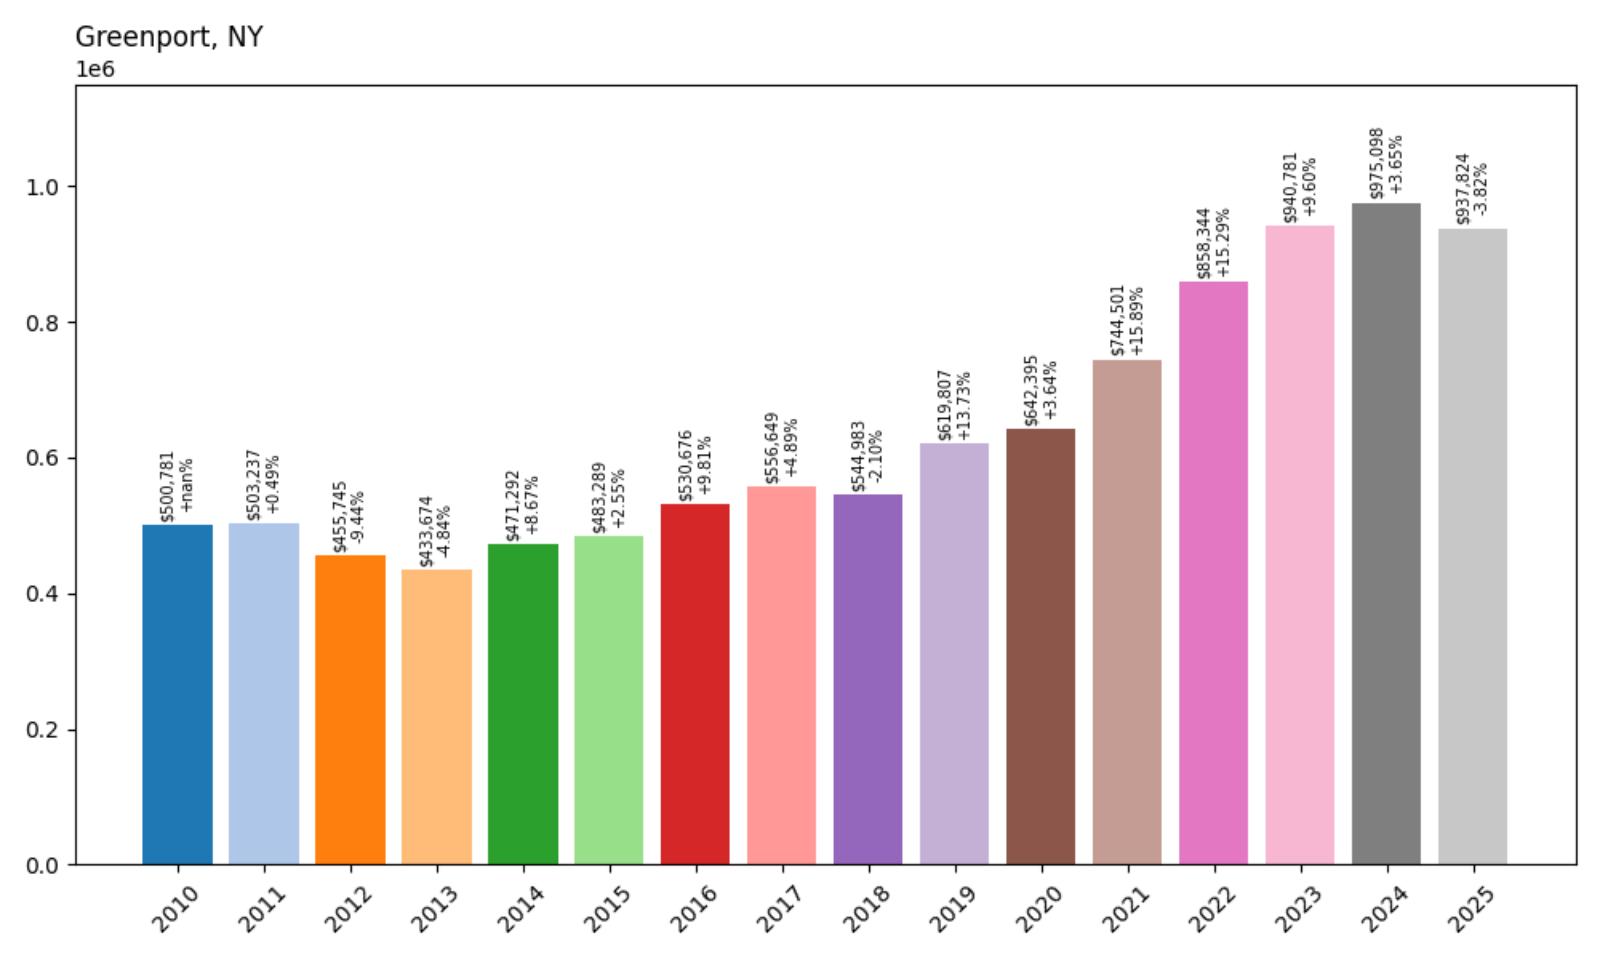
- Crash Risk Percentage: 70.85%
- Historical crashes (8%+ drops): 1
- Worst historical crash: 9.4% (2012)
- Total price increase since 2010: 87.3%
- Overextended above long-term average: 47.1%
- Price volatility (annual swings): 7.6%
- Current 2025 price: $937,824
Greenport represents a unique case in our analysis, with its extremely high median price of nearly $938,000 reflecting its position as a premium Long Island market. The town’s 87.3% price increase since 2010 has pushed values 47.1% above their historical average, while the 9.4% crash in 2012 demonstrates the market’s vulnerability to correction. The 7.6% annual volatility indicates ongoing market instability in this high-value market.
Greenport – Suffolk County’s Premium Risk

Located on Long Island’s North Fork, Greenport has established itself as one of the region’s most expensive markets, with median prices approaching $940,000. The town’s appeal as a waterfront destination and wine country location has driven dramatic price appreciation, but current values appear to have reached levels that may not be sustainable even for this premium market. The 2012 correction of 9.4% provides historical context for how even expensive markets can experience significant downturns.
Despite its premium positioning, Greenport exhibits concerning signs of overextension at 47.1% above historical averages. The town’s dependence on second-home buyers and tourism-related demand makes it particularly vulnerable to economic shifts that could reduce discretionary spending. With prices having increased 87.3% since 2010, the market faces the challenge of maintaining values that may have disconnected from even high-income buyer capacity.
14. Tannersville – Crash Risk Percentage: 71.35%
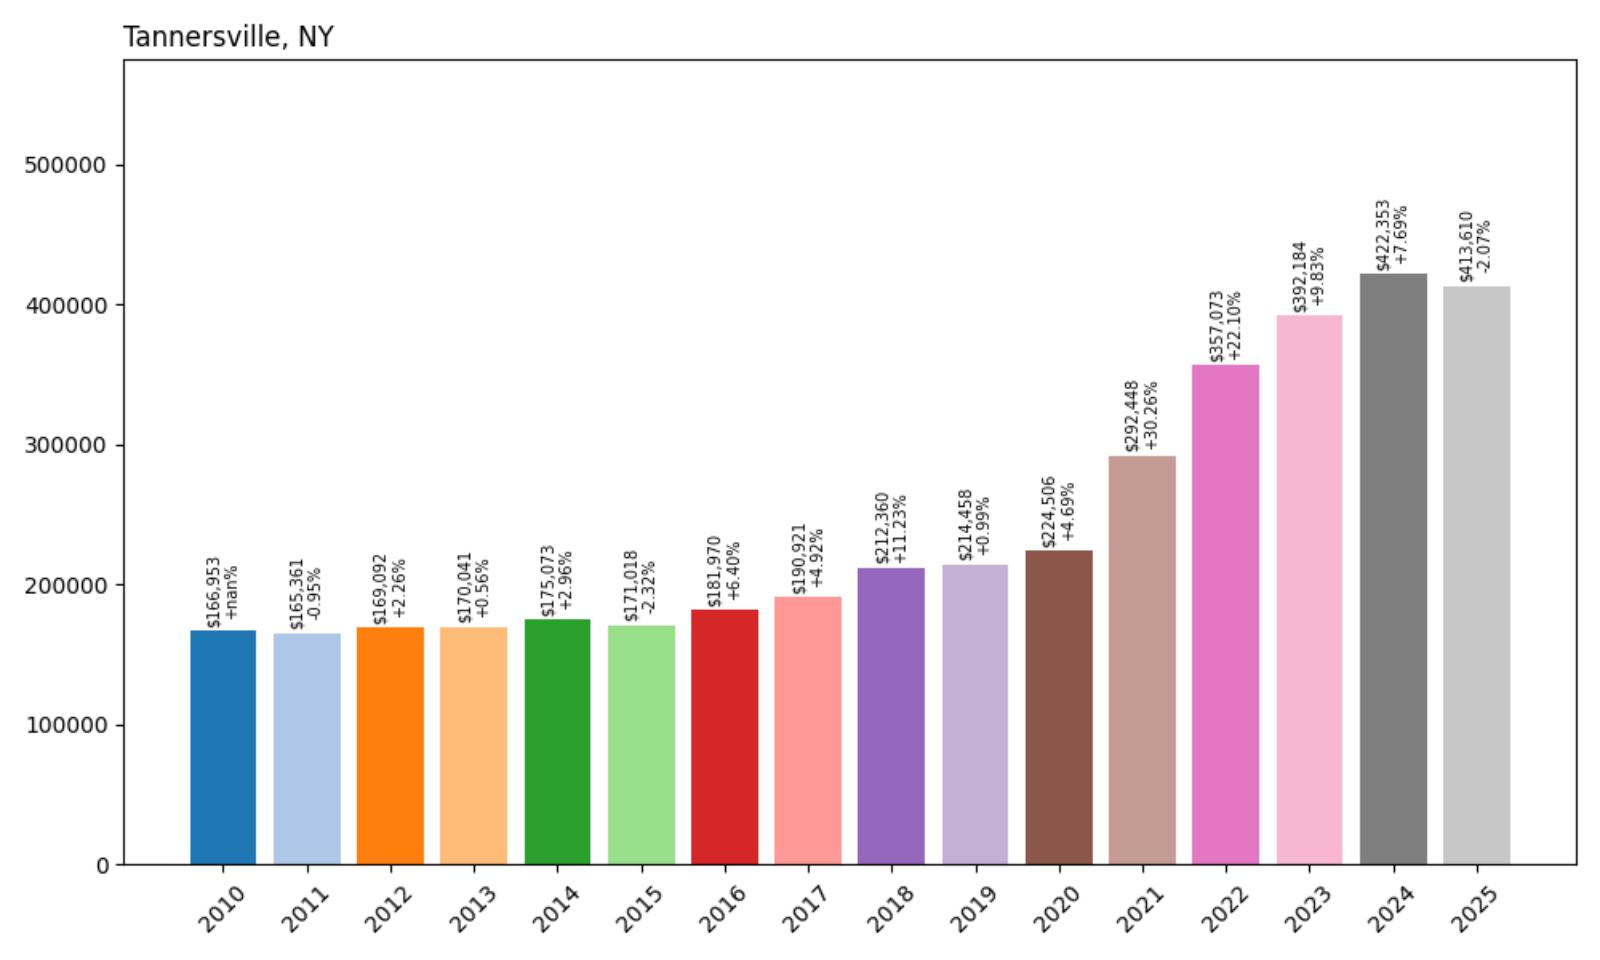
- Crash Risk Percentage: 71.35%
- Historical crashes (8%+ drops): 0
- No major crashes recorded
- Total price increase since 2010: 147.7%
- Overextended above long-term average: 68.8%
- Price volatility (annual swings): 9.1%
- Current 2025 price: $413,610
Tannersville presents one of the most extreme cases of price appreciation in our analysis, with values increasing 147.7% since 2010 and now operating 68.8% above their historical average. Despite having no recorded major crashes, the town’s extreme overextension and 9.1% annual volatility suggest a market that has become fundamentally unsustainable. The lack of historical correction precedent may actually increase vulnerability when downturns occur.
Tannersville – Greene County’s Untested Bubble
Located in Greene County’s scenic Catskill region, Tannersville has experienced dramatic price appreciation that has transformed it from an affordable mountain community to a market approaching $414,000 median prices. The town’s appeal as a rural retreat and outdoor recreation destination has driven unprecedented demand, but current values appear fundamentally disconnected from local economic capacity. The absence of previous major crashes means this market is untested during significant downturns.
The extreme overextension of 68.8% above historical averages suggests that Tannersville is operating in mathematically unsustainable territory. The town’s transformation during the pandemic from an affordable rural community to a high-priced market represents a fundamental shift that may not be sustainable as remote work trends evolve. With prices having increased 147.7% since 2010, the market faces unprecedented imbalances that historical data suggests cannot be maintained.
13. Middle Island – Crash Risk Percentage: 71.85%
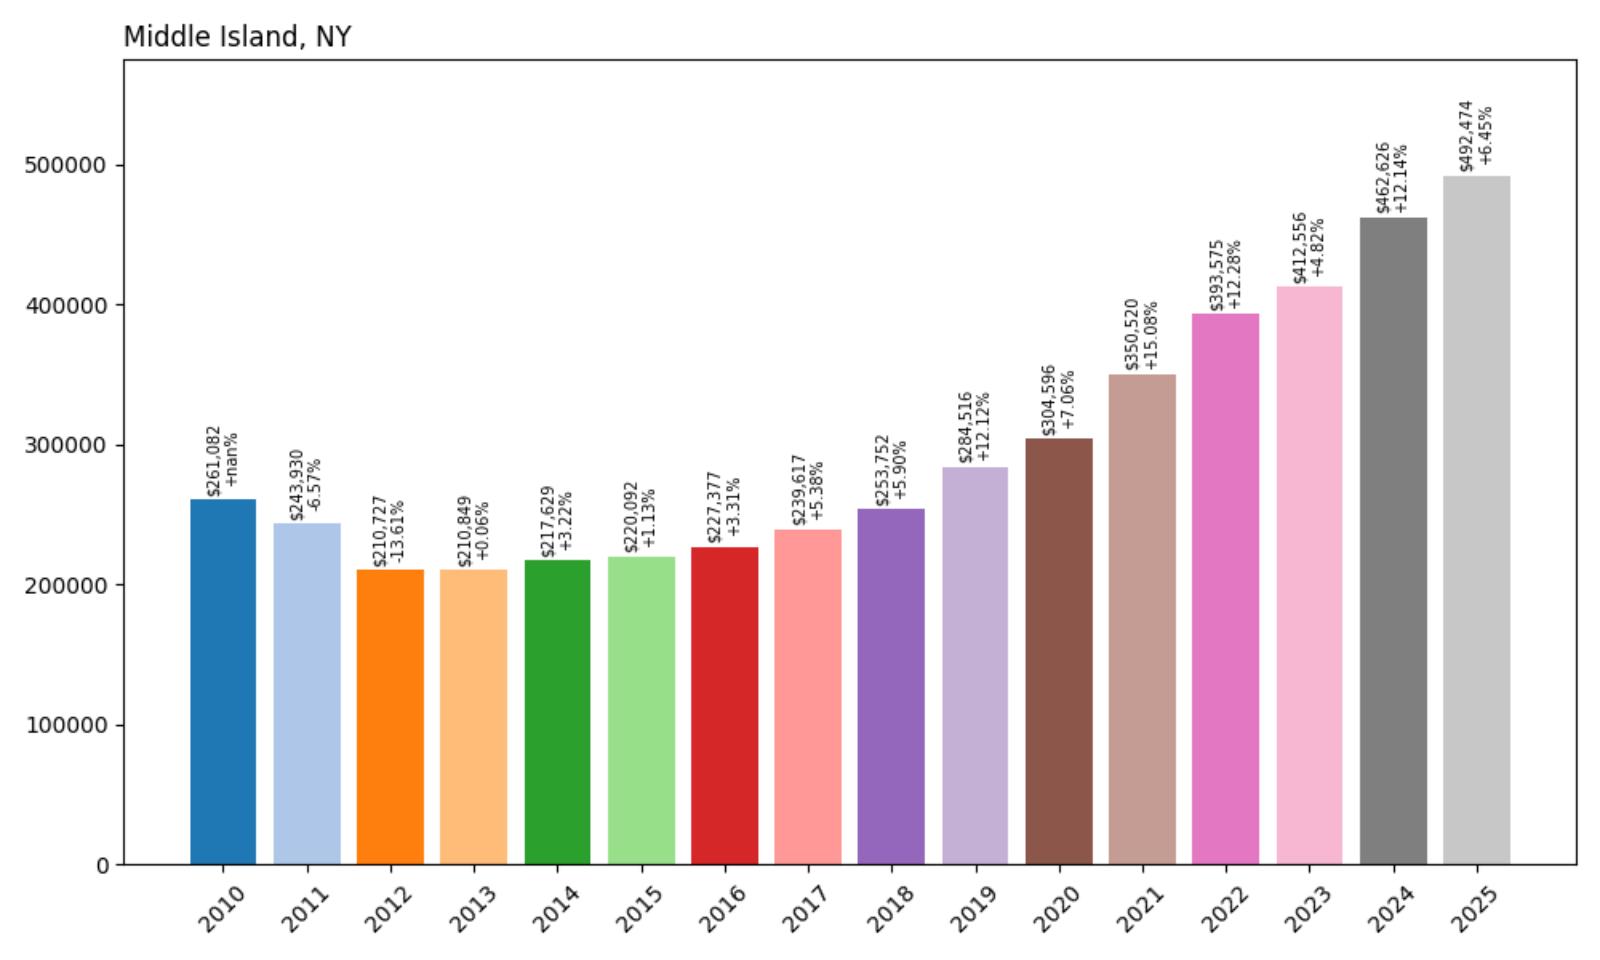
- Crash Risk Percentage: 71.85%
- Historical crashes (8%+ drops): 1
- Worst historical crash: 13.6% (2012)
- Total price increase since 2010: 88.6%
- Overextended above long-term average: 64.6%
- Price volatility (annual swings): 7.5%
- Current 2025 price: $492,474
Middle Island demonstrates particularly dangerous market conditions, with one of the worst historical crashes in our analysis at 13.6% in 2012 and current prices operating 64.6% above sustainable levels. The town’s 88.6% price increase since 2010 has created significant overextension, while the 7.5% annual volatility indicates ongoing market instability. These conditions suggest elevated risk for another significant correction.
Middle Island – Suffolk County’s Correction-Prone Market
Located in central Suffolk County, Middle Island has experienced some of the most severe price swings in the Long Island region, with its 13.6% crash in 2012 serving as a stark reminder of how quickly this market can unravel. The town’s current median price of approximately $492,000 represents dramatic appreciation from 2010 levels, creating conditions that appear fundamentally unsustainable. The historical crash provides clear precedent for the severity of corrections that can occur.
The combination of extreme historical crashes and current overextension creates particularly dangerous conditions for property owners. With prices operating 64.6% above sustainable levels and a clear history of devastating corrections, Middle Island exhibits the classic warning signs of a market poised for another significant downturn. The town’s previous experience with double-digit crashes provides a template for how severe corrections can be when market conditions shift.
12. High Falls – Crash Risk Percentage: 72.95%
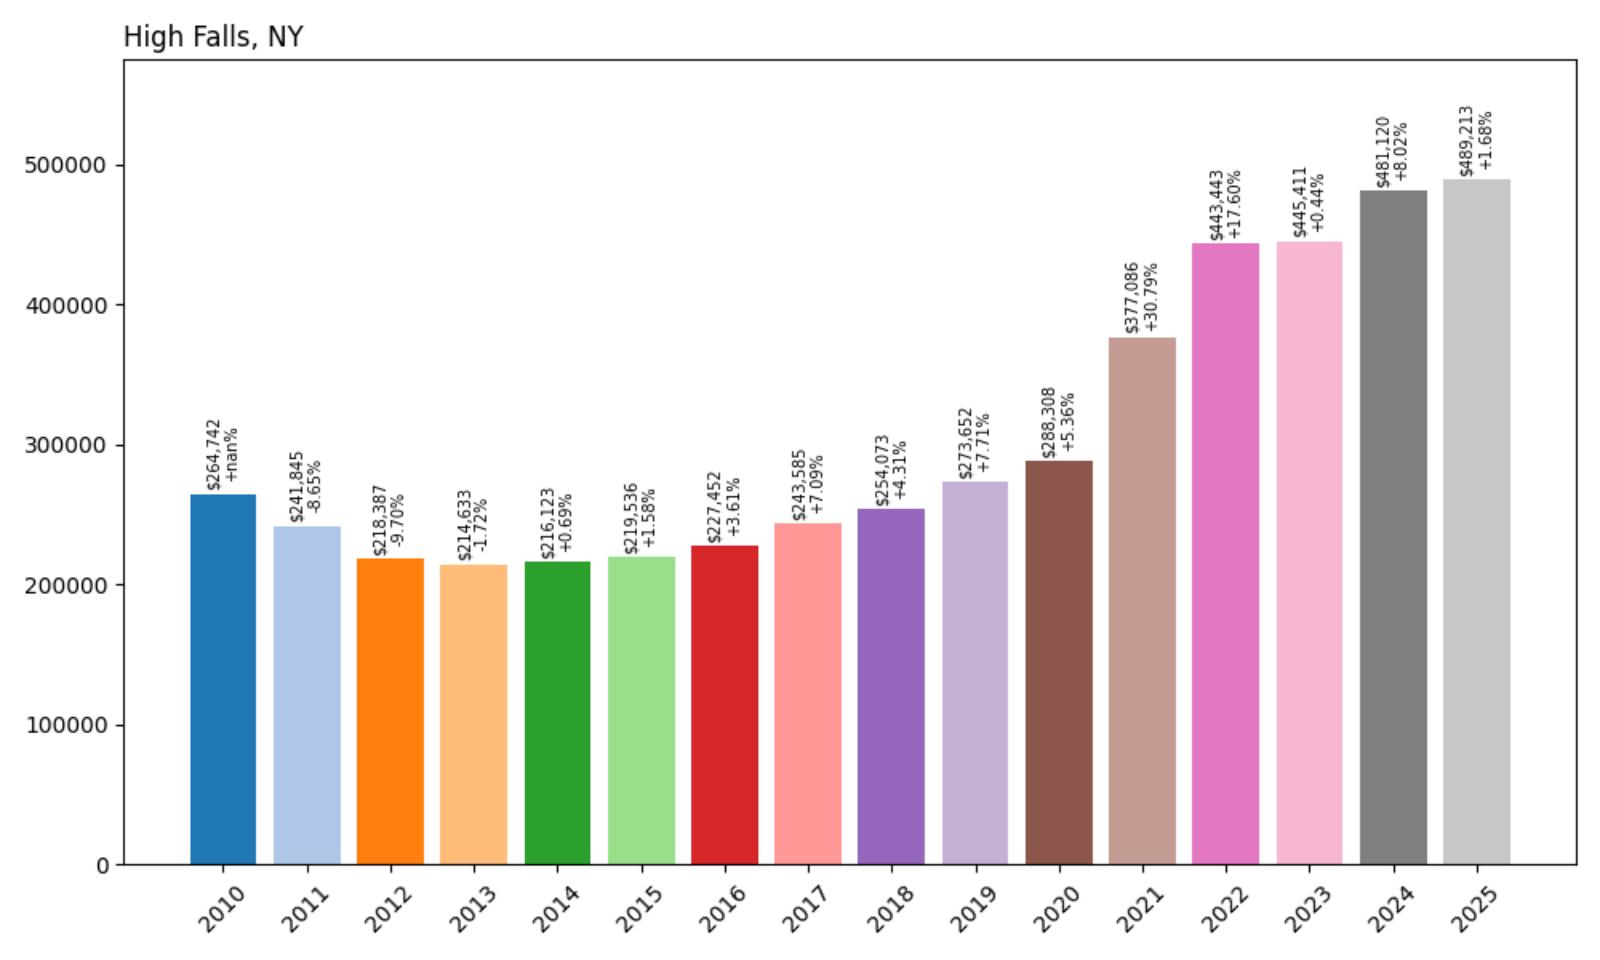
- Crash Risk Percentage: 72.95%
- Historical crashes (8%+ drops): 2
- Worst historical crash: 9.7% (2012)
- Total price increase since 2010: 84.8%
- Overextended above long-term average: 59.8%
- Price volatility (annual swings): 9.8%
- Current 2025 price: $489,213
High Falls shows a troubling pattern of recurring market instability, with two historical crashes including a 9.7% drop in 2012. The town’s 84.8% price increase since 2010 has pushed values 59.8% above their long-term average, creating conditions similar to those that preceded previous corrections. The 9.8% annual volatility indicates ongoing market instability that contributes to the elevated crash risk.
High Falls – Ulster County’s Repeat Offender
Located in Ulster County’s scenic Hudson Valley region, High Falls has established a clear pattern of boom-bust cycles that make it particularly vulnerable to future corrections. The town’s two historical crashes demonstrate a market that lacks stability and is prone to dramatic swings when economic conditions change. The current median price of approximately $489,000 represents significant appreciation from 2010 levels, but this growth has pushed the market into overextended territory once again.
The combination of recurring crash patterns and current overextension creates particularly dangerous conditions for property owners. With prices operating 59.8% above sustainable levels and a clear history of multiple corrections, High Falls exhibits the classic warning signs of a market poised for another downturn. The town’s previous experience with nearly 10% crashes provides a template for how quickly values can decline when market conditions shift.
11. Chaumont – Crash Risk Percentage: 73.30%
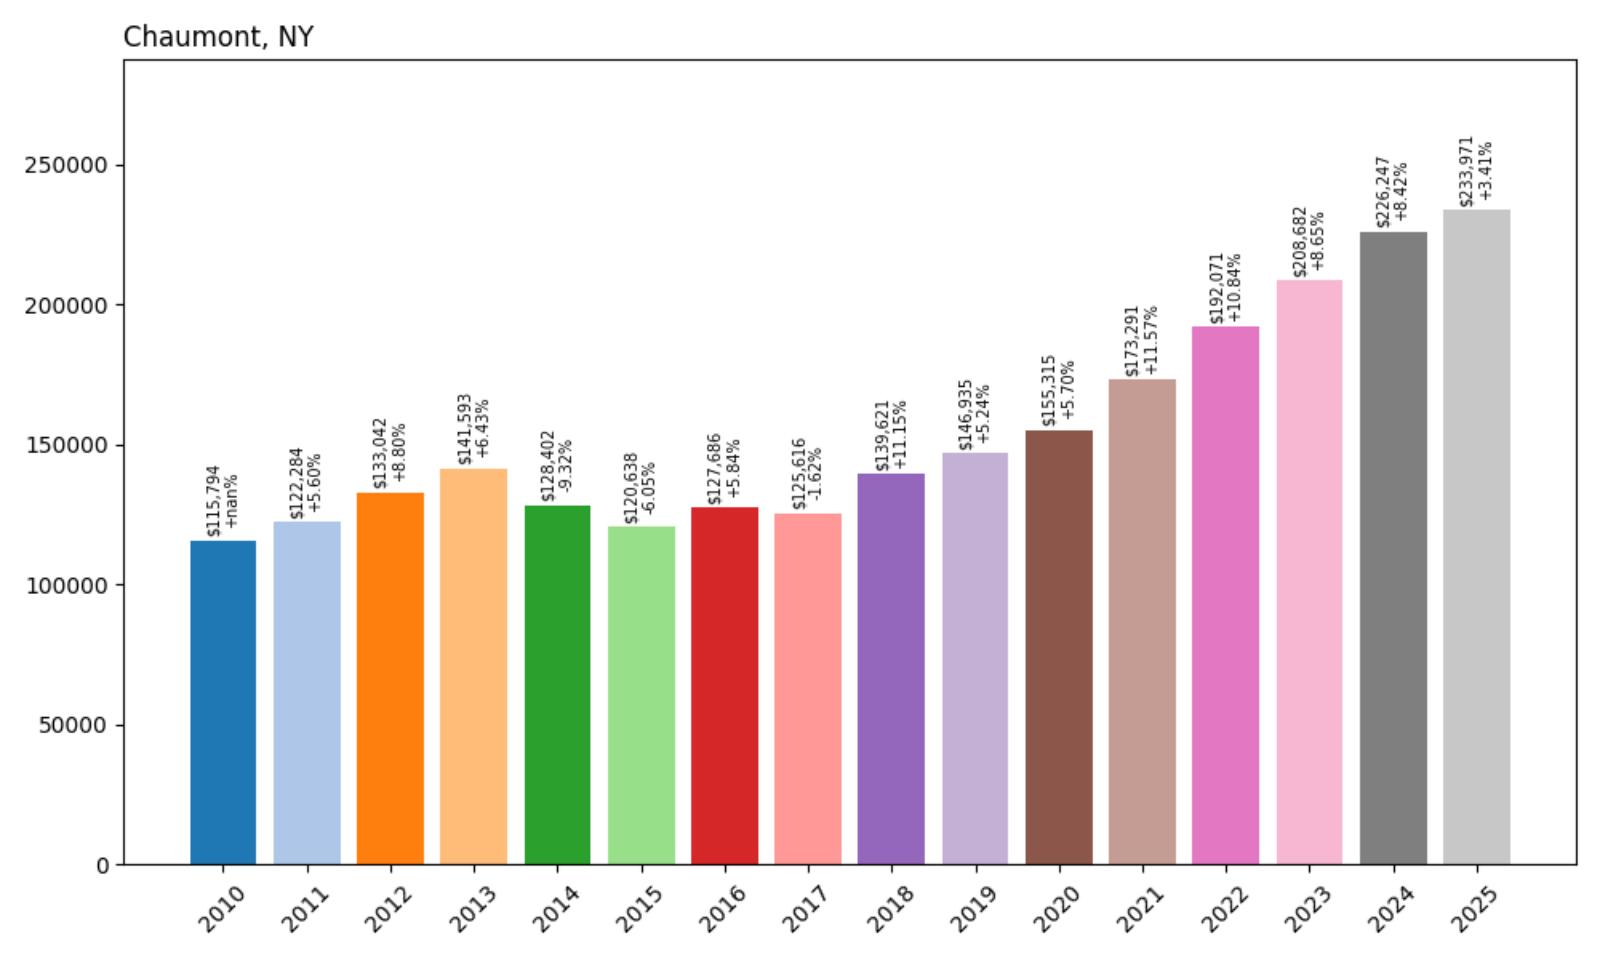
- Crash Risk Percentage: 73.30%
- Historical crashes (8%+ drops): 1
- Worst historical crash: 9.3% (2014)
- Total price increase since 2010: 102.1%
- Overextended above long-term average: 50.3%
- Price volatility (annual swings): 6.2%
- Current 2025 price: $233,971
Chaumont presents concerning market conditions with extreme price appreciation of 102.1% since 2010 and current values operating 50.3% above their historical average. The town’s 9.3% crash in 2014 demonstrates the market’s vulnerability to correction, while the current overextension suggests conditions ripe for another downturn. Despite relatively lower volatility at 6.2%, the fundamental imbalances create elevated crash risk.
Chaumont – Jefferson County’s Overextended Market
Located in Jefferson County near the Thousand Islands region, Chaumont has experienced dramatic price appreciation that has more than doubled median values since 2010. The town’s current median price of approximately $234,000 represents significant growth from its affordable rural roots, creating conditions that appear disconnected from local economic fundamentals. The 2014 correction of 9.3% provides historical context for how this market behaves during economic downturns.
The extreme overextension of 50.3% above historical averages suggests that Chaumont is operating beyond sustainable levels. The town’s appeal to buyers seeking waterfront access and recreational opportunities has created price inflation that the local economy may not be able to support long-term. With prices having increased 102.1% since 2010, the market faces fundamental imbalances that historical data suggests are unsustainable.
10. Middletown – Crash Risk Percentage: 73.95%
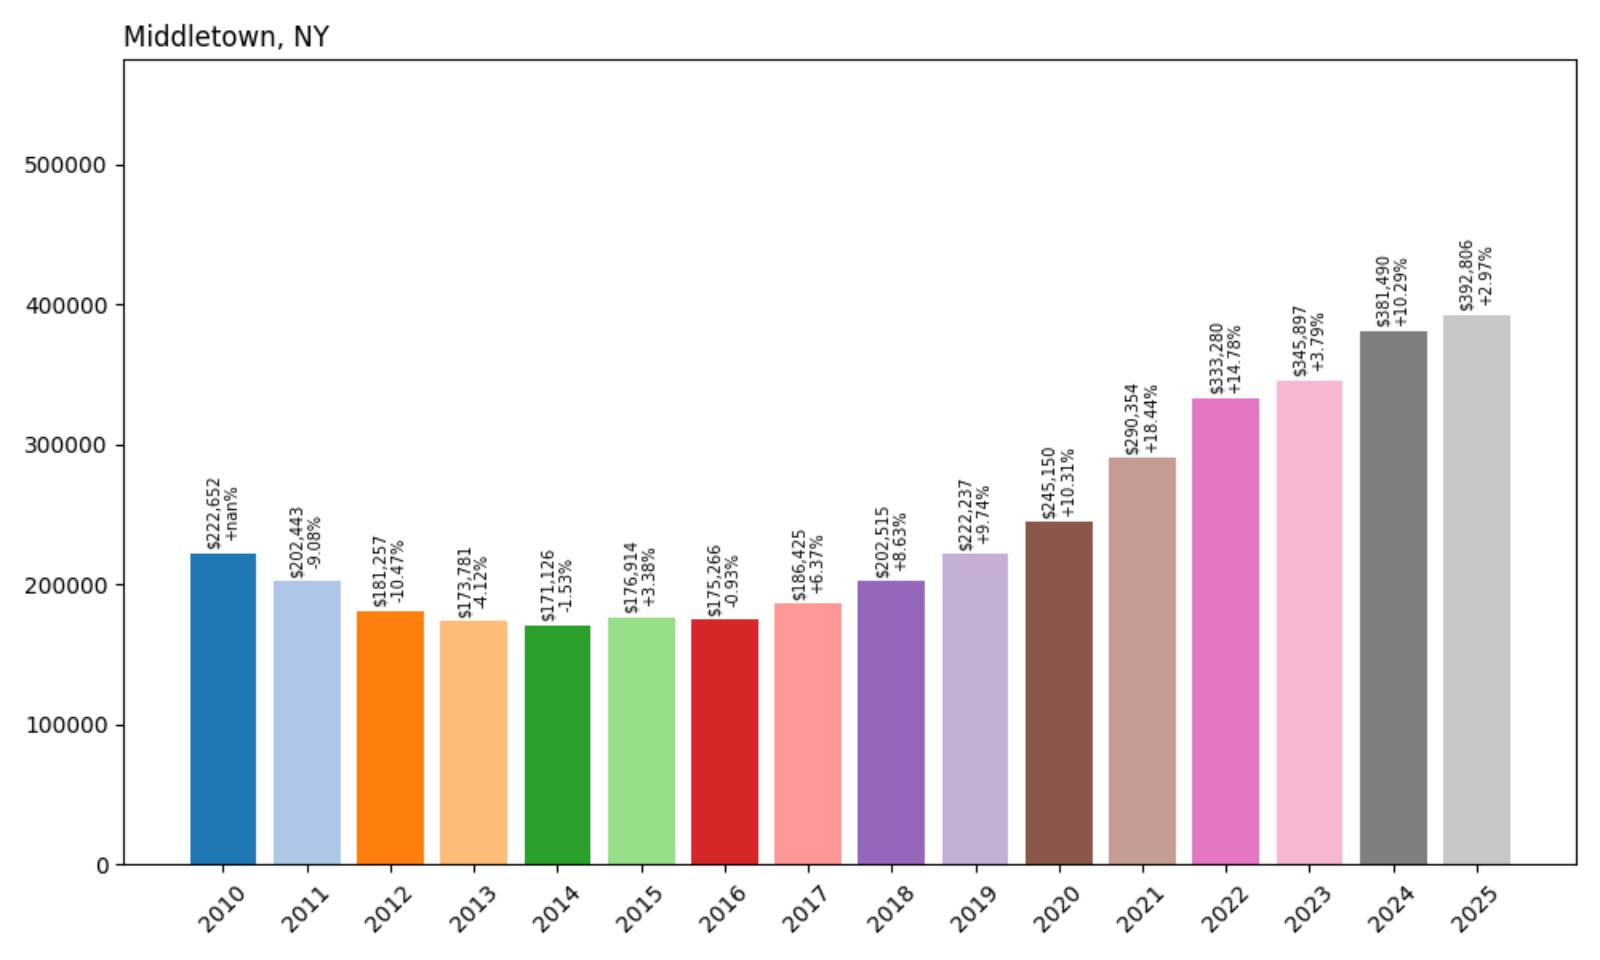
- Crash Risk Percentage: 73.95%
- Historical crashes (8%+ drops): 2
- Worst historical crash: 10.5% (2012)
- Total price increase since 2010: 76.4%
- Overextended above long-term average: 61.0%
- Price volatility (annual swings): 8.3%
- Current 2025 price: $392,806
Middletown shows a troubling pattern of recurring market instability, with two historical crashes including a devastating 10.5% drop in 2012. The town’s 76.4% price increase since 2010 has pushed values 61.0% above their long-term average, creating conditions similar to those that preceded previous corrections. The 8.3% annual volatility indicates ongoing market instability that contributes to the elevated crash risk.
Middletown – Orange County’s Unstable Market

Located in Orange County, Middletown has established a clear pattern of boom-bust cycles that make it particularly vulnerable to future corrections. The town’s two historical crashes demonstrate a market that lacks stability and is prone to dramatic swings when economic conditions change. The current median price of approximately $393,000 represents significant appreciation from 2010 levels, but this growth has pushed the market into overextended territory once again.
The combination of recurring crash patterns and current overextension creates particularly dangerous conditions for property owners. With prices operating 61.0% above sustainable levels and a clear history of multiple corrections including a devastating 10.5% drop, Middletown exhibits the classic warning signs of a market poised for another downturn. The town’s previous experience with double-digit crashes provides a template for how quickly values can decline when market conditions shift.
9. Amagansett – Crash Risk Percentage: 74.15%
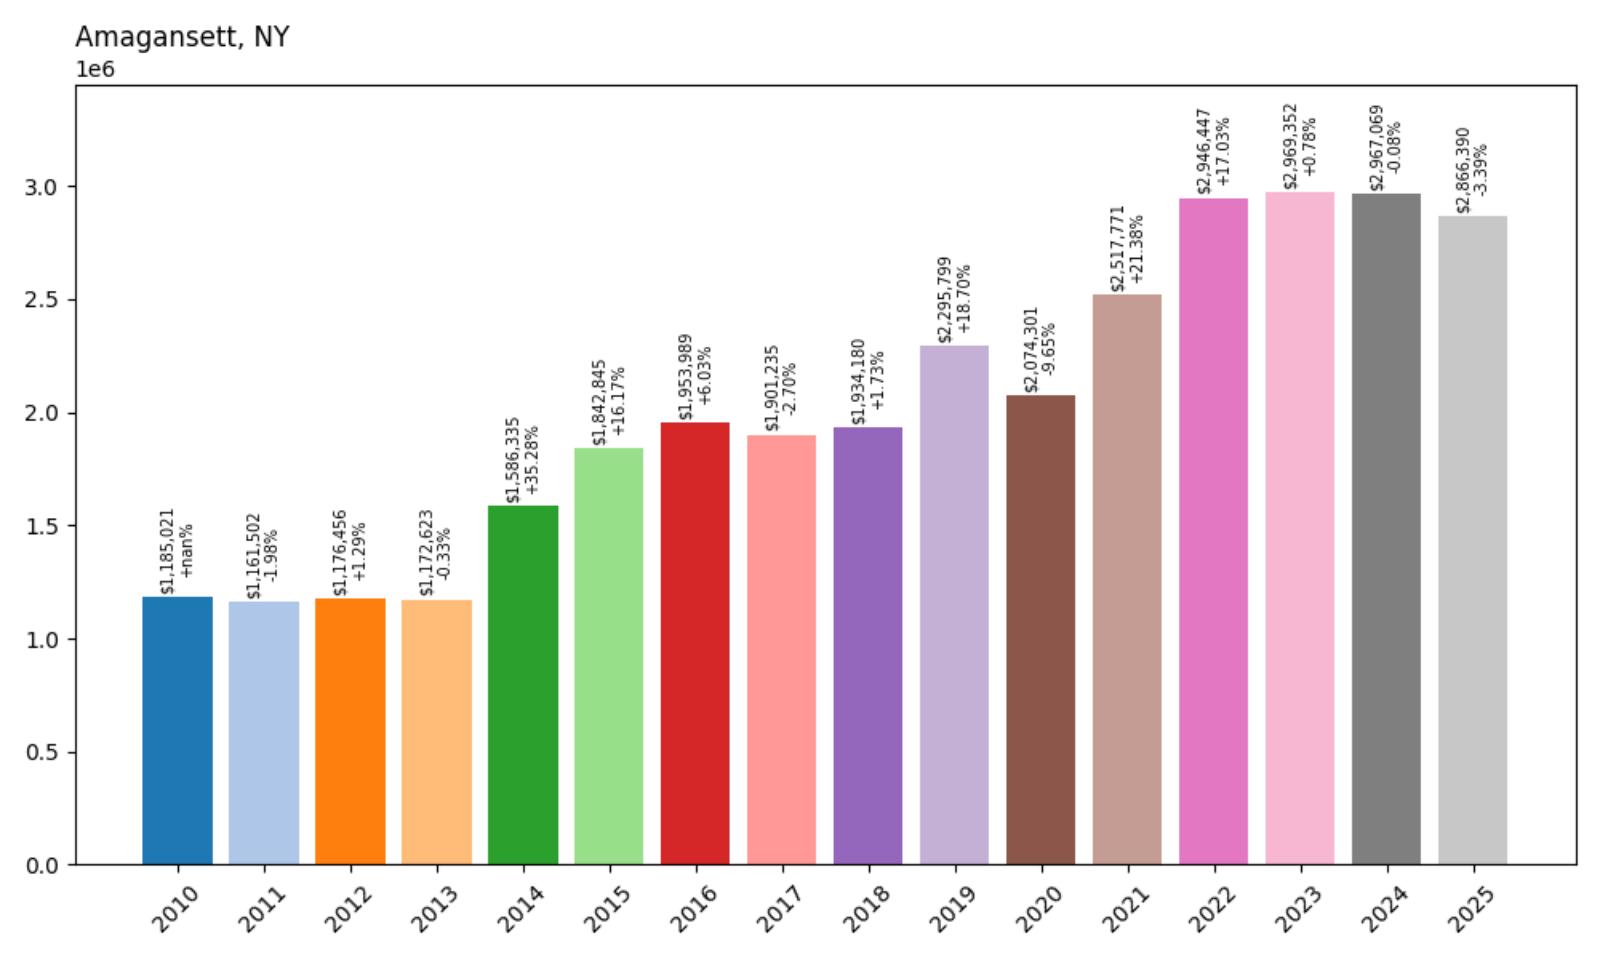
- Crash Risk Percentage: 74.15%
- Historical crashes (8%+ drops): 1
- Worst historical crash: 9.6% (2020)
- Total price increase since 2010: 141.9%
- Overextended above long-term average: 40.9%
- Price volatility (annual swings): 12.2%
- Current 2025 price: $2,866,390
Amagansett represents one of the most expensive and volatile markets in our analysis, with a median price approaching $2.9 million and extreme volatility of 12.2%. The town’s 141.9% price increase since 2010 has created conditions that appear unsustainable even for this premium Hamptons market. The 9.6% crash in 2020 demonstrates that even ultra-high-end markets are vulnerable to correction, while the extreme volatility indicates a market driven by speculation rather than stable demand.
Amagansett – Hamptons’ Most Volatile Market

Located in the heart of the Hamptons on Long Island’s East End, Amagansett has become one of the most expensive residential markets in the United States, with median prices approaching $2.9 million. The town’s transformation into an ultra-luxury destination has driven unprecedented price appreciation, but the 12.2% annual volatility indicates a market that operates more like a financial instrument than a stable housing market. The 2020 crash of 9.6% occurred during what was supposed to be a peak period for Hamptons real estate, demonstrating the market’s fundamental instability.
Despite its premium positioning, Amagansett exhibits concerning signs of speculative excess that make it vulnerable to significant corrections. The town’s dependence on ultra-wealthy second-home buyers and speculative investment creates conditions where sentiment shifts can trigger rapid price movements. With prices having increased 141.9% since 2010 and operating with extreme volatility, the market faces the challenge of maintaining values that may have disconnected from even ultra-high-net-worth buyer capacity during economic uncertainty.
8. Kiamesha Lake – Crash Risk Percentage: 75.15%
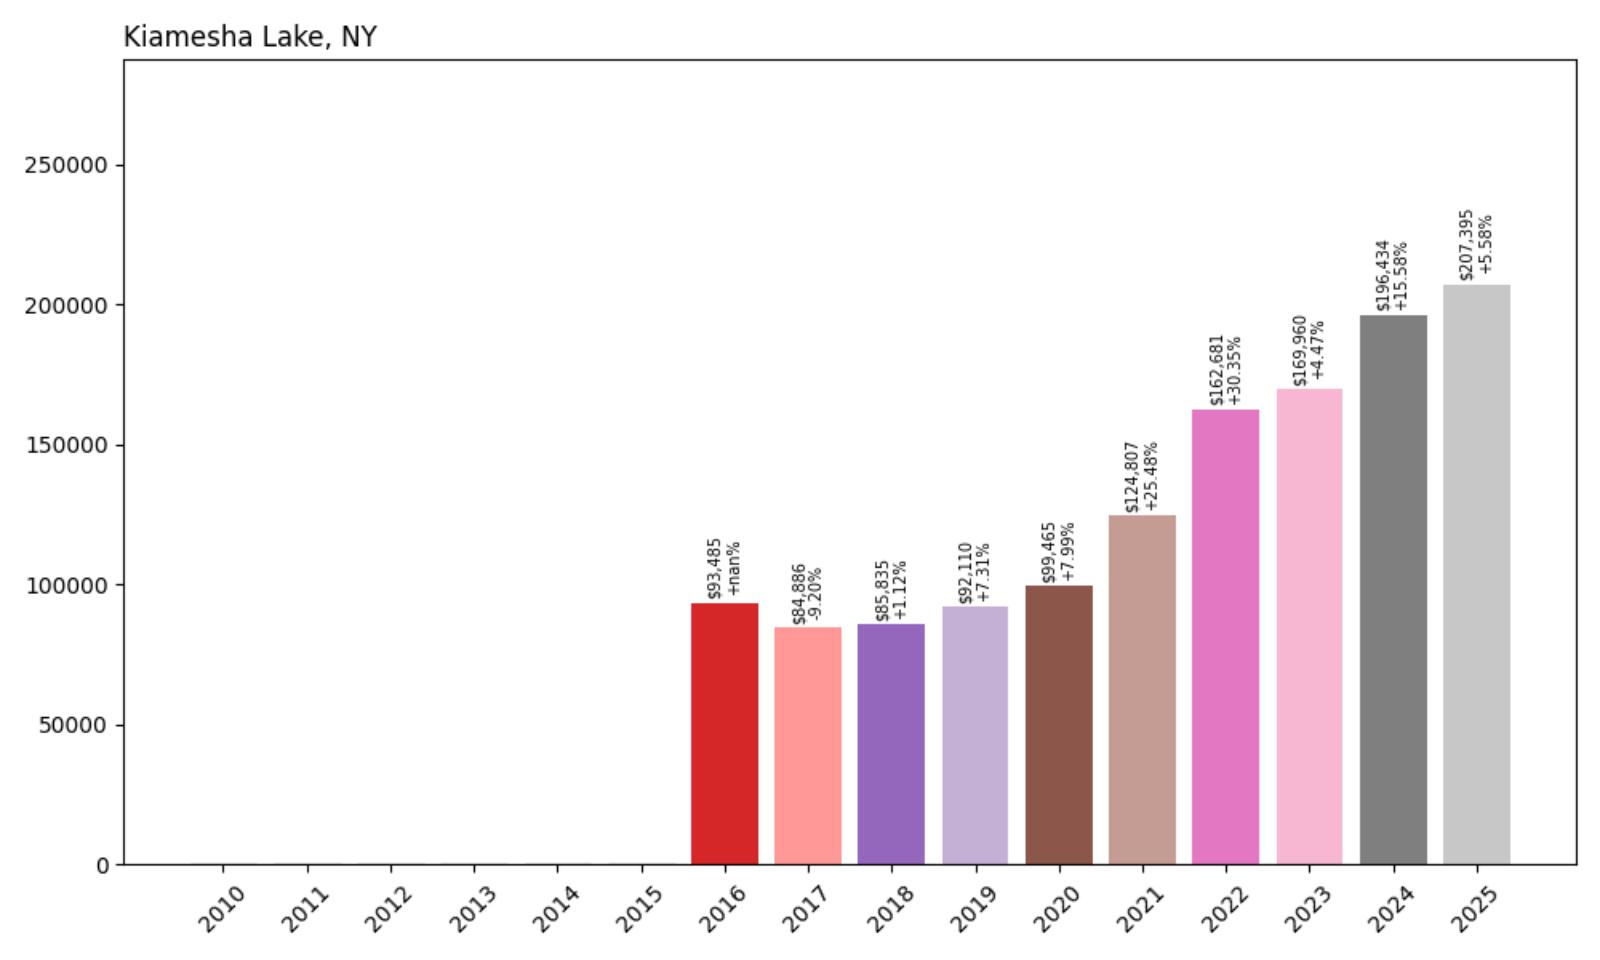
- Crash Risk Percentage: 75.15%
- Historical crashes (8%+ drops): 1
- Worst historical crash: 9.2% (2017)
- Total price increase since 2016: 121.8%
- Overextended above long-term average: 57.5%
- Price volatility (annual swings): 12.2%
- Current 2025 price: $207,395
Kiamesha Lake presents particularly dangerous market conditions with extreme price appreciation of 121.8% since 2016 and devastating volatility of 12.2%. The town’s 9.2% crash in 2017 demonstrates the market’s vulnerability to rapid corrections, while the current 57.5% overextension above historical averages suggests conditions ripe for another significant downturn. The extreme volatility indicates a market driven by speculation rather than fundamental demand.
Kiamesha Lake – Sullivan County’s Speculative Hotspot
Located in Sullivan County’s Catskill region, Kiamesha Lake has experienced some of the most extreme price swings in our analysis, with values more than doubling since 2016. The town’s current median price of approximately $207,000 represents dramatic appreciation from its affordable rural roots, creating conditions that appear fundamentally disconnected from local economic capacity. The 2017 correction of 9.2% provides historical context for how quickly this volatile market can unravel.
The combination of extreme price appreciation and devastating volatility creates particularly dangerous conditions for property owners. With prices operating 57.5% above sustainable levels and annual swings of 12.2%, Kiamesha Lake exhibits the classic warning signs of a speculative bubble. The town’s dependence on external buyers and speculative interest makes it particularly vulnerable to rapid corrections when market sentiment shifts.
7. Amityville – Crash Risk Percentage: 77.40%
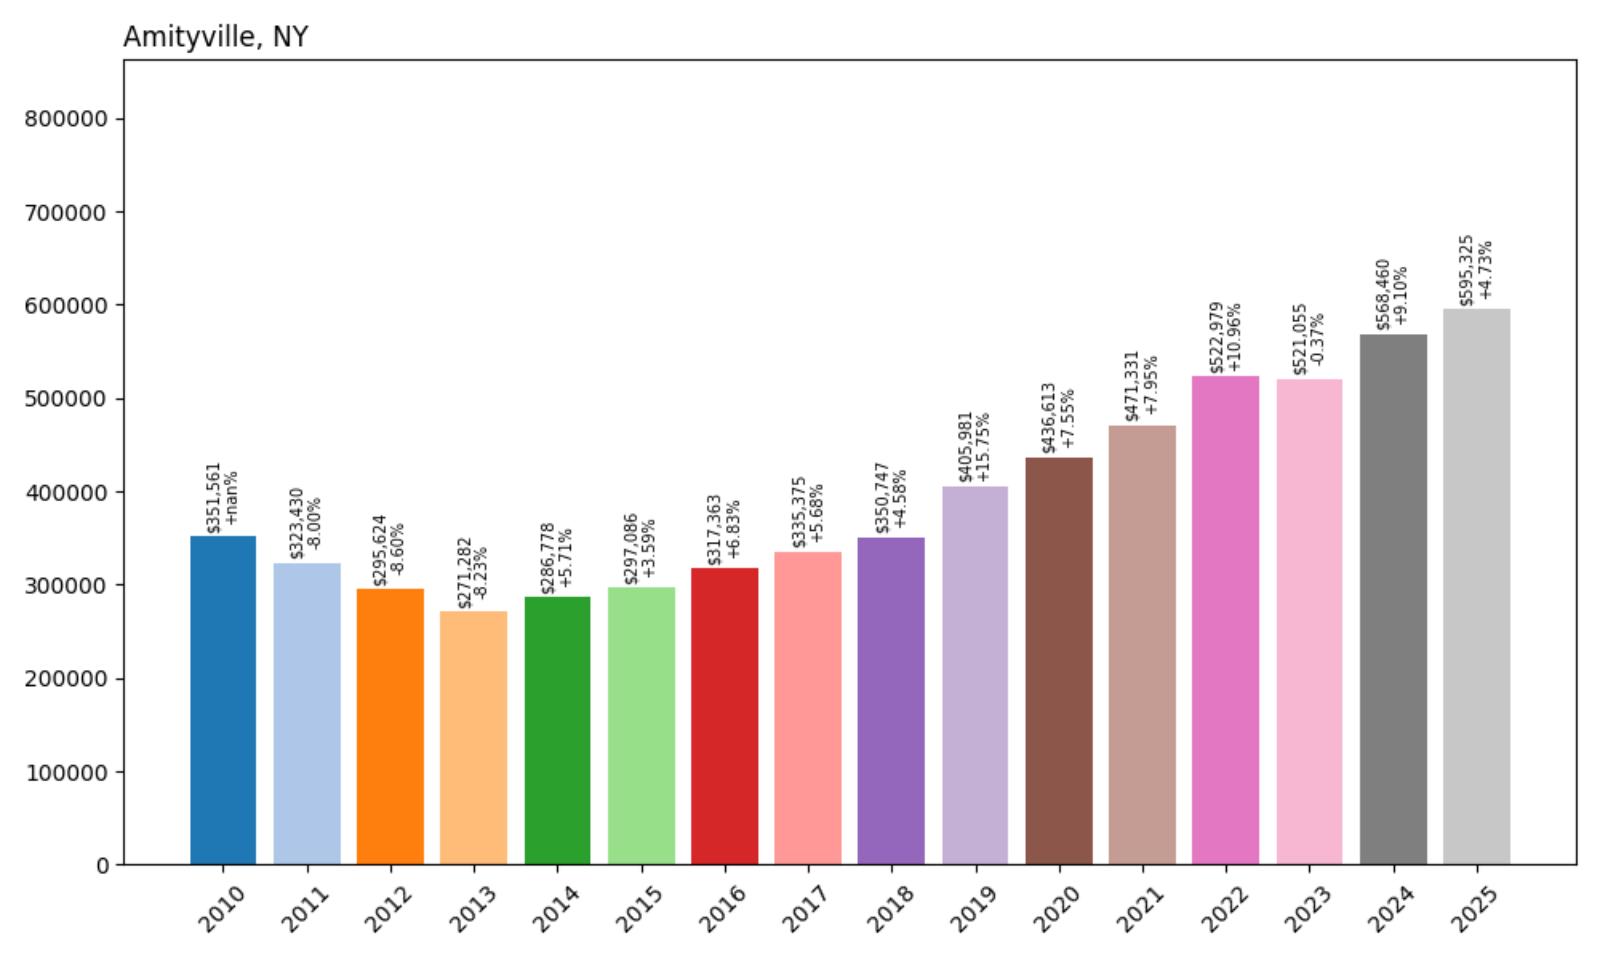
- Crash Risk Percentage: 77.40%
- Historical crashes (8%+ drops): 3
- Worst historical crash: 8.6% (2012)
- Total price increase since 2010: 69.3%
- Overextended above long-term average: 50.0%
- Price volatility (annual swings): 7.2%
- Current 2025 price: $595,325
Amityville demonstrates one of the most concerning crash patterns in our analysis, with three historical crashes indicating a market that repeatedly experiences significant corrections. The town’s 69.3% price increase since 2010 has pushed values 50.0% above their long-term average, creating conditions similar to those that preceded previous downturns. The history of multiple crashes establishes a clear pattern of boom-bust cycles that suggests elevated risk for future corrections.
Amityville – Suffolk County’s Serial Crasher
Located in Suffolk County on Long Island, Amityville has established the most concerning crash pattern in our analysis, with three separate historical corrections demonstrating a market that repeatedly experiences significant downturns. The town’s current median price of approximately $595,000 represents substantial appreciation from 2010 levels, but this growth has pushed the market into overextended territory once again. The history of multiple crashes, including an 8.6% drop in 2012, provides clear precedent for the severity of corrections that can occur.
The combination of recurring crash patterns and current overextension creates particularly dangerous conditions for property owners. With prices operating 50.0% above sustainable levels and a clear history of multiple corrections, Amityville exhibits the classic warning signs of a market poised for another downturn. The town’s previous experience with repeated crashes provides a template for how cyclical and severe corrections can be when market conditions shift.
6. Accord – Crash Risk Percentage: 78.85%
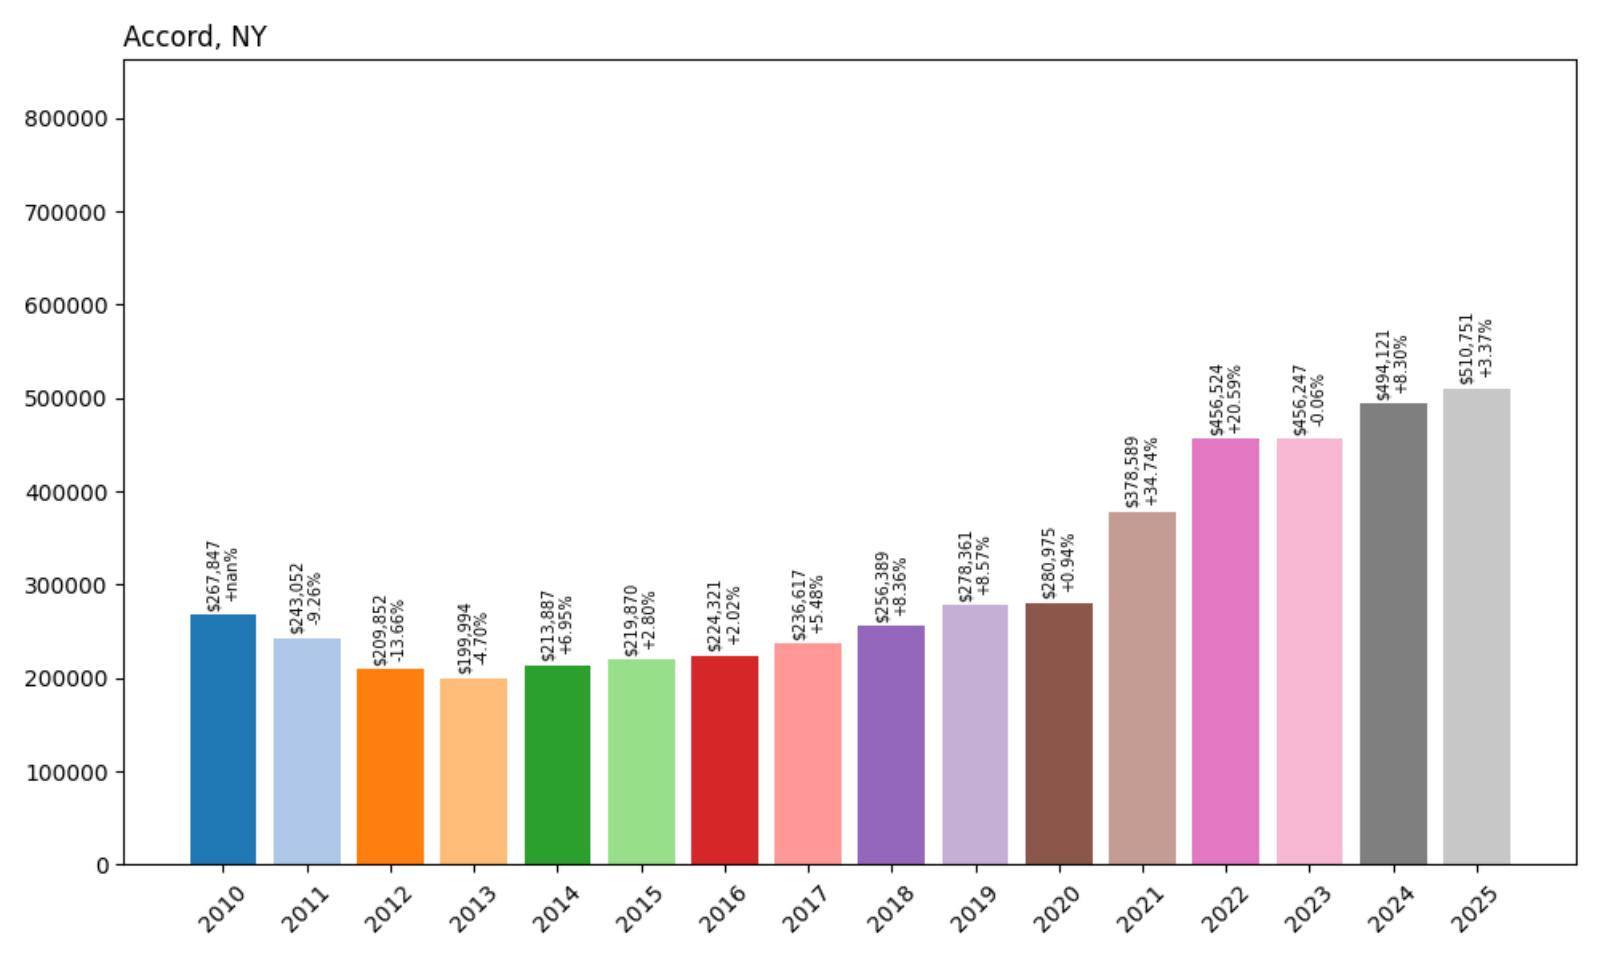
- Crash Risk Percentage: 78.85%
- Historical crashes (8%+ drops): 2
- Worst historical crash: 13.7% (2012)
- Total price increase since 2010: 90.7%
- Overextended above long-term average: 65.8%
- Price volatility (annual swings): 11.6%
- Current 2025 price: $510,751
Accord presents one of the most dangerous combinations in our analysis, with two historical crashes including a devastating 13.7% drop in 2012 and current prices operating 65.8% above sustainable levels. The town’s 90.7% price increase since 2010 has created extreme overextension, while the 11.6% annual volatility indicates a highly unstable market. These conditions suggest elevated risk for another significant correction.
Accord – Ulster County’s Most Dangerous Market
Located in Ulster County’s scenic Hudson Valley region, Accord has experienced some of the most severe price swings in our analysis, with its 13.7% crash in 2012 representing one of the worst corrections in the region. The town’s current median price of approximately $511,000 represents dramatic appreciation from 2010 levels, creating conditions that appear fundamentally unsustainable. The combination of extreme historical crashes and high current volatility indicates a market that lacks stability.
The combination of extreme historical crashes and current overextension creates particularly dangerous conditions for property owners. With prices operating 65.8% above sustainable levels and a clear history of devastating corrections, Accord exhibits the classic warning signs of a market poised for another significant downturn. The town’s previous experience with double-digit crashes provides a template for the severity of corrections that can occur when market conditions shift.
5. Mastic – Crash Risk Percentage: 80.45%
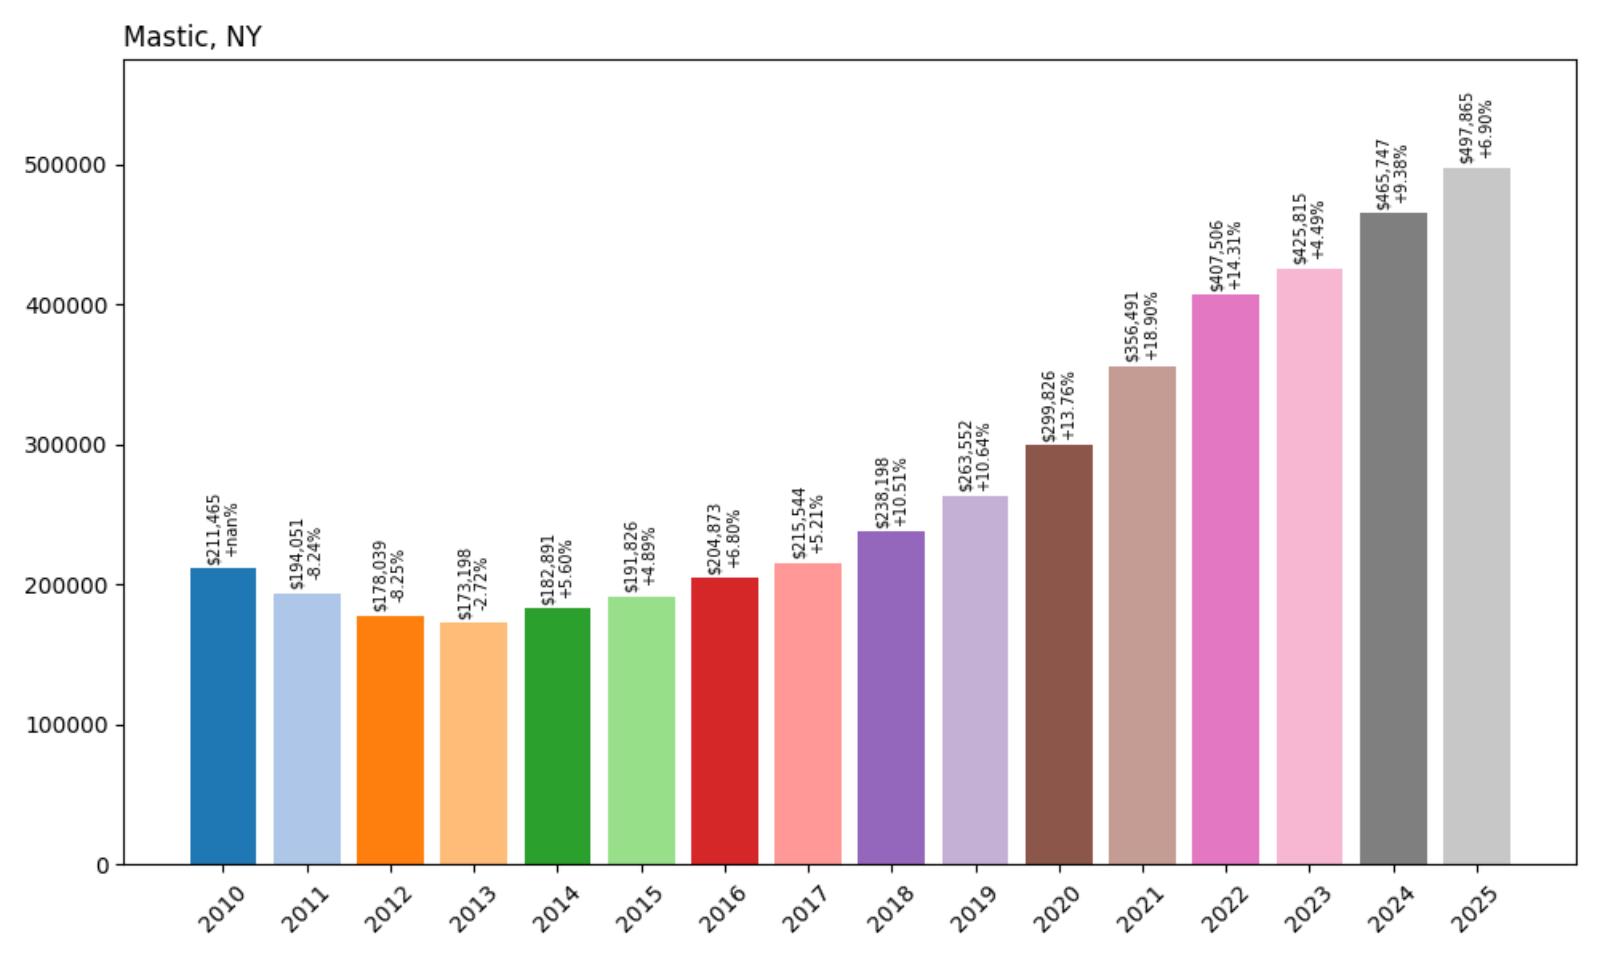
- Crash Risk Percentage: 80.45%
- Historical crashes (8%+ drops): 2
- Worst historical crash: 8.3% (2012)
- Total price increase since 2010: 135.4%
- Overextended above long-term average: 76.7%
- Price volatility (annual swings): 7.7%
- Current 2025 price: $497,865
Mastic represents one of the most extreme cases of overextension in our analysis, with prices operating 76.7% above their historical average and a staggering 135.4% increase since 2010. The town’s two historical crashes, including an 8.3% drop in 2012, demonstrate the market’s vulnerability to correction. The extreme overextension combined with historical crash patterns creates particularly dangerous conditions for potential downturn.
Mastic – Suffolk County’s Overextended Bubble
Located in Suffolk County on Long Island, Mastic has experienced one of the most extreme price appreciations in our analysis, with values more than doubling since 2010. The town’s current median price of approximately $498,000 represents a dramatic transformation from its affordable working-class roots, creating conditions that appear fundamentally disconnected from local economic capacity. The two historical crashes provide clear precedent for how this market behaves during corrections.
The extreme overextension of 76.7% above historical averages suggests that Mastic is operating in mathematically unsustainable territory. The town’s appeal to buyers seeking value on Long Island has created speculative conditions that appear driven more by external demand than local economic fundamentals. With prices having increased 135.4% since 2010, the market faces unprecedented imbalances that historical data suggests cannot be maintained.
4. Napanoch – Crash Risk Percentage: 83.15%
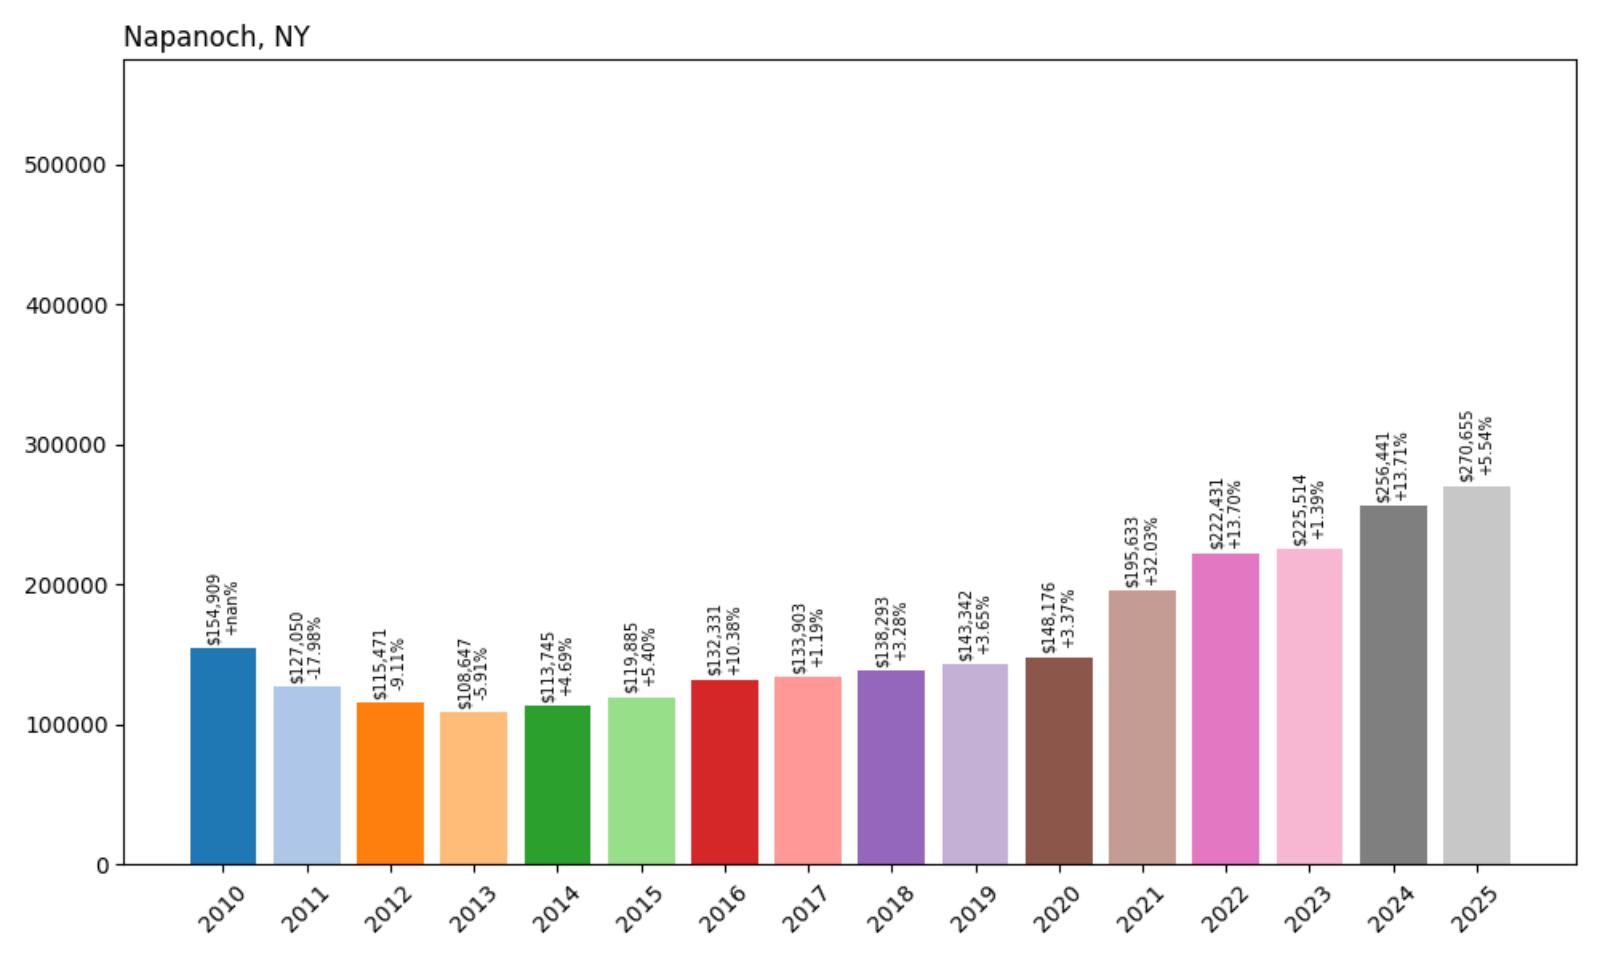
- Crash Risk Percentage: 83.15%
- Historical crashes (8%+ drops): 2
- Worst historical crash: 18.0% (2011)
- Total price increase since 2010: 74.7%
- Overextended above long-term average: 66.1%
- Price volatility (annual swings): 11.3%
- Current 2025 price: $270,655
Napanoch demonstrates the most severe historical crash in our analysis, with a devastating 18.0% drop in 2011 that provides stark evidence of how quickly this market can unravel. The town’s 74.7% price increase since 2010 has pushed values 66.1% above their long-term average, creating conditions similar to those that preceded the previous catastrophic correction. The 11.3% annual volatility indicates ongoing market instability that contributes to the extreme crash risk.
Napanoch – Ulster County’s Crash Champion
Located in Ulster County, Napanoch holds the unfortunate distinction of experiencing the most severe crash in our analysis, with the 18.0% drop in 2011 serving as a stark reminder of how quickly real estate values can collapse. The town’s current median price of approximately $271,000 represents significant appreciation from 2010 levels, but this growth has pushed the market into the same overextended territory that preceded the previous catastrophic correction. The high volatility of 11.3% indicates a market that continues to lack stability.
The combination of the most extreme historical crash and current overextension creates particularly dangerous conditions for property owners. With prices operating 66.1% above sustainable levels and a clear history of devastating corrections, Napanoch exhibits the classic warning signs of a market poised for another significant downturn. The town’s previous experience with an 18% crash provides a template for the severity of corrections that can occur when market conditions shift.
3. Monticello – Crash Risk Percentage: 84.95%
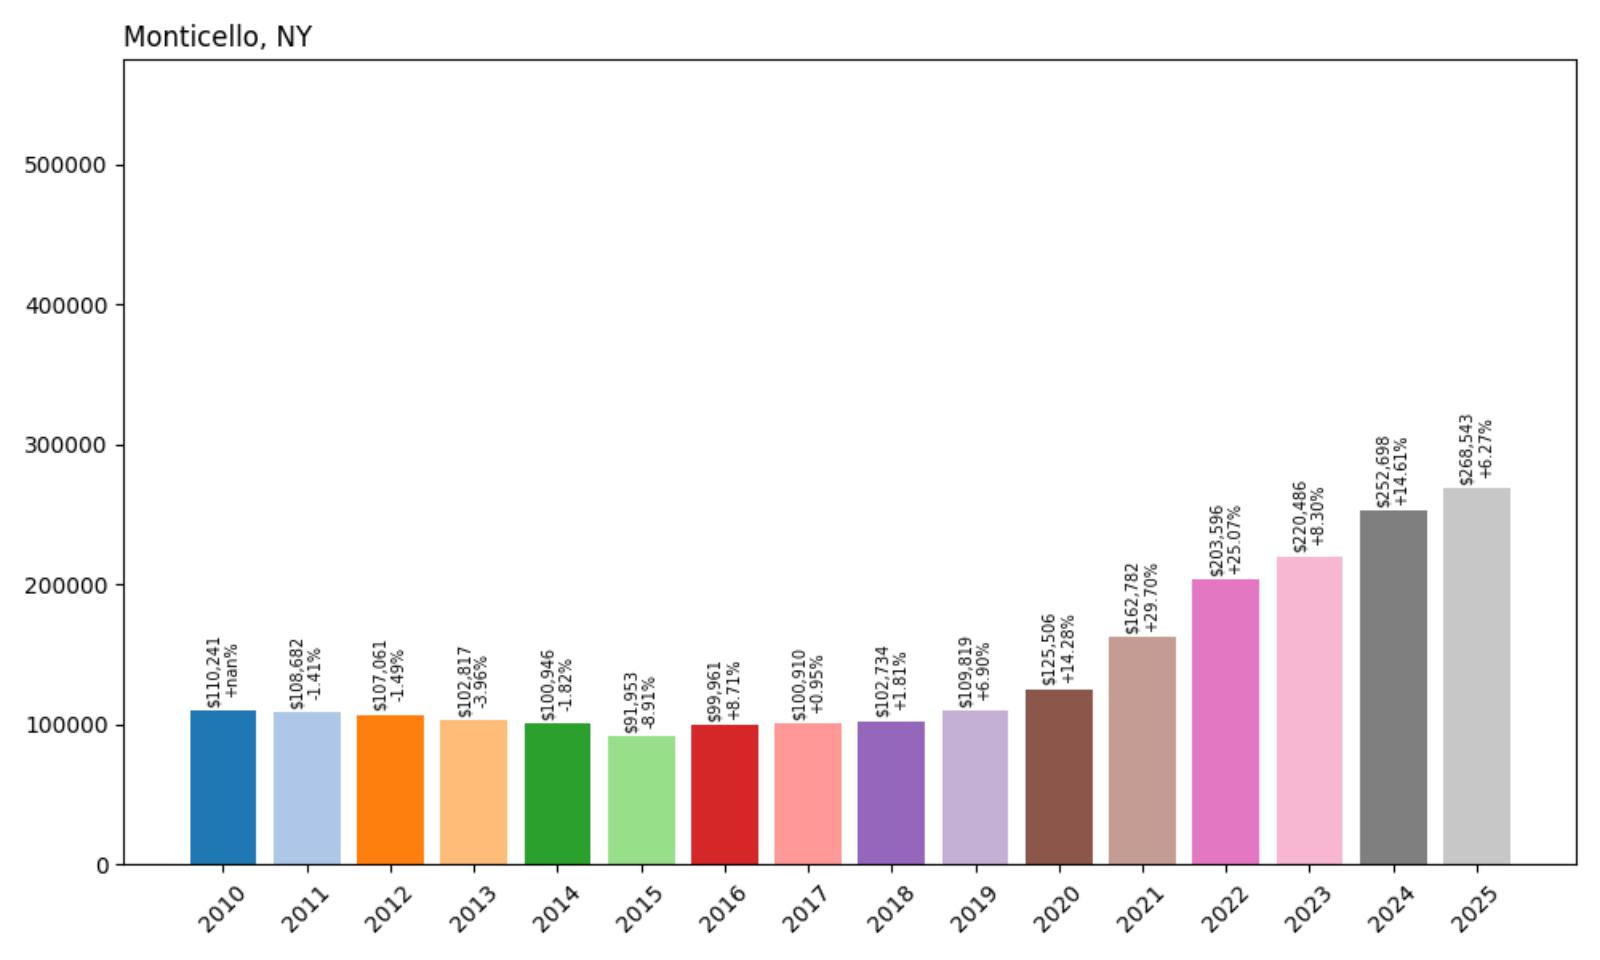
- Crash Risk Percentage: 84.95%
- Historical crashes (8%+ drops): 1
- Worst historical crash: 8.9% (2015)
- Total price increase since 2010: 143.6%
- Overextended above long-term average: 89.4%
- Price volatility (annual swings): 10.7%
- Current 2025 price: $268,543
Monticello presents one of the most extreme cases of overextension in our analysis, with prices operating 89.4% above their historical average and a staggering 143.6% increase since 2010. The town’s 8.9% crash in 2015 demonstrates the market’s vulnerability to correction, while the extreme overextension and 10.7% annual volatility suggest conditions ripe for a significant downturn. These conditions create one of the highest crash risks in our analysis.
Monticello – Sullivan County’s Most Overextended Market
Located in Sullivan County’s Catskill region, Monticello has experienced one of the most extreme price appreciations in our analysis, with values more than doubling since 2010. The town’s current median price of approximately $269,000 represents a dramatic transformation from its affordable rural roots, creating conditions that appear fundamentally disconnected from local economic capacity. The 2015 correction of 8.9% provides historical context for how this volatile market can unravel.
The extreme overextension of 89.4% above historical averages suggests that Monticello is operating in mathematically unsustainable territory. The town’s transformation during the pandemic from an affordable rural community to a high-priced market represents a fundamental shift that may not be sustainable as remote work trends evolve. With prices having increased 143.6% since 2010 and operating with high volatility, the market faces unprecedented imbalances that historical data suggests cannot be maintained.
2. Celoron – Crash Risk Percentage: 85.85%
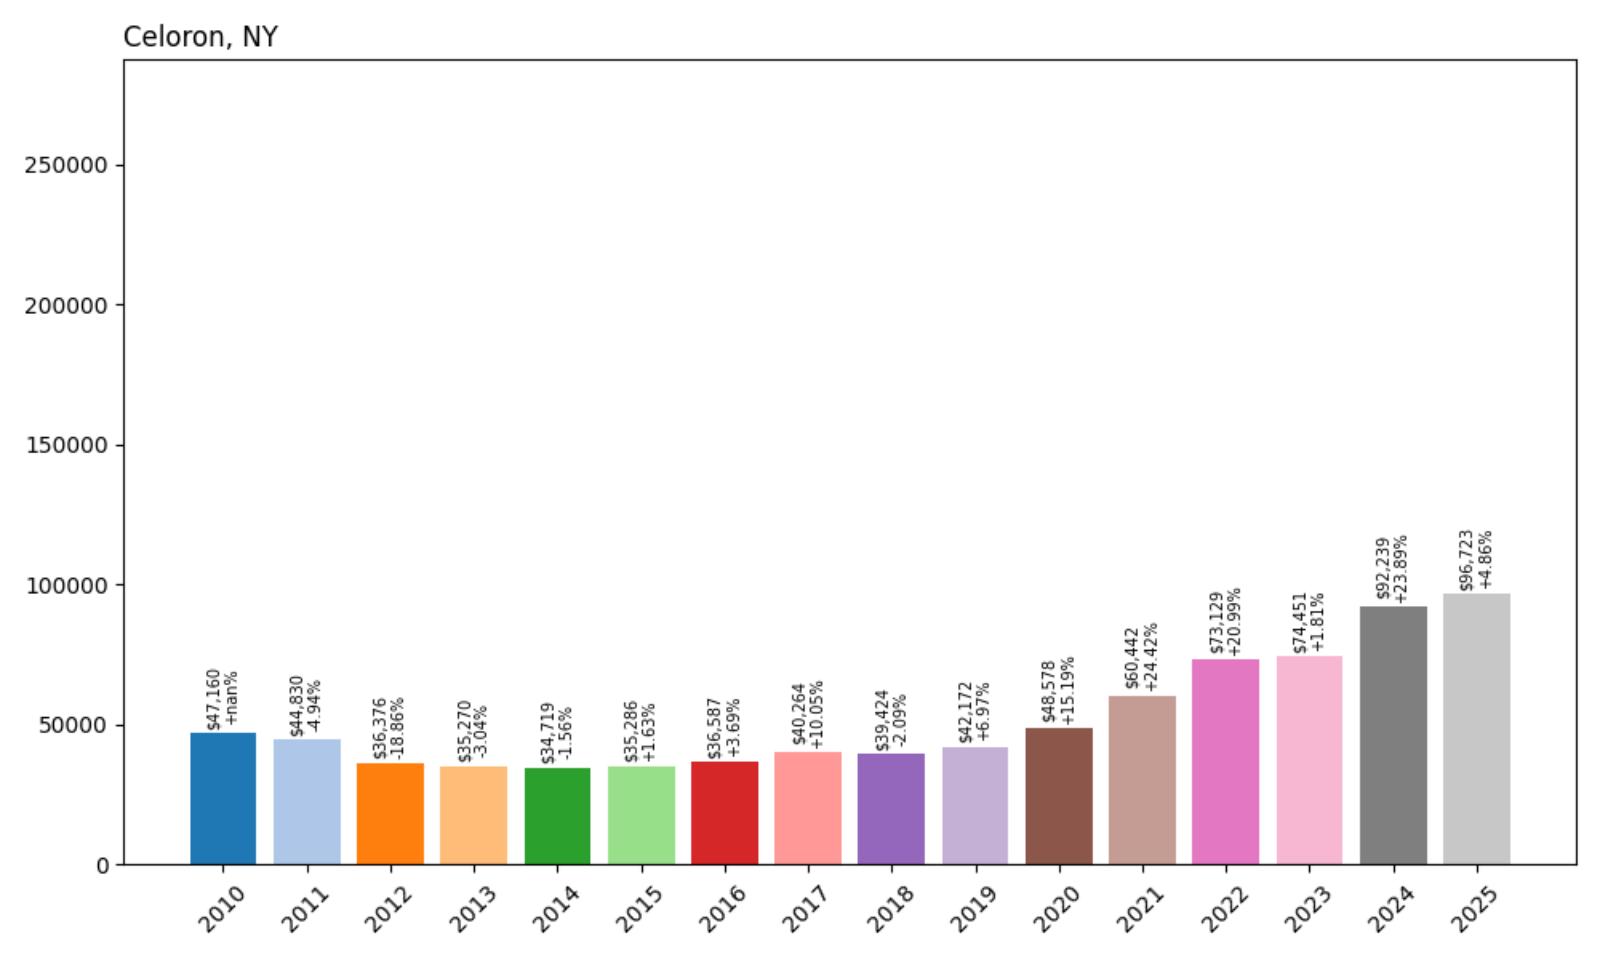
- Crash Risk Percentage: 85.85%
- Historical crashes (8%+ drops): 1
- Worst historical crash: 18.9% (2012)
- Total price increase since 2010: 105.1%
- Overextended above long-term average: 84.8%
- Price volatility (annual swings): 11.9%
- Current 2025 price: $96,723
Celoron demonstrates the most severe historical crash in our analysis, with a catastrophic 18.9% drop in 2012 that provides stark evidence of how quickly this market can collapse. The town’s 105.1% price increase since 2010 has pushed values 84.8% above their long-term average, creating conditions similar to those that preceded the previous devastating correction. The 11.9% annual volatility indicates ongoing market instability that contributes to the extreme crash risk.
Celoron – Chautauqua County’s Crash King
Located in Chautauqua County near the Pennsylvania border, Celoron holds the distinction of experiencing the most severe crash in our analysis, with the 18.9% drop in 2012 serving as a stark reminder of how quickly real estate values can collapse in smaller markets. The town’s current median price of approximately $97,000 represents significant appreciation from 2010 levels, but this growth has pushed the market into the same overextended territory that preceded the previous catastrophic correction. The high volatility of 11.9% indicates a market that continues to lack stability.
The combination of the most extreme historical crash and current overextension creates particularly dangerous conditions for property owners. With prices operating 84.8% above sustainable levels and a clear history of devastating corrections, Celoron exhibits the classic warning signs of a market poised for another significant downturn. The town’s previous experience with a nearly 19% crash provides a template for the severity of corrections that can occur when market conditions shift, particularly in smaller markets that can experience more dramatic swings.
1. Ellenville – Crash Risk Percentage: 86.75%
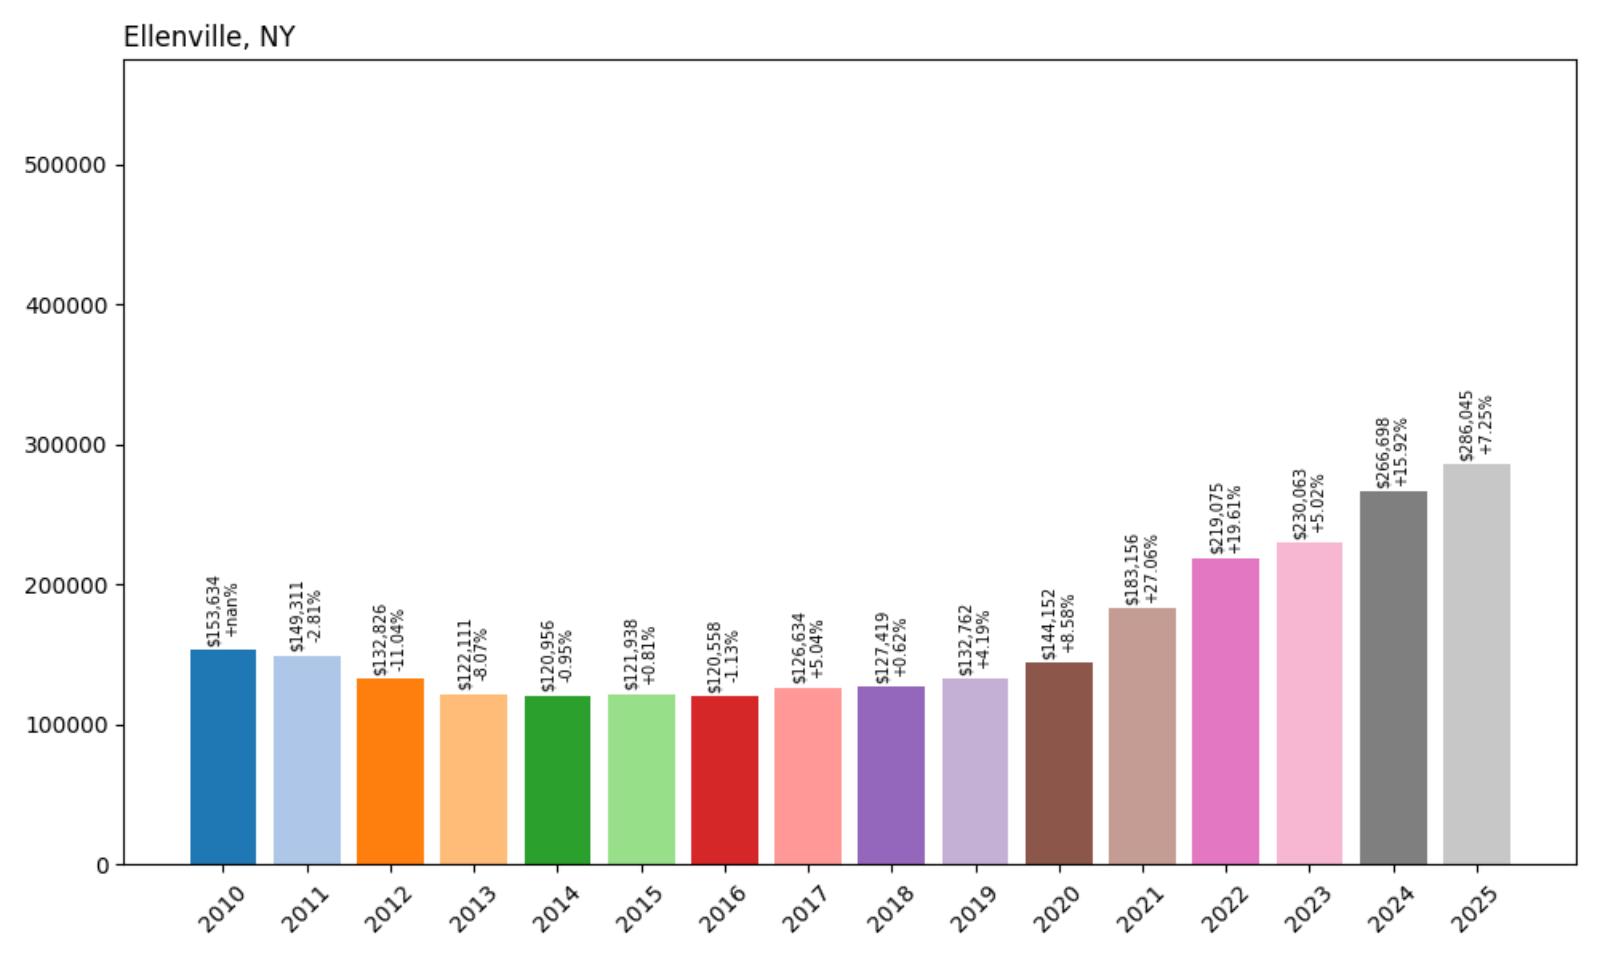
- Crash Risk Percentage: 86.75%
- Historical crashes (8%+ drops): 2
- Worst historical crash: 11.0% (2012)
- Total price increase since 2010: 86.2%
- Overextended above long-term average: 73.5%
- Price volatility (annual swings): 10.1%
- Current 2025 price: $286,045
Ellenville tops our list with the highest crash risk, driven by a combination of extreme overextension, devastating historical volatility, and recurring boom-bust cycles that suggest imminent correction risks. The town’s two historical crashes, including an 11.0% drop in 2012, demonstrate a market that repeatedly experiences significant corrections. The 86.2% price increase since 2010 has pushed values 73.5% above their long-term average, creating conditions that appear mathematically unsustainable.
Ellenville – Ulster County’s Most Vulnerable Market

Located in Ulster County’s scenic Hudson Valley region, Ellenville has experienced some of the most extreme price swings in our analysis, with its two historical crashes demonstrating a market that repeatedly experiences significant corrections. The town’s current median price of approximately $286,000 represents dramatic appreciation from 2010 levels, creating conditions that appear fundamentally disconnected from local economic capacity. The 11.0% crash in 2012 provides historical context for how this volatile market can unravel.
The extreme overextension of 73.5% above historical averages suggests that Ellenville is operating in mathematically unsustainable territory. The town’s transformation during the pandemic from an affordable rural community to a market approaching $286,000 median prices represents a fundamental shift that may not be sustainable as remote work trends evolve. With prices having increased 86.2% since 2010 and showing high volatility of 10.1%, the market faces unprecedented imbalances that historical data suggests cannot be maintained, making it the most vulnerable market in our analysis.