
In New Hampshire, the price of a good view now comes with a side of sticker shock. The Zillow Home Value Index shows home prices soaring in 38 towns—especially along the coast and around lakes, where million-dollar listings are starting to look… normal. From old-money enclaves near the ocean to college towns and second-home retreats, these markets have become playgrounds for buyers with serious cash. Tax perks and scenic charm might help justify the cost, but if you’re hoping to buy in these places now? You’ll need more than mountain air and good credit.
38. Chester – 118% Home Price Increase Since 2010
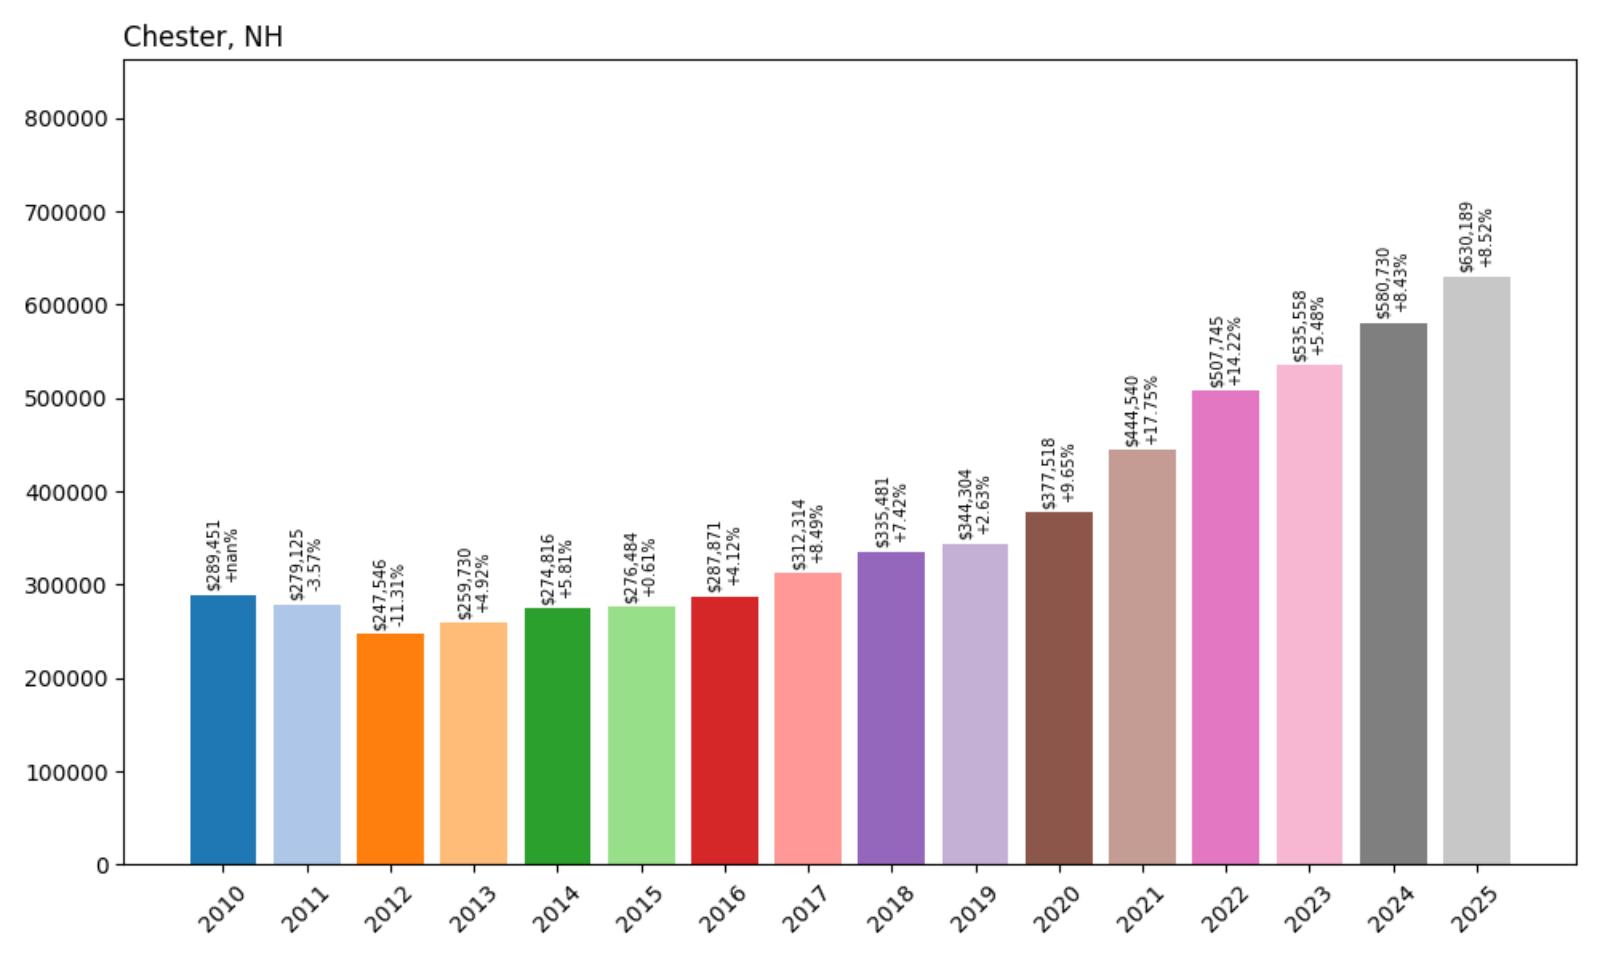
- 2010: $289,451
- 2011: $279,125 (-$10,326, -3.57% from previous year)
- 2012: $247,546 (-$31,579, -11.31% from previous year)
- 2013: $259,730 (+$12,184, +4.92% from previous year)
- 2014: $274,816 (+$15,086, +5.81% from previous year)
- 2015: $276,484 (+$1,667, +0.61% from previous year)
- 2016: $287,871 (+$11,387, +4.12% from previous year)
- 2017: $312,314 (+$24,443, +8.49% from previous year)
- 2018: $335,481 (+$23,167, +7.42% from previous year)
- 2019: $344,304 (+$8,823, +2.63% from previous year)
- 2020: $377,518 (+$33,214, +9.65% from previous year)
- 2021: $444,540 (+$67,022, +17.75% from previous year)
- 2022: $507,745 (+$63,205, +14.22% from previous year)
- 2023: $535,558 (+$27,813, +5.48% from previous year)
- 2024: $580,730 (+$45,171, +8.43% from previous year)
- 2025: $630,189 (+$49,459, +8.52% from previous year)
Chester’s housing market demonstrates remarkable resilience after weathering the early 2010s recession. The town experienced significant declines through 2012 before beginning a steady recovery that accelerated dramatically during the pandemic years. The most striking growth occurred between 2020 and 2022, when home values jumped nearly 35% in just two years, reflecting increased demand for rural properties during remote work trends.
Chester – Strong Recovery From Early 2010s Recession
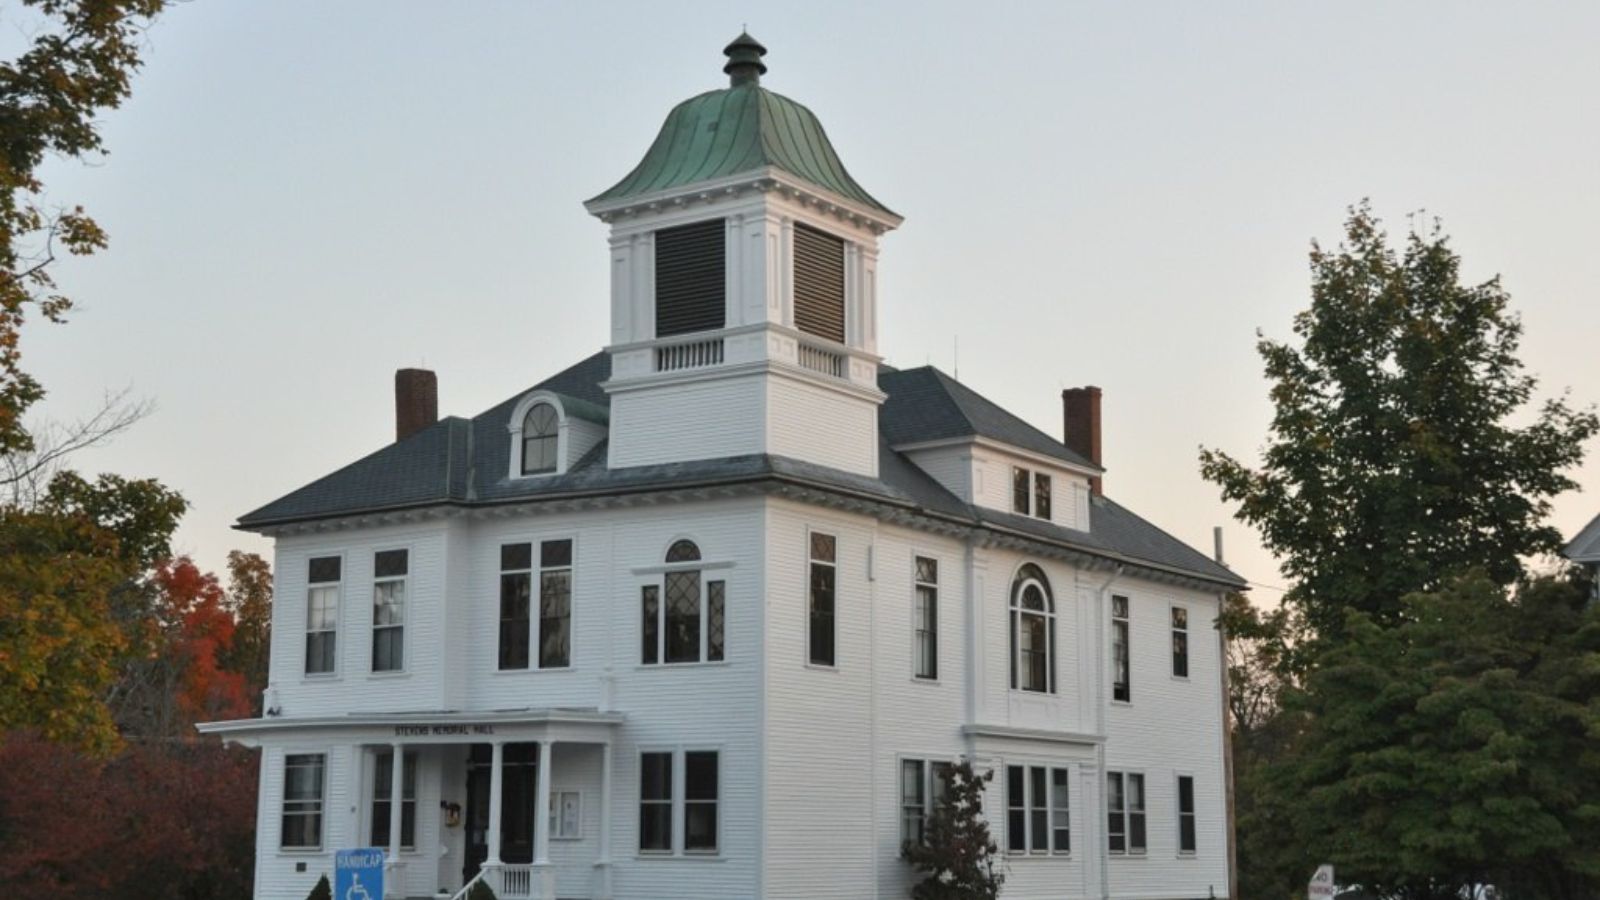
Chester, located in Rockingham County about 20 miles northwest of the Massachusetts border, represents a classic example of New Hampshire’s small-town appeal driving real estate demand. This historic community of approximately 5,000 residents offers the perfect blend of rural character and suburban convenience, with easy access to both Manchester and the Seacoast region. The town’s location along Route 102 provides excellent connectivity while maintaining its agricultural heritage and scenic landscapes.
The community’s steady growth reflects its appeal to families seeking affordable alternatives to more expensive coastal and southern New Hampshire markets. Chester’s relatively modest median home price of $630,189 makes it accessible compared to many other communities on this list, yet the 118% appreciation since 2010 demonstrates strong underlying demand. Local amenities include well-regarded schools, historic sites, and abundant outdoor recreation opportunities that contribute to its residential appeal.
37. New Boston – 112% Home Price Increase Since 2010
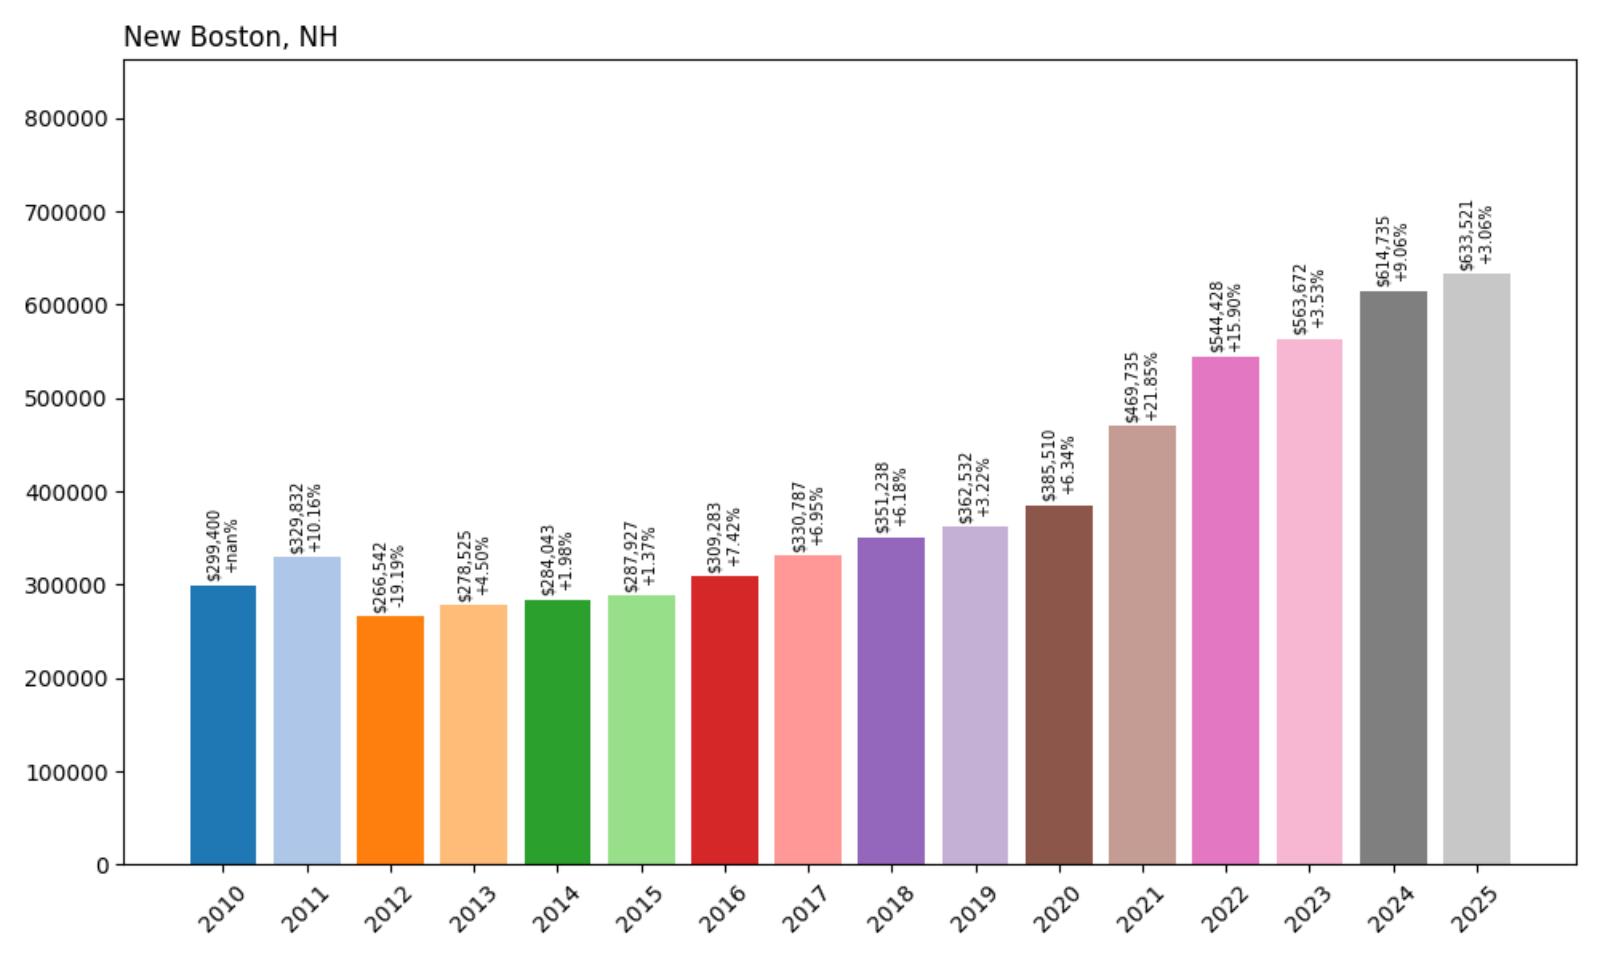
- 2010: $299,400
- 2011: $329,832 (+$30,432, +10.16% from previous year)
- 2012: $266,542 (-$63,290, -19.19% from previous year)
- 2013: $278,525 (+$11,984, +4.50% from previous year)
- 2014: $284,043 (+$5,518, +1.98% from previous year)
- 2015: $287,927 (+$3,884, +1.37% from previous year)
- 2016: $309,283 (+$21,356, +7.42% from previous year)
- 2017: $330,787 (+$21,504, +6.95% from previous year)
- 2018: $351,238 (+$20,450, +6.18% from previous year)
- 2019: $362,532 (+$11,294, +3.22% from previous year)
- 2020: $385,510 (+$22,978, +6.34% from previous year)
- 2021: $469,735 (+$84,225, +21.85% from previous year)
- 2022: $544,428 (+$74,693, +15.90% from previous year)
- 2023: $563,672 (+$19,243, +3.53% from previous year)
- 2024: $614,735 (+$51,063, +9.06% from previous year)
- 2025: $633,521 (+$18,786, +3.06% from previous year)
New Boston’s housing market experienced severe volatility in the early 2010s, including a devastating 19% decline in 2012 that brought values below 2010 levels. However, the subsequent recovery has been impressive, with particularly strong gains during 2021 and 2022 when home values increased by over 40% in two years. The current median price of $633,521 represents more than double the 2012 low point, highlighting the market’s dramatic transformation.
New Boston – Benefiting From Manchester Metro Growth
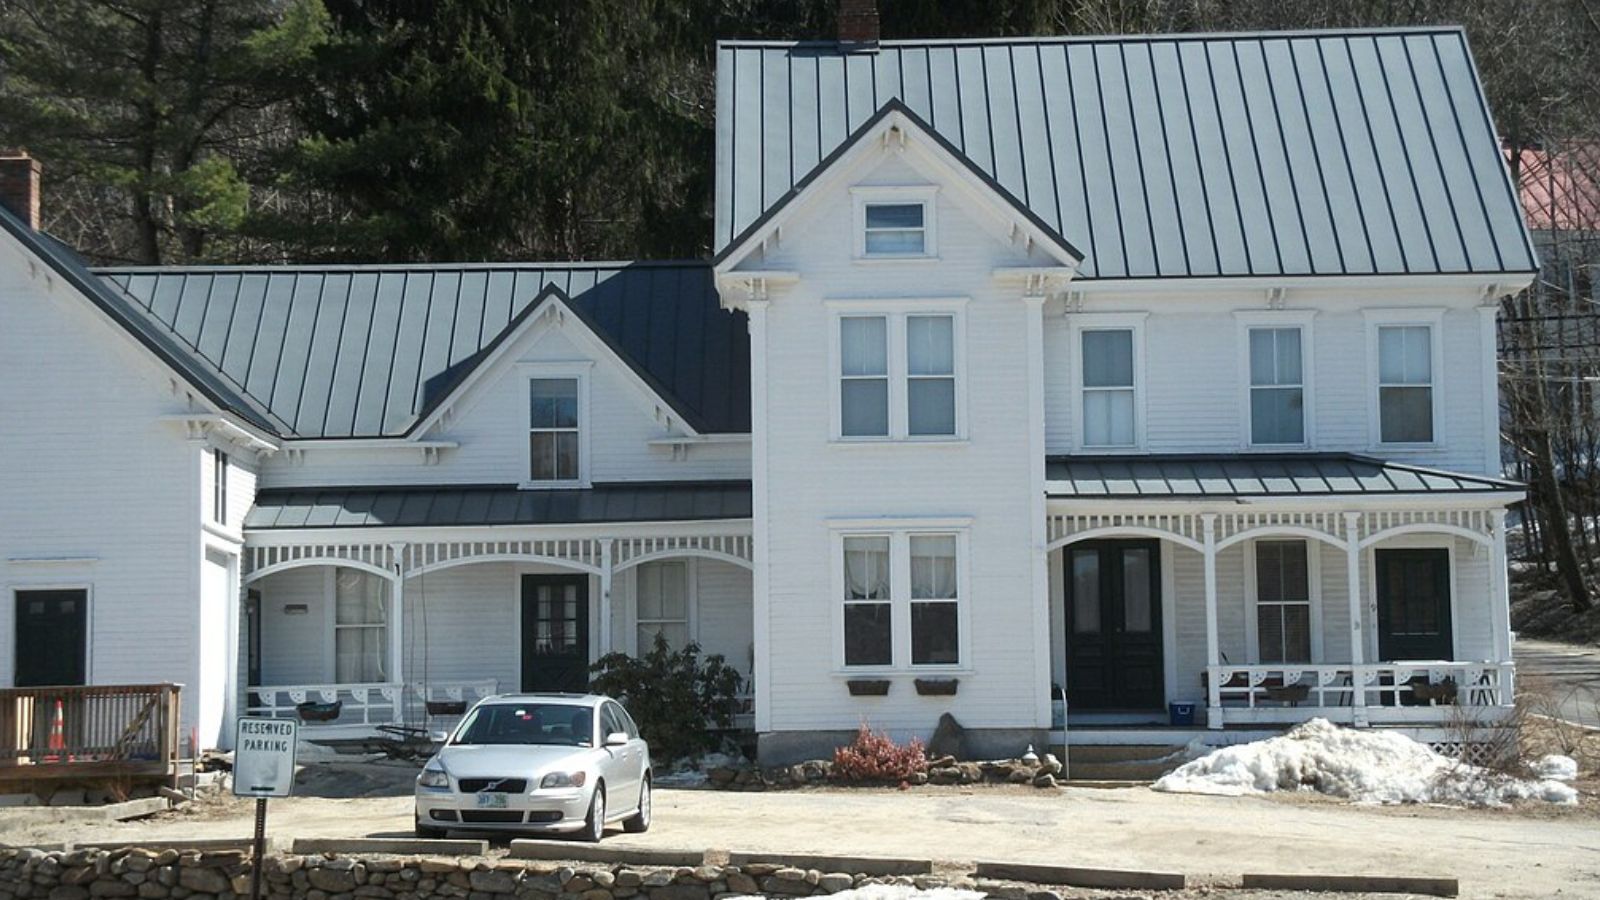
New Boston sits strategically in Hillsborough County, positioned between Manchester and the Massachusetts border in a location that offers both suburban convenience and rural charm. This town of approximately 6,000 residents has become increasingly attractive to professionals working in Manchester or commuting to the Boston area. The community maintains its historic New England character while accommodating steady residential growth driven by its excellent school system and family-friendly atmosphere.
The town’s real estate market reflects broader trends in southern New Hampshire, where proximity to major employment centers drives residential demand. New Boston offers larger lot sizes and more affordable housing options compared to communities closer to Manchester, making it particularly appealing to families seeking space and value. The area’s rural roads, historic buildings, and outdoor recreation opportunities provide quality of life amenities that justify premium pricing.
36. Tuftonboro – 127% Home Price Increase Since 2010

- 2010: $281,583
- 2011: $276,311 (-$5,273, -1.87% from previous year)
- 2012: $286,329 (+$10,018, +3.63% from previous year)
- 2013: $278,581 (-$7,748, -2.71% from previous year)
- 2014: $281,192 (+$2,611, +0.94% from previous year)
- 2015: $293,160 (+$11,968, +4.26% from previous year)
- 2016: $294,080 (+$920, +0.31% from previous year)
- 2017: $305,717 (+$11,636, +3.96% from previous year)
- 2018: $330,962 (+$25,245, +8.26% from previous year)
- 2019: $350,138 (+$19,176, +5.79% from previous year)
- 2020: $387,952 (+$37,814, +10.80% from previous year)
- 2021: $505,227 (+$117,275, +30.23% from previous year)
- 2022: $592,027 (+$86,800, +17.18% from previous year)
- 2023: $578,080 (-$13,947, -2.36% from previous year)
- 2024: $646,385 (+$68,305, +11.82% from previous year)
- 2025: $640,569 (-$5,816, -0.90% from previous year)
Tuftonboro’s housing market remained relatively stable through the mid-2010s before experiencing explosive growth starting in 2020. The most remarkable period occurred in 2021, when home values increased by over 30% in a single year, reflecting intense demand for lakefront and rural properties during the pandemic. Despite slight declines in 2023 and 2025, the overall trajectory shows homes more than doubling in value since 2010.
Tuftonboro – Lake Winnipesaukee Premium Properties
Tuftonboro occupies prime real estate along the shores of Lake Winnipesaukee in Carroll County, making it one of New Hampshire’s most desirable lakefront communities. This town of approximately 2,500 residents offers an exceptional combination of natural beauty, recreational opportunities, and seasonal appeal that drives significant real estate demand. The community’s location on the lake’s eastern shore provides access to some of the most pristine and sought-after waterfront properties in the region.
The town’s real estate market benefits enormously from its lakefront location, with waterfront properties commanding premium prices that significantly influence the overall median home value. Tuftonboro attracts both year-round residents and seasonal property owners seeking vacation homes and investment properties. The area’s natural amenities include not only Lake Winnipesaukee but also numerous smaller ponds, hiking trails, and conservation areas that enhance property values throughout the community.
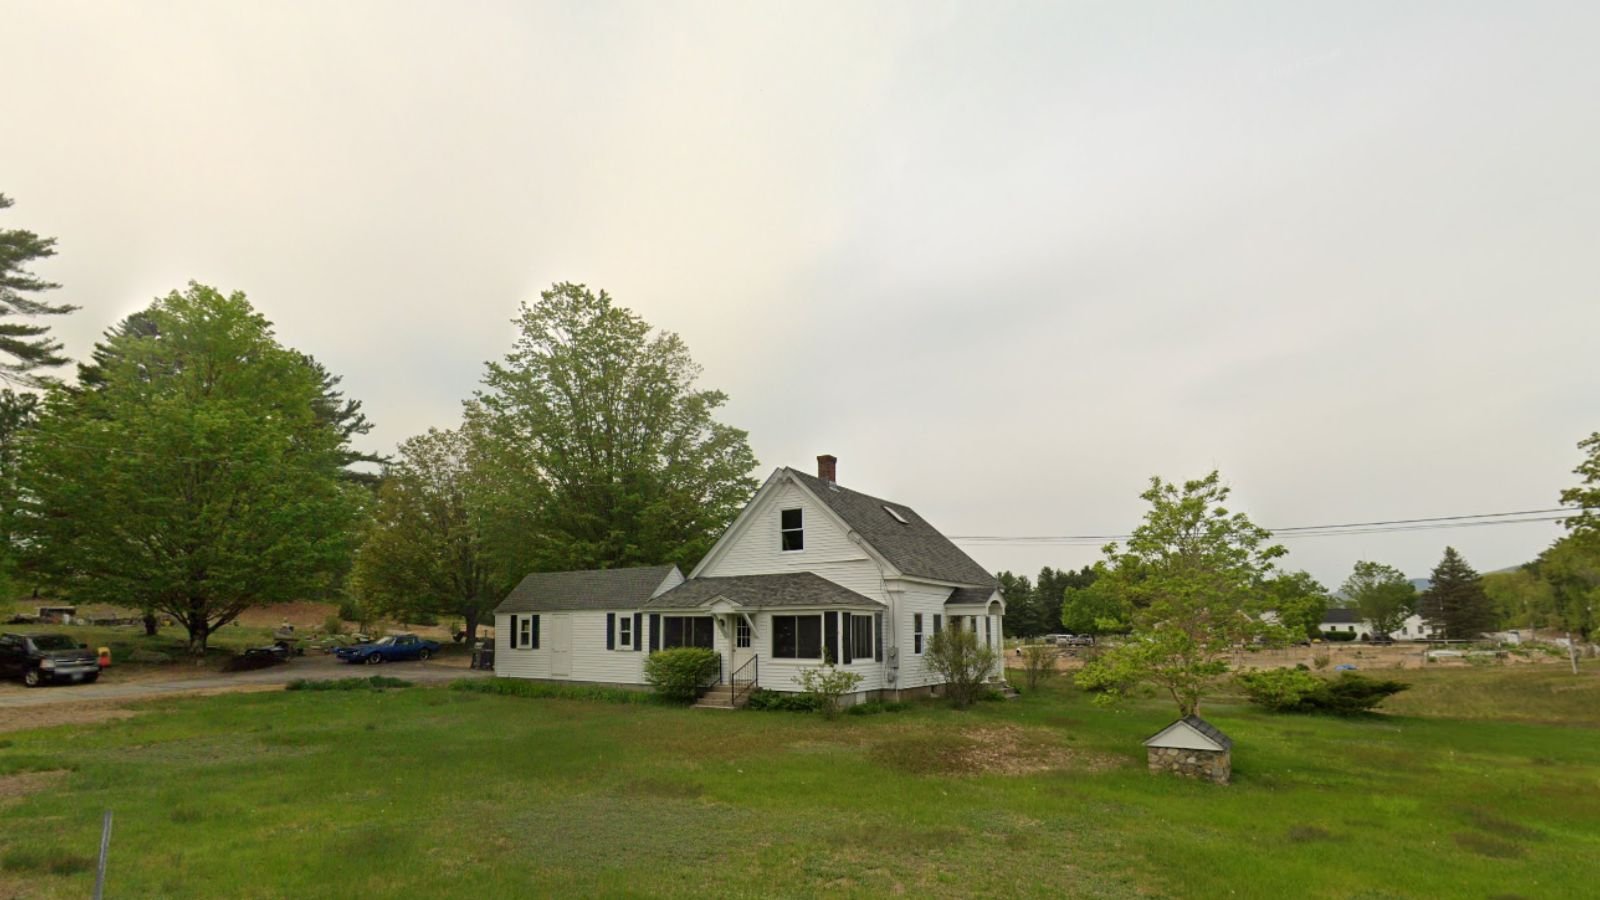
35. Mont Vernon – 98% Home Price Increase Since 2010
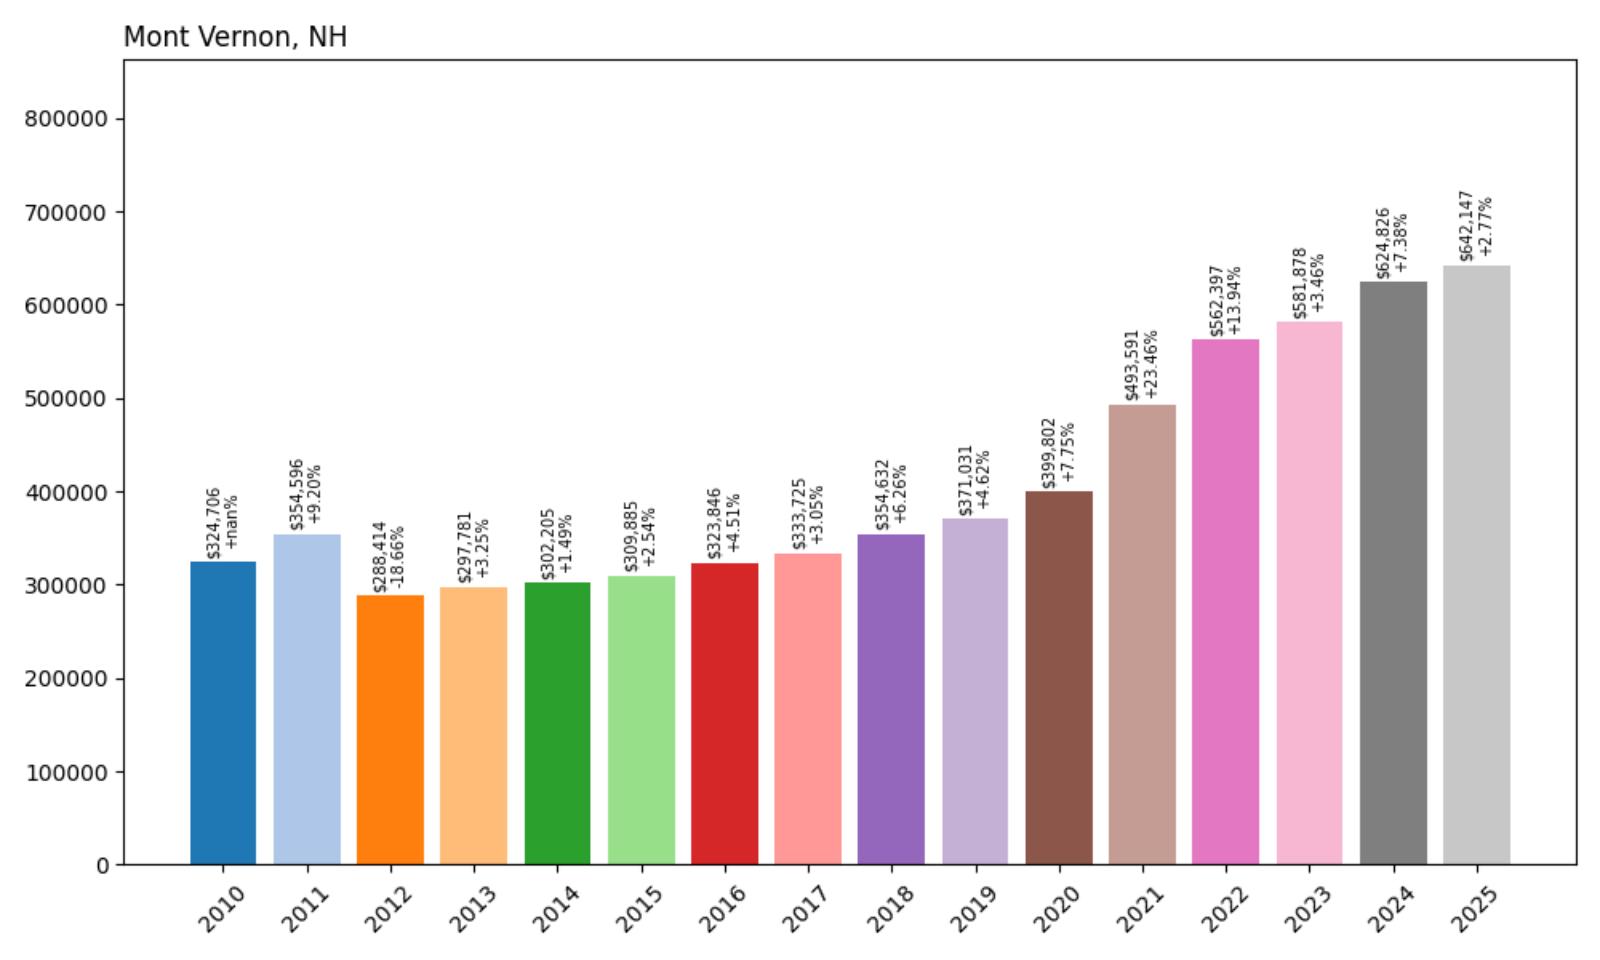
- 2010: $324,706
- 2011: $354,596 (+$29,889, +9.20% from previous year)
- 2012: $288,414 (-$66,182, -18.66% from previous year)
- 2013: $297,781 (+$9,367, +3.25% from previous year)
- 2014: $302,205 (+$4,424, +1.49% from previous year)
- 2015: $309,885 (+$7,681, +2.54% from previous year)
- 2016: $323,846 (+$13,960, +4.51% from previous year)
- 2017: $333,725 (+$9,879, +3.05% from previous year)
- 2018: $354,632 (+$20,907, +6.26% from previous year)
- 2019: $371,031 (+$16,399, +4.62% from previous year)
- 2020: $399,802 (+$28,772, +7.75% from previous year)
- 2021: $493,591 (+$93,789, +23.46% from previous year)
- 2022: $562,397 (+$68,805, +13.94% from previous year)
- 2023: $581,878 (+$19,481, +3.46% from previous year)
- 2024: $624,826 (+$42,948, +7.38% from previous year)
- 2025: $642,147 (+$17,321, +2.77% from previous year)
Mont Vernon experienced severe market volatility in the early 2010s, including an 18.66% decline in 2012 that temporarily erased gains from the previous year. The recovery process was gradual through the late 2010s before accelerating dramatically during the pandemic period. The exceptional growth in 2021, when values increased by nearly 25%, helped push the median home price above $640,000 by 2025.
Mont Vernon – Historic Charm Meets Modern Demand
Mont Vernon, located in Hillsborough County near the Massachusetts border, combines historic New England charm with modern residential appeal in a community of approximately 2,500 residents. This small town offers an authentic rural experience while maintaining convenient access to employment centers in Nashua and the greater Boston metropolitan area. The community’s well-preserved historic district and scenic rural roads create an atmosphere that attracts buyers seeking traditional New Hampshire character.
The town’s real estate market reflects its appeal to professionals and families willing to commute for the benefits of small-town living. Mont Vernon’s excellent school system, low crime rates, and community-oriented atmosphere justify premium pricing compared to more developed suburban areas. The area’s large lot sizes and rural zoning allow for privacy and space that urban and suburban properties cannot match, contributing to sustained demand and value appreciation.
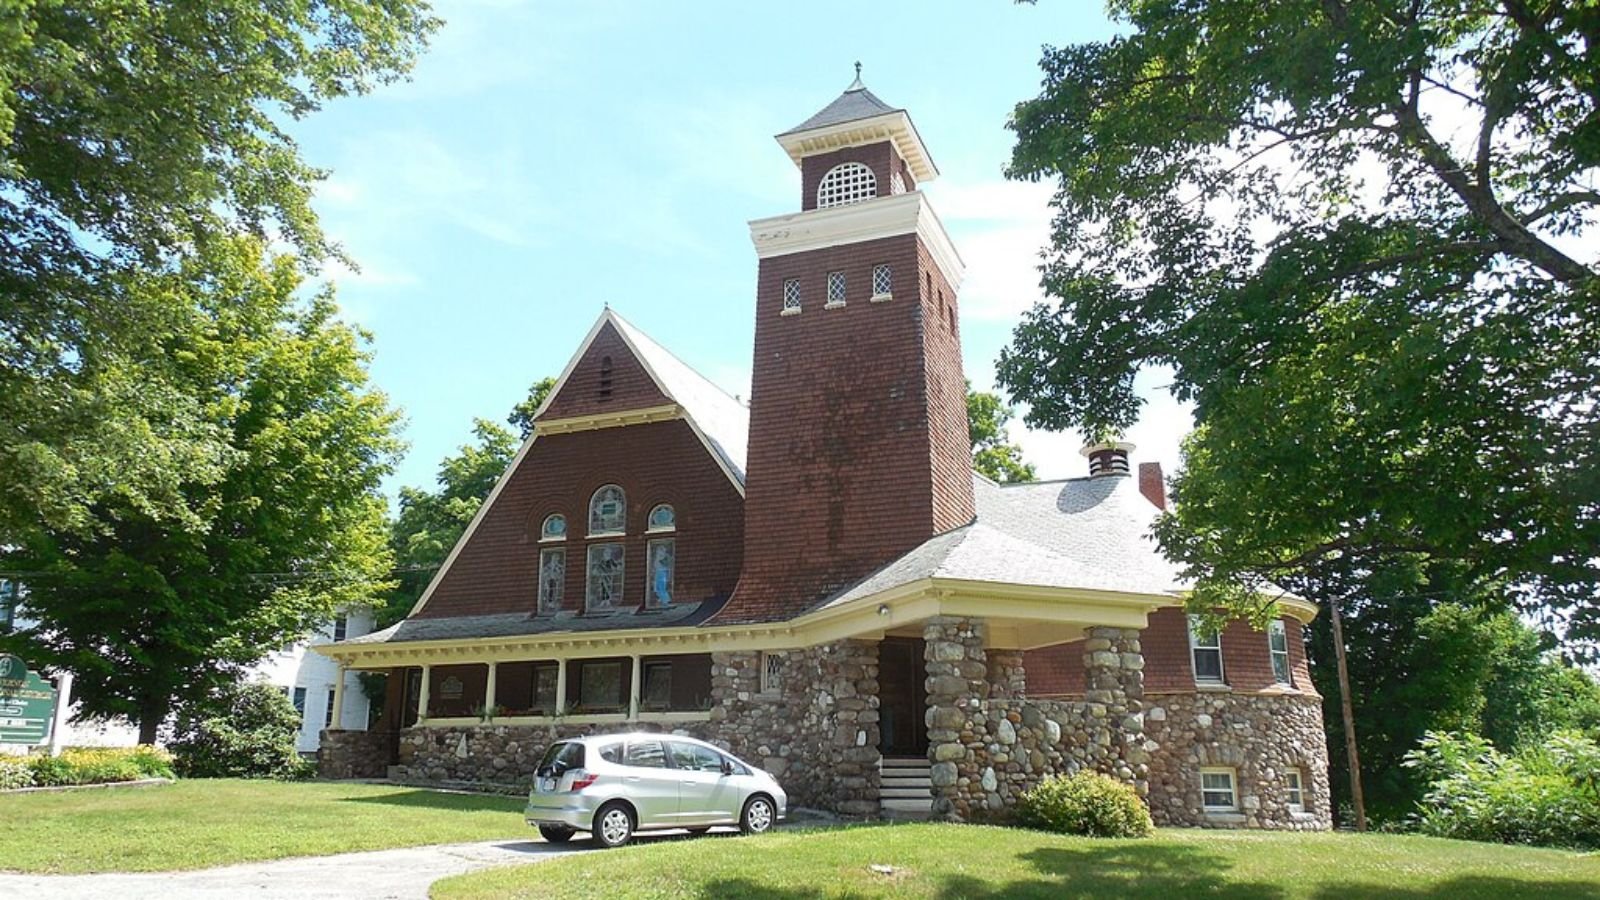
34. Atkinson – 100% Home Price Increase Since 2010
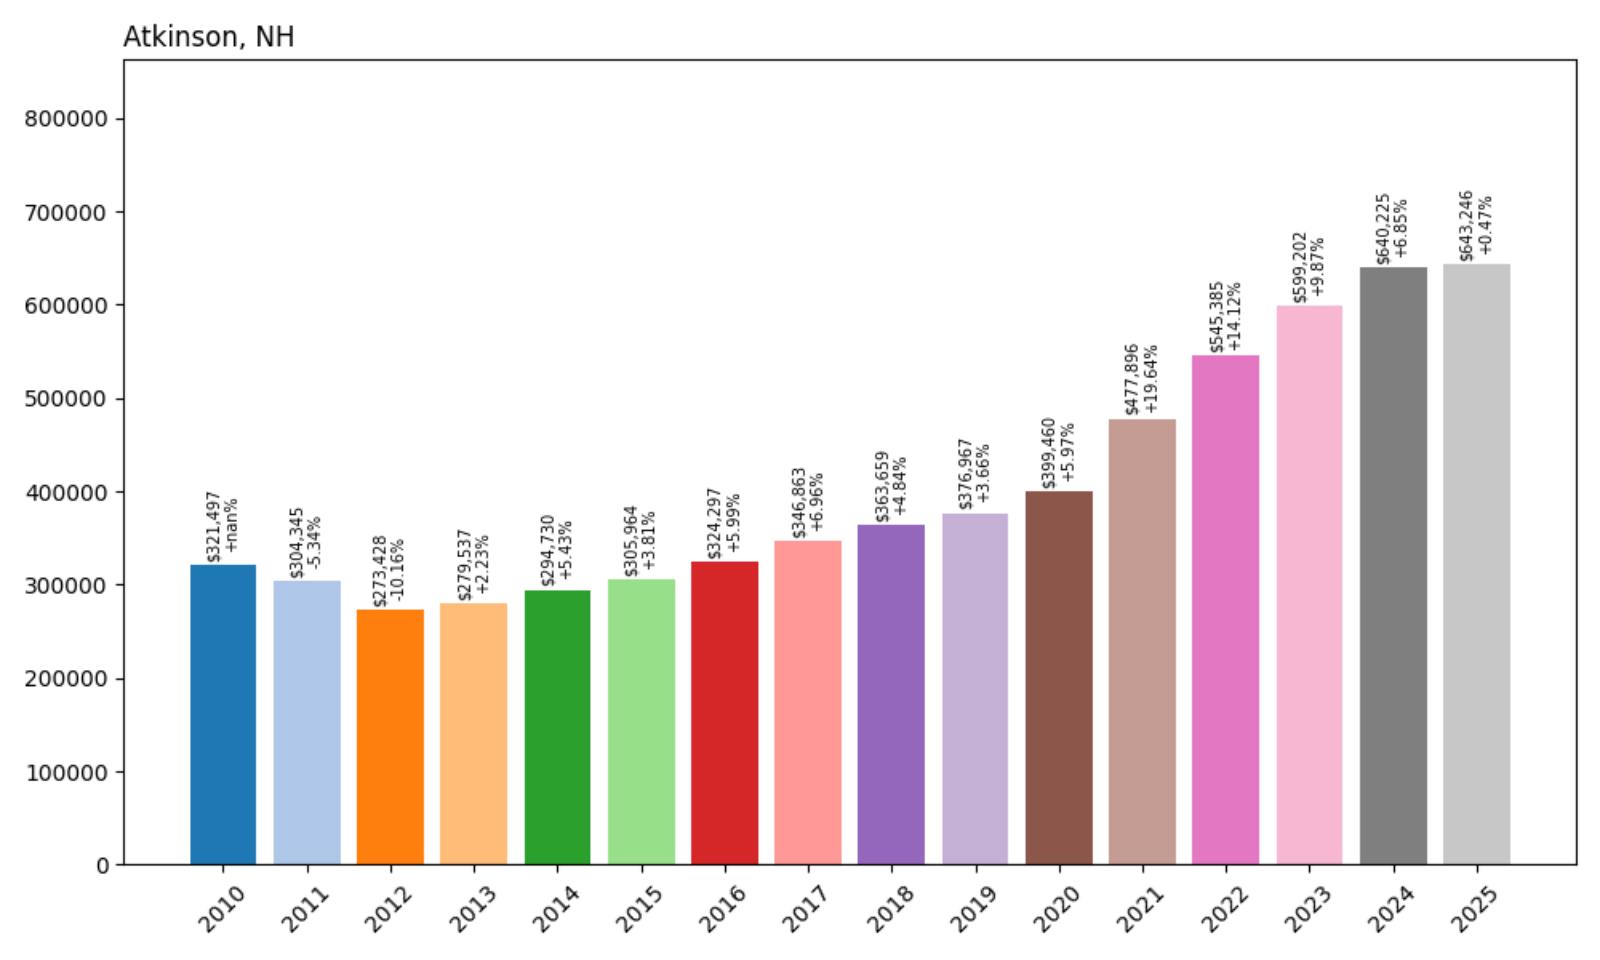
- 2010: $321,497
- 2011: $304,345 (-$17,152, -5.34% from previous year)
- 2012: $273,428 (-$30,917, -10.16% from previous year)
- 2013: $279,537 (+$6,109, +2.23% from previous year)
- 2014: $294,730 (+$15,193, +5.43% from previous year)
- 2015: $305,964 (+$11,234, +3.81% from previous year)
- 2016: $324,297 (+$18,333, +5.99% from previous year)
- 2017: $346,863 (+$22,566, +6.96% from previous year)
- 2018: $363,659 (+$16,797, +4.84% from previous year)
- 2019: $376,967 (+$13,308, +3.66% from previous year)
- 2020: $399,460 (+$22,493, +5.97% from previous year)
- 2021: $477,896 (+$78,436, +19.64% from previous year)
- 2022: $545,385 (+$67,489, +14.12% from previous year)
- 2023: $599,202 (+$53,817, +9.87% from previous year)
- 2024: $640,225 (+$41,023, +6.85% from previous year)
- 2025: $643,246 (+$3,021, +0.47% from previous year)
Atkinson’s housing market endured significant challenges in the early 2010s, with home values declining by more than 15% between 2010 and 2012. The recovery began slowly but gained momentum through the latter part of the decade, culminating in explosive growth during 2021-2023 when values increased by over 50% in three years. The current median price of $643,246 represents exactly double the 2010 starting point, marking a perfect 100% increase over 15 years.
Atkinson – Strategic Location Drives Steady Growth
Atkinson enjoys a prime location in Rockingham County, positioned along the Massachusetts border with excellent access to employment centers in both states. This town of approximately 6,800 residents benefits from its location on major transportation corridors while maintaining a residential character that appeals to families and professionals. The community’s proximity to major employers in the technology and financial sectors has created sustained demand for housing from well-compensated workers.
The town’s real estate market reflects its role as a bedroom community for workers in the greater Boston area and southern New Hampshire’s technology corridor. Atkinson offers larger homes and lot sizes compared to more urbanized areas while maintaining reasonable commuting distances to major employment centers. The area’s excellent school system and family-friendly neighborhoods contribute to strong demand from households with children, supporting sustained price appreciation.
33. East Kingston – 124% Home Price Increase Since 2010
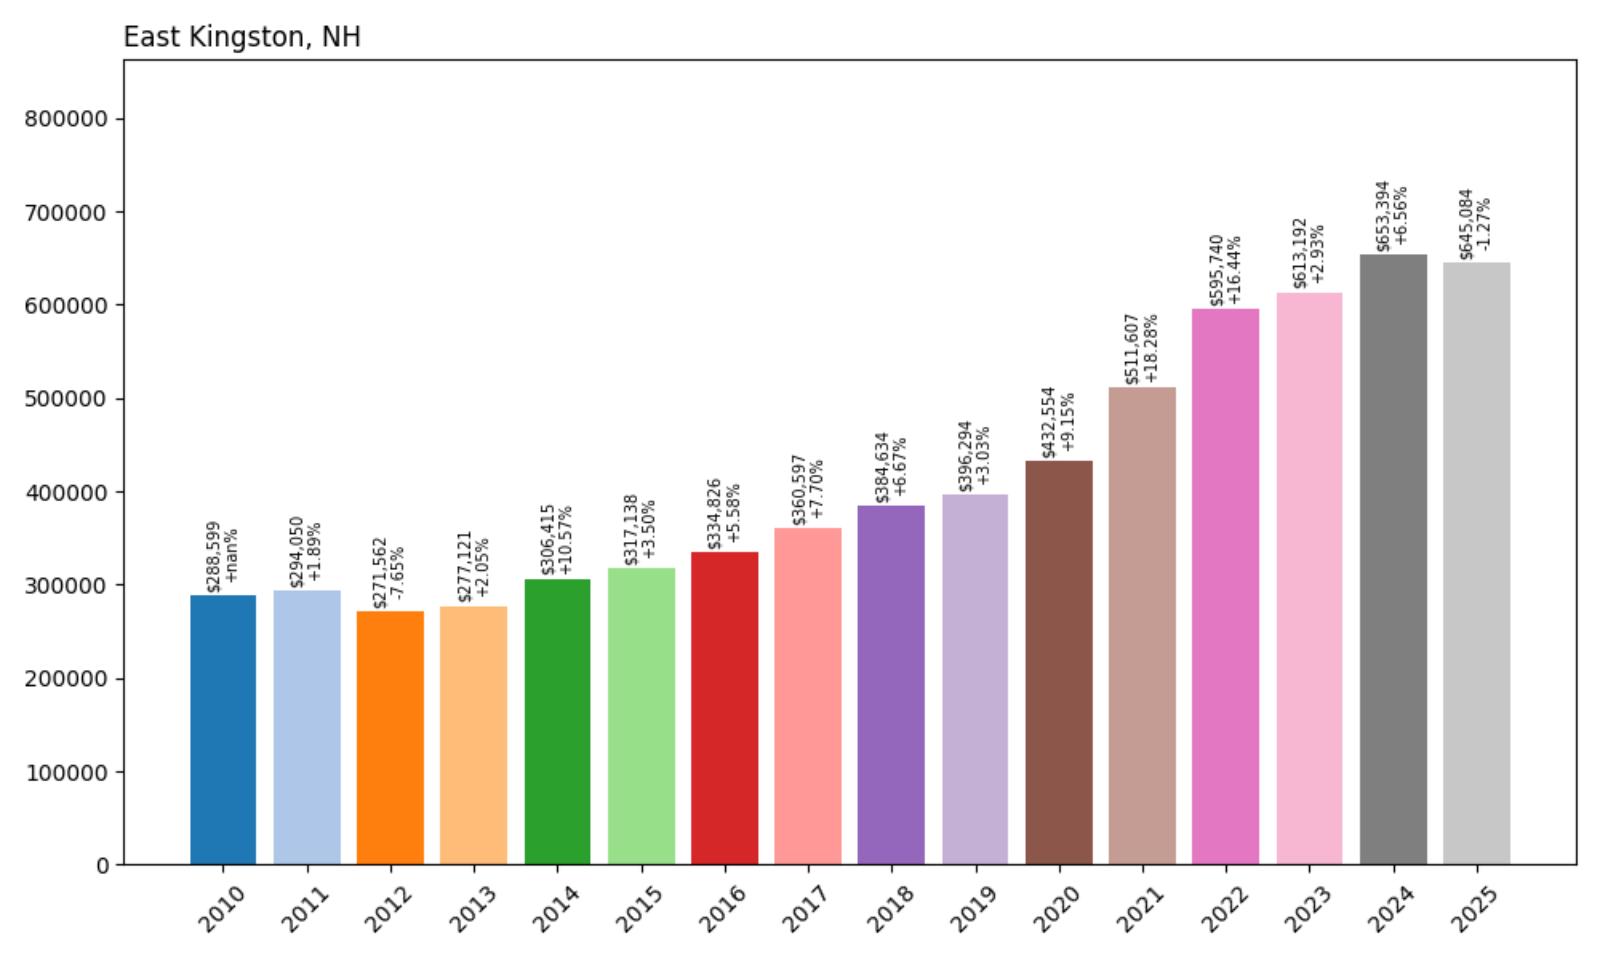
- 2010: $288,599
- 2011: $294,050 (+$5,451, +1.89% from previous year)
- 2012: $271,562 (-$22,487, -7.65% from previous year)
- 2013: $277,121 (+$5,559, +2.05% from previous year)
- 2014: $306,415 (+$29,294, +10.57% from previous year)
- 2015: $317,138 (+$10,723, +3.50% from previous year)
- 2016: $334,826 (+$17,688, +5.58% from previous year)
- 2017: $360,597 (+$25,772, +7.70% from previous year)
- 2018: $384,634 (+$24,036, +6.67% from previous year)
- 2019: $396,294 (+$11,660, +3.03% from previous year)
- 2020: $432,554 (+$36,260, +9.15% from previous year)
- 2021: $511,607 (+$79,053, +18.28% from previous year)
- 2022: $595,740 (+$84,133, +16.44% from previous year)
- 2023: $613,192 (+$17,453, +2.93% from previous year)
- 2024: $653,394 (+$40,202, +6.56% from previous year)
- 2025: $645,084 (-$8,309, -1.27% from previous year)
East Kingston’s housing market showed remarkable consistency through most of the 2010s decade, with steady annual growth averaging around 5-7% per year. The pandemic period brought dramatic acceleration, with home values jumping over 34% between 2020 and 2022 alone. Despite a slight decline in 2025, the overall 124% increase since 2010 demonstrates the community’s strong long-term appeal to homebuyers.
East Kingston – Small Town Appeal With Regional Access
East Kingston, located in Rockingham County with a population of approximately 2,300 residents, exemplifies the appeal of small New Hampshire communities that offer rural character with regional accessibility. The town’s location provides convenient access to the Seacoast region and Massachusetts employment centers while maintaining the quiet, residential atmosphere that defines much of rural New Hampshire. This balance between accessibility and tranquility has made East Kingston increasingly attractive to families and professionals seeking alternatives to more urbanized areas.
The community’s real estate market benefits from its position within the greater Portsmouth and Boston metropolitan regions while offering significantly more space and privacy than suburban alternatives. East Kingston’s rural roads, historic buildings, and agricultural heritage create an authentic New England atmosphere that commands premium pricing. The area’s excellent school system and low crime rates further enhance its appeal to families with children, contributing to sustained housing demand.
32. Holderness – 125% Home Price Increase Since 2010
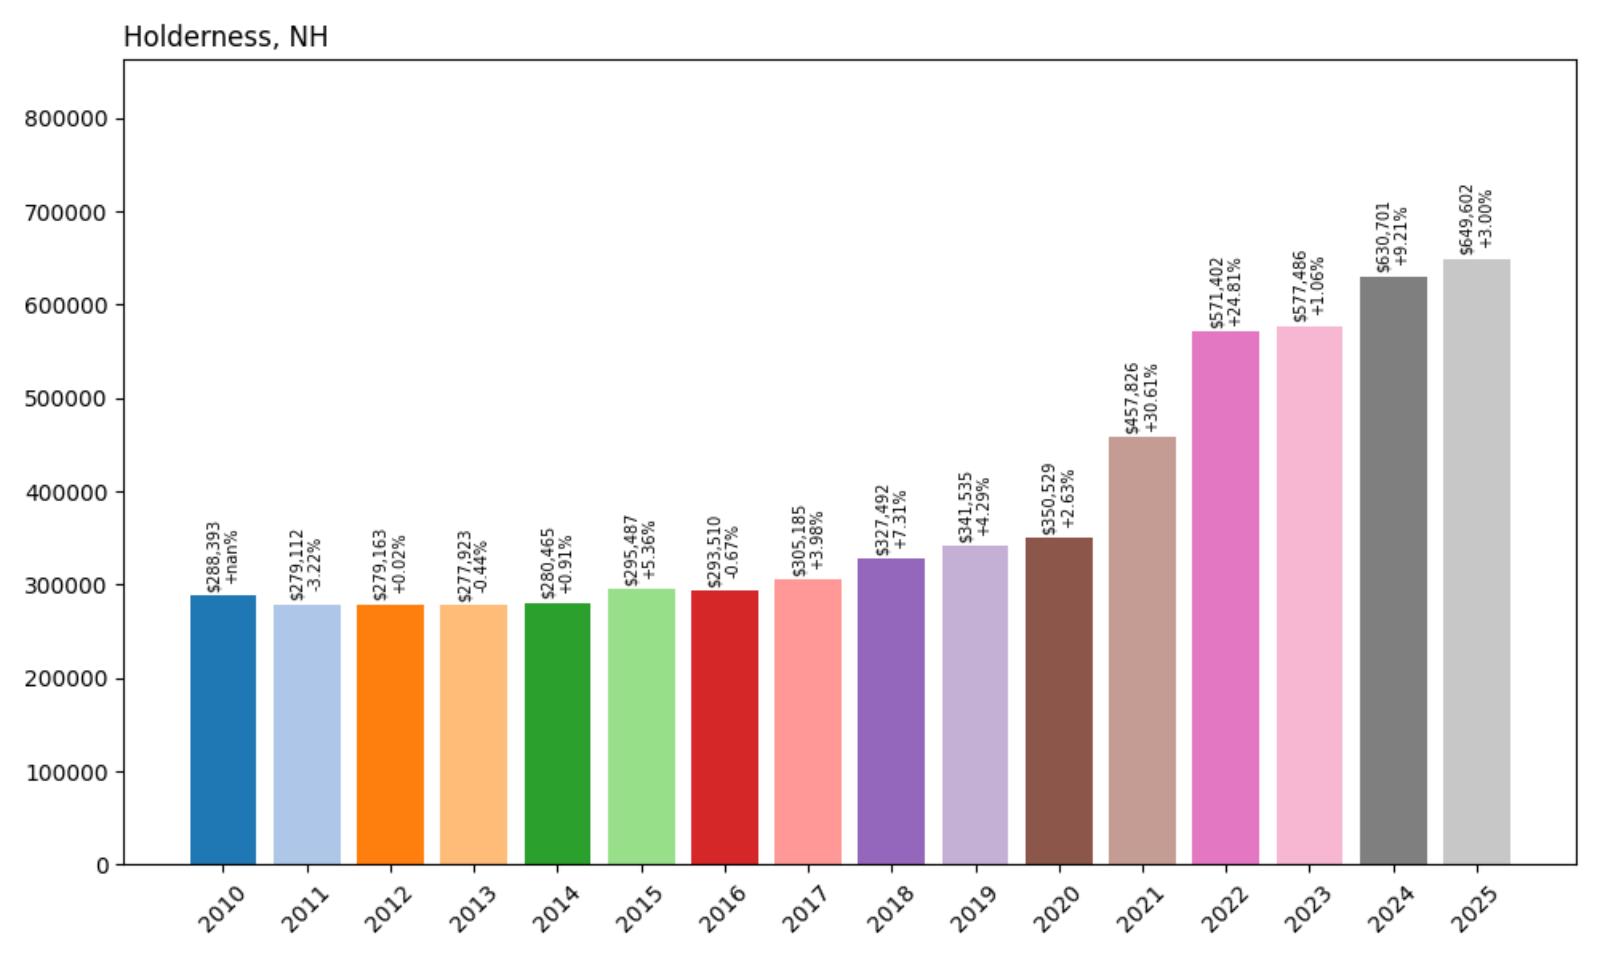
- 2010: $288,393
- 2011: $279,112 (-$9,281, -3.22% from previous year)
- 2012: $279,163 (+$50, +0.02% from previous year)
- 2013: $277,923 (-$1,240, -0.44% from previous year)
- 2014: $280,465 (+$2,542, +0.91% from previous year)
- 2015: $295,487 (+$15,022, +5.36% from previous year)
- 2016: $293,510 (-$1,976, -0.67% from previous year)
- 2017: $305,185 (+$11,674, +3.98% from previous year)
- 2018: $327,492 (+$22,307, +7.31% from previous year)
- 2019: $341,535 (+$14,043, +4.29% from previous year)
- 2020: $350,529 (+$8,994, +2.63% from previous year)
- 2021: $457,826 (+$107,297, +30.61% from previous year)
- 2022: $571,402 (+$113,575, +24.81% from previous year)
- 2023: $577,486 (+$6,085, +1.06% from previous year)
- 2024: $630,701 (+$53,214, +9.21% from previous year)
- 2025: $649,602 (+$18,901, +3.00% from previous year)
Holderness experienced a prolonged period of market stagnation from 2010 through 2017, with home values remaining essentially flat for nearly eight years. However, the transformation beginning in 2018 has been remarkable, with particularly explosive growth in 2021 and 2022 when values increased by over 60% in just two years. The current median price of $649,602 represents a 125% increase from the 2010 baseline, demonstrating how dramatically the market has shifted.
Holderness – Lakes Region Educational Hub
Holderness occupies a unique position in the Lakes Region of New Hampshire, serving as home to both Holderness School, a prestigious prep school, and Plymouth State University nearby. This educational presence, combined with the town’s location on Squam Lake, creates a distinctive real estate market that appeals to diverse buyer demographics. The community of approximately 2,100 residents benefits from the institutional stability provided by these educational institutions while enjoying access to some of New Hampshire’s most pristine lakefront properties.
The town’s real estate market reflects its dual character as both an educational community and a recreational destination. Holderness offers waterfront properties on Squam Lake, which gained national recognition as the setting for the movie “On Golden Pond,” along with more affordable inland properties that still provide access to the area’s natural amenities. The presence of Holderness School brings faculty, staff, and visiting families who contribute to local housing demand and support service businesses that enhance community appeal.
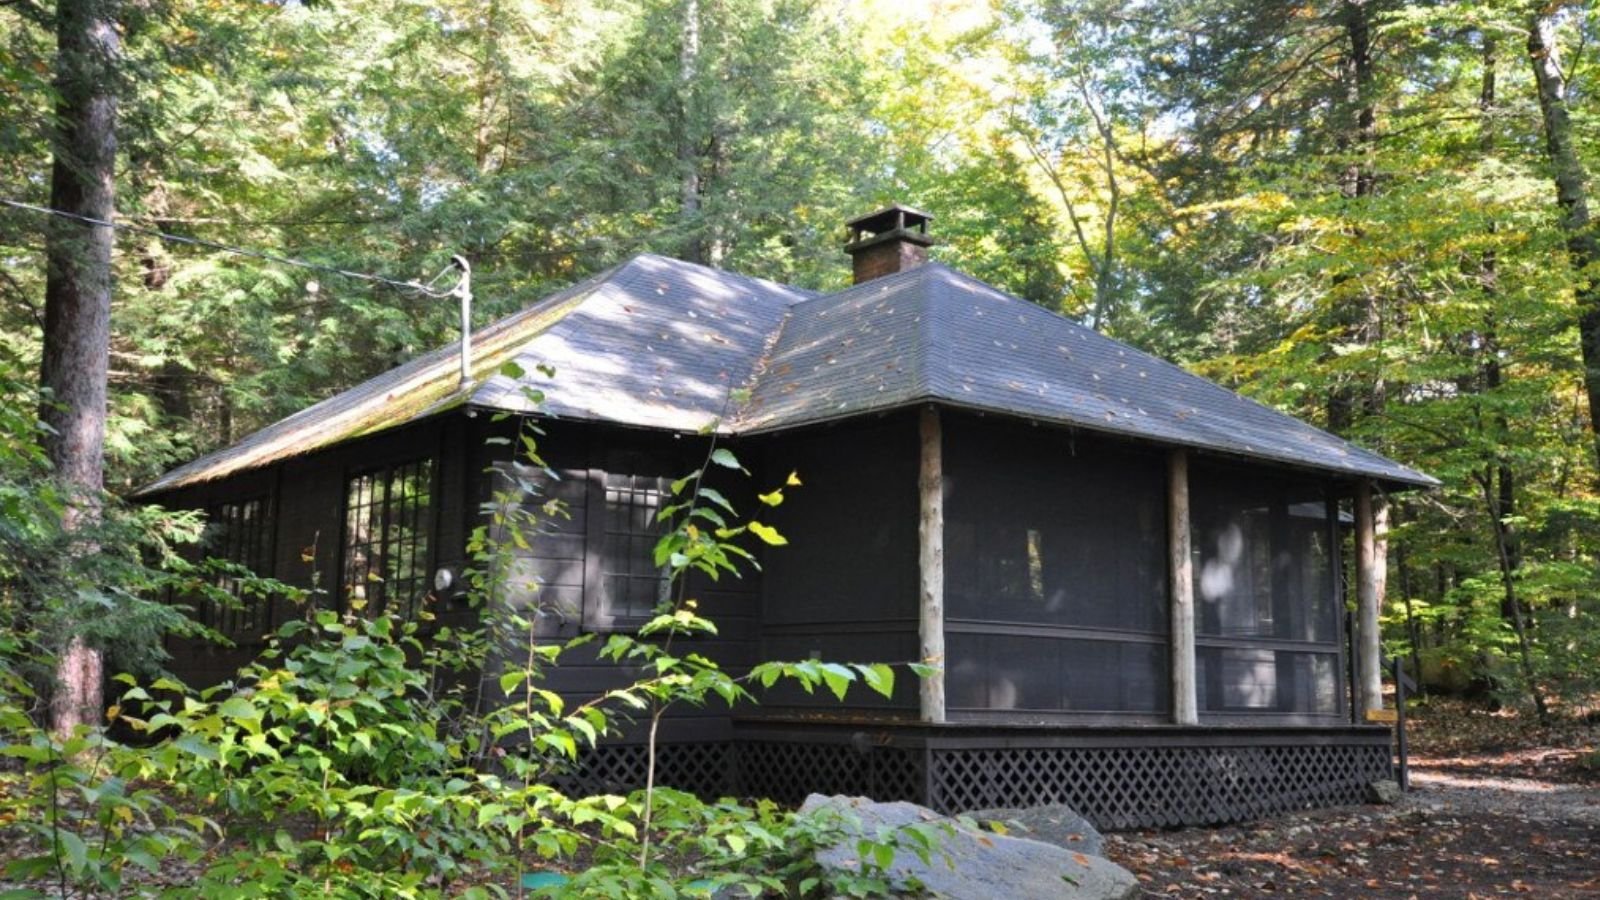
31. Seabrook – 126% Home Price Increase Since 2010
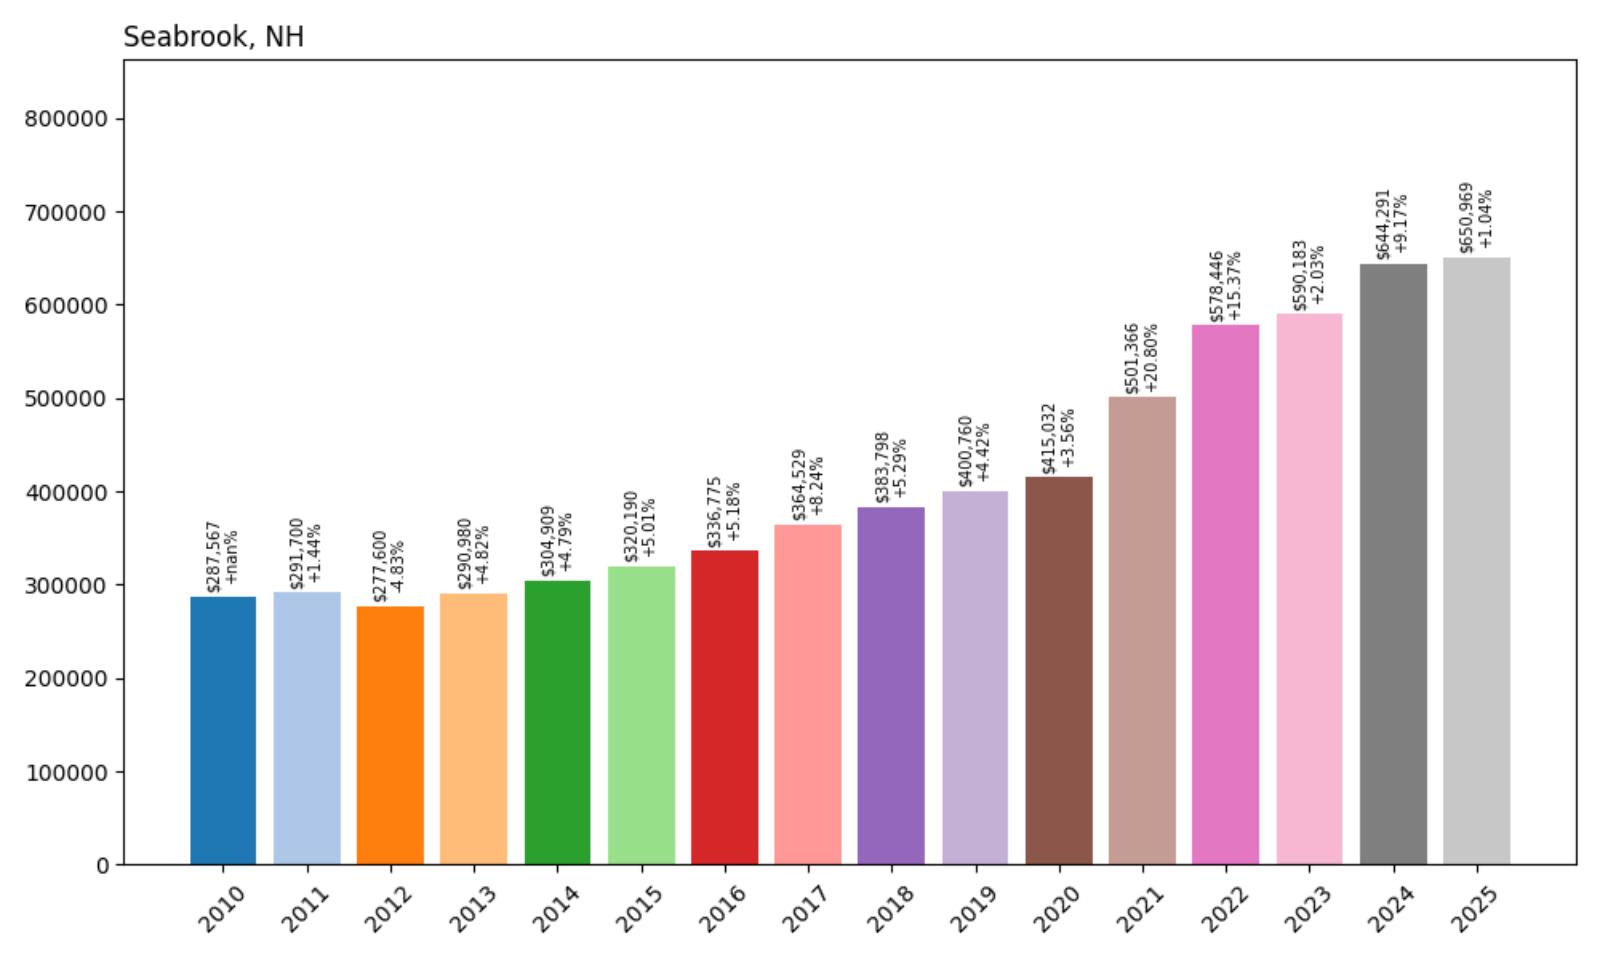
- 2010: $287,567
- 2011: $291,700 (+$4,133, +1.44% from previous year)
- 2012: $277,600 (-$14,101, -4.83% from previous year)
- 2013: $290,980 (+$13,380, +4.82% from previous year)
- 2014: $304,909 (+$13,930, +4.79% from previous year)
- 2015: $320,190 (+$15,280, +5.01% from previous year)
- 2016: $336,775 (+$16,585, +5.18% from previous year)
- 2017: $364,529 (+$27,754, +8.24% from previous year)
- 2018: $383,798 (+$19,269, +5.29% from previous year)
- 2019: $400,760 (+$16,962, +4.42% from previous year)
- 2020: $415,032 (+$14,272, +3.56% from previous year)
- 2021: $501,366 (+$86,334, +20.80% from previous year)
- 2022: $578,446 (+$77,080, +15.37% from previous year)
- 2023: $590,183 (+$11,737, +2.03% from previous year)
- 2024: $644,291 (+$54,108, +9.17% from previous year)
- 2025: $650,969 (+$6,678, +1.04% from previous year)
Seabrook’s housing market demonstrated remarkable consistency throughout the 2010s, with steady annual appreciation averaging around 5% per year through most of the decade. The pandemic period brought accelerated growth, particularly in 2021 when values jumped over 20%. The community’s 126% total appreciation since 2010 reflects both its coastal location and the broader trend of increased demand for New Hampshire real estate.
Seabrook – Coastal Community With Diverse Economy
Seabrook stands out among New Hampshire’s coastal communities due to its unique combination of residential areas, commercial development, and industrial presence. Located in Rockingham County with approximately 8,700 residents, the town offers ocean access while maintaining more affordable housing options than exclusive coastal enclaves like New Castle or Rye. Seabrook’s location along Route 95 provides excellent regional connectivity, making it attractive to both local workers and commuters to Massachusetts employment centers.
The town’s real estate market benefits from its coastal location while remaining accessible to middle-class buyers seeking oceanfront proximity. Seabrook offers diverse housing options, from beachside cottages to more modern developments inland, creating opportunities for various income levels and lifestyle preferences. The area’s tax base benefits from commercial and industrial development, including Seabrook Station nuclear power plant, which helps keep residential tax rates competitive compared to purely residential communities.
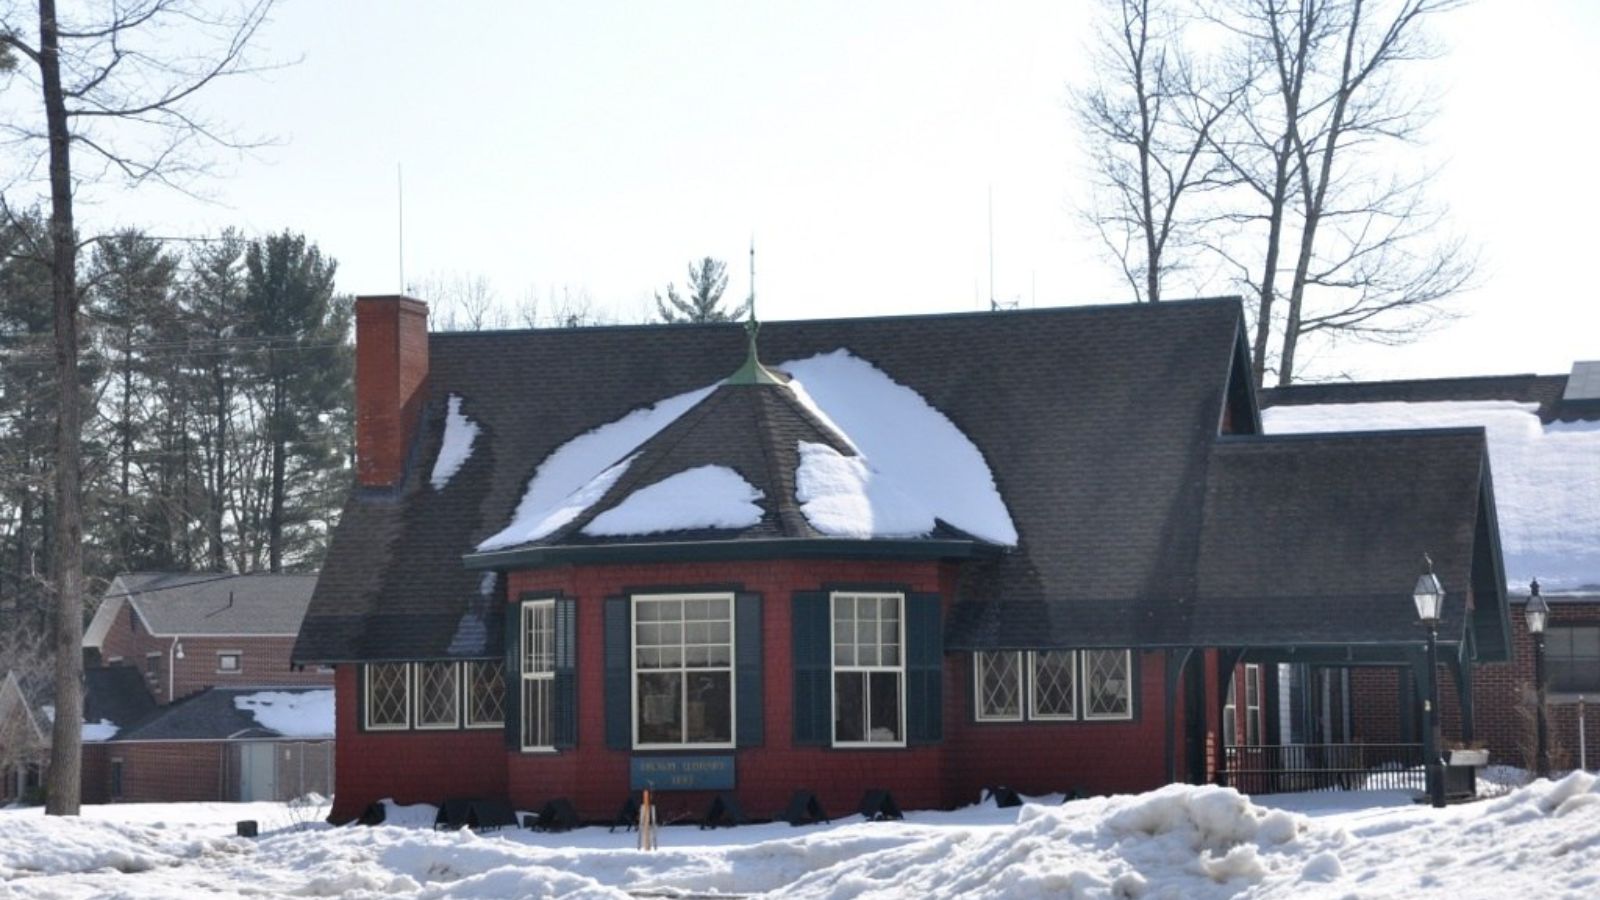
30. Meredith – 145% Home Price Increase Since 2010
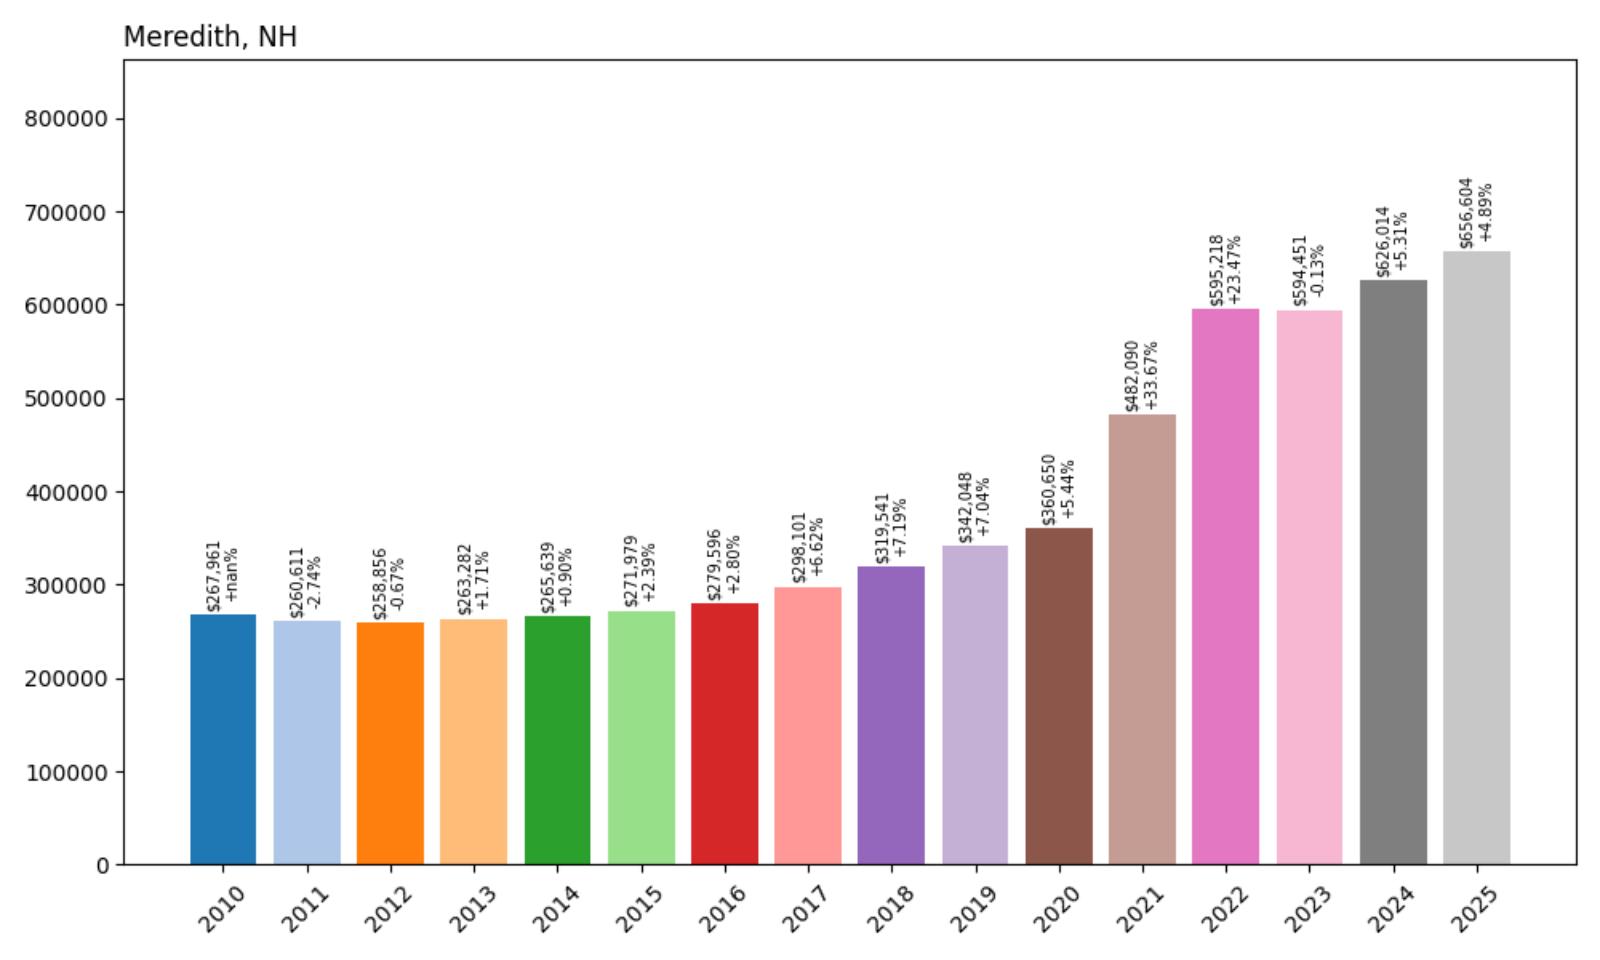
- 2010: $267,961
- 2011: $260,611 (-$7,350, -2.74% from previous year)
- 2012: $258,856 (-$1,755, -0.67% from previous year)
- 2013: $263,282 (+$4,426, +1.71% from previous year)
- 2014: $265,639 (+$2,357, +0.90% from previous year)
- 2015: $271,979 (+$6,340, +2.39% from previous year)
- 2016: $279,596 (+$7,617, +2.80% from previous year)
- 2017: $298,101 (+$18,505, +6.62% from previous year)
- 2018: $319,541 (+$21,440, +7.19% from previous year)
- 2019: $342,048 (+$22,507, +7.04% from previous year)
- 2020: $360,650 (+$18,601, +5.44% from previous year)
- 2021: $482,090 (+$121,440, +33.67% from previous year)
- 2022: $595,218 (+$113,128, +23.47% from previous year)
- 2023: $594,451 (-$767, -0.13% from previous year)
- 2024: $626,014 (+$31,563, +5.31% from previous year)
- 2025: $656,604 (+$30,590, +4.89% from previous year)
Meredith’s housing market remained relatively subdued through the first half of the 2010s before beginning steady acceleration in 2017. The most dramatic transformation occurred during 2021-2022, when home values increased by an astounding 57% over two years, reflecting intense demand for Lakes Region properties during the pandemic. The 145% total increase since 2010 positions Meredith as one of New Hampshire’s fastest-appreciating markets.
Meredith – Gateway to Lake Winnipesaukee Recreation
Meredith serves as the unofficial gateway to Lake Winnipesaukee, New Hampshire’s largest lake and premier recreational destination. Located in Belknap County with approximately 6,500 residents, the town combines lakefront luxury with year-round community amenities that appeal to both permanent residents and seasonal property owners. Meredith’s downtown area features shops, restaurants, and cultural attractions that create a vibrant atmosphere throughout the year, not just during summer months.
The town’s real estate market capitalizes on its prime location at the southern end of Lake Winnipesaukee, offering diverse property types from modest year-round homes to luxury lakefront estates. Meredith’s appeal extends beyond its waterfront properties, with inland areas providing more affordable options while still offering access to lake activities and community amenities. The area’s four-season recreational opportunities, including skiing, boating, and hiking, support strong demand from buyers seeking both primary and vacation homes.
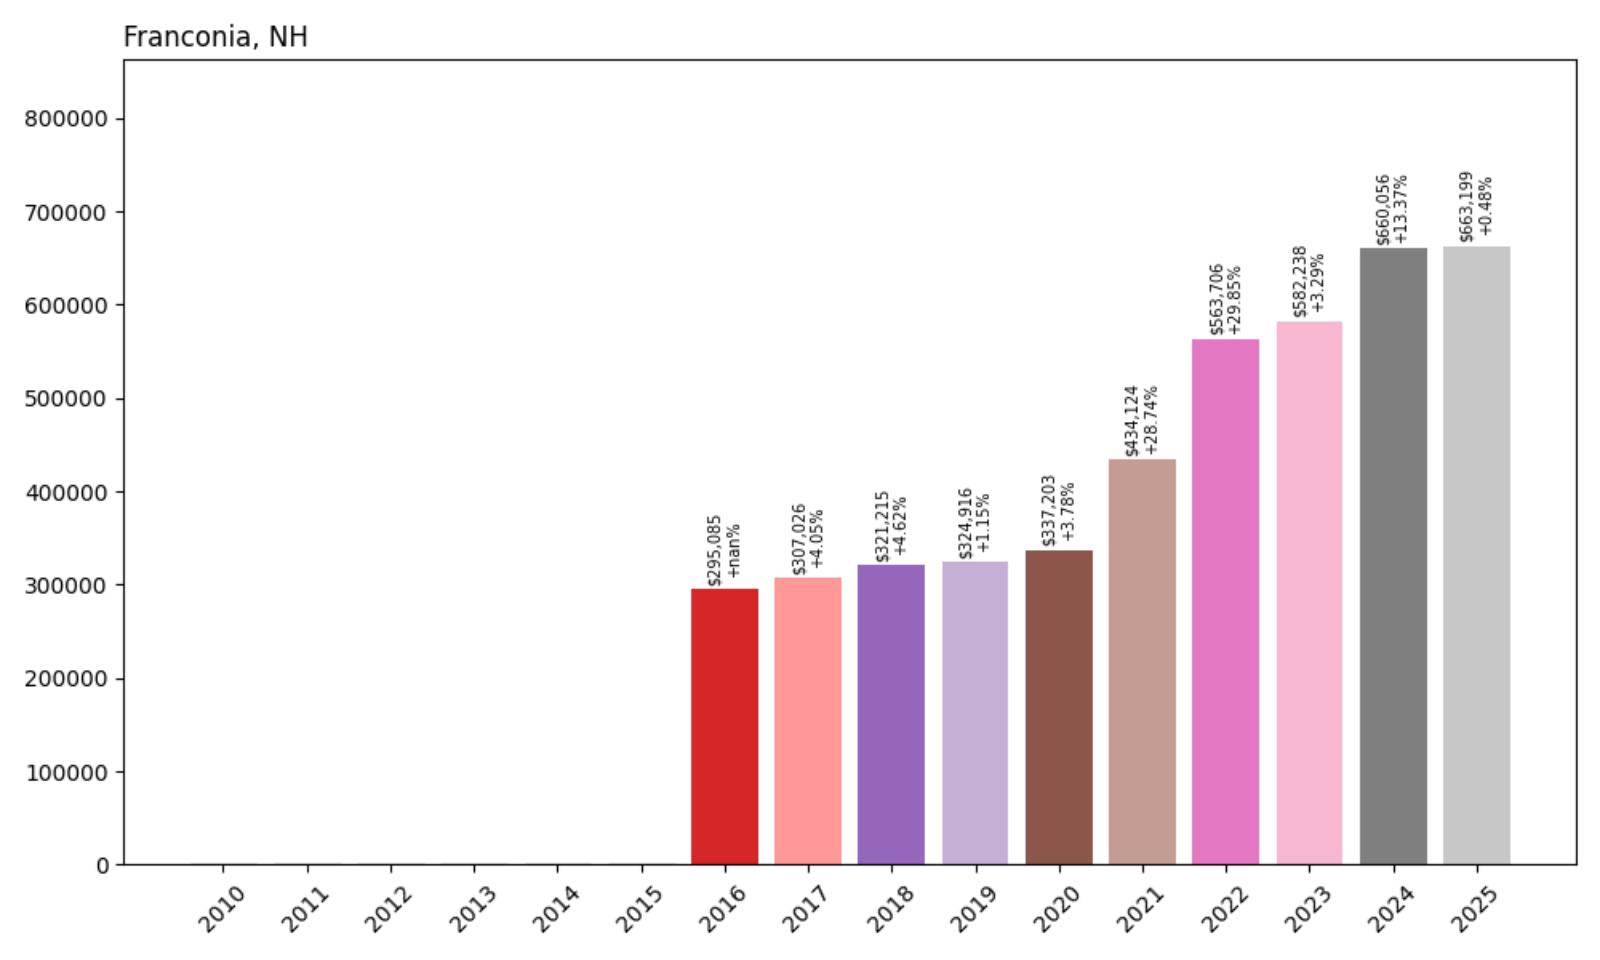
29. Franconia – 125% Home Price Increase Since 2016
- 2010: N/A
- 2011: N/A
- 2012: N/A
- 2013: N/A
- 2014: N/A
- 2015: N/A
- 2016: $295,085
- 2017: $307,026 (+$11,941, +4.05% from previous year)
- 2018: $321,215 (+$14,189, +4.62% from previous year)
- 2019: $324,916 (+$3,701, +1.15% from previous year)
- 2020: $337,203 (+$12,287, +3.78% from previous year)
- 2021: $434,124 (+$96,920, +28.74% from previous year)
- 2022: $563,706 (+$129,583, +29.85% from previous year)
- 2023: $582,238 (+$18,532, +3.29% from previous year)
- 2024: $660,056 (+$77,818, +13.37% from previous year)
- 2025: $663,199 (+$3,143, +0.48% from previous year)
Franconia’s housing data begins in 2016, showing modest but steady growth through 2020 before experiencing explosive appreciation during the pandemic years. The most remarkable period occurred in 2021-2022, when home values increased by nearly 60% over two years, transforming this mountain community into a high-value real estate market. The 125% increase since 2016 represents one of the steepest appreciation curves among New Hampshire’s mountain communities.
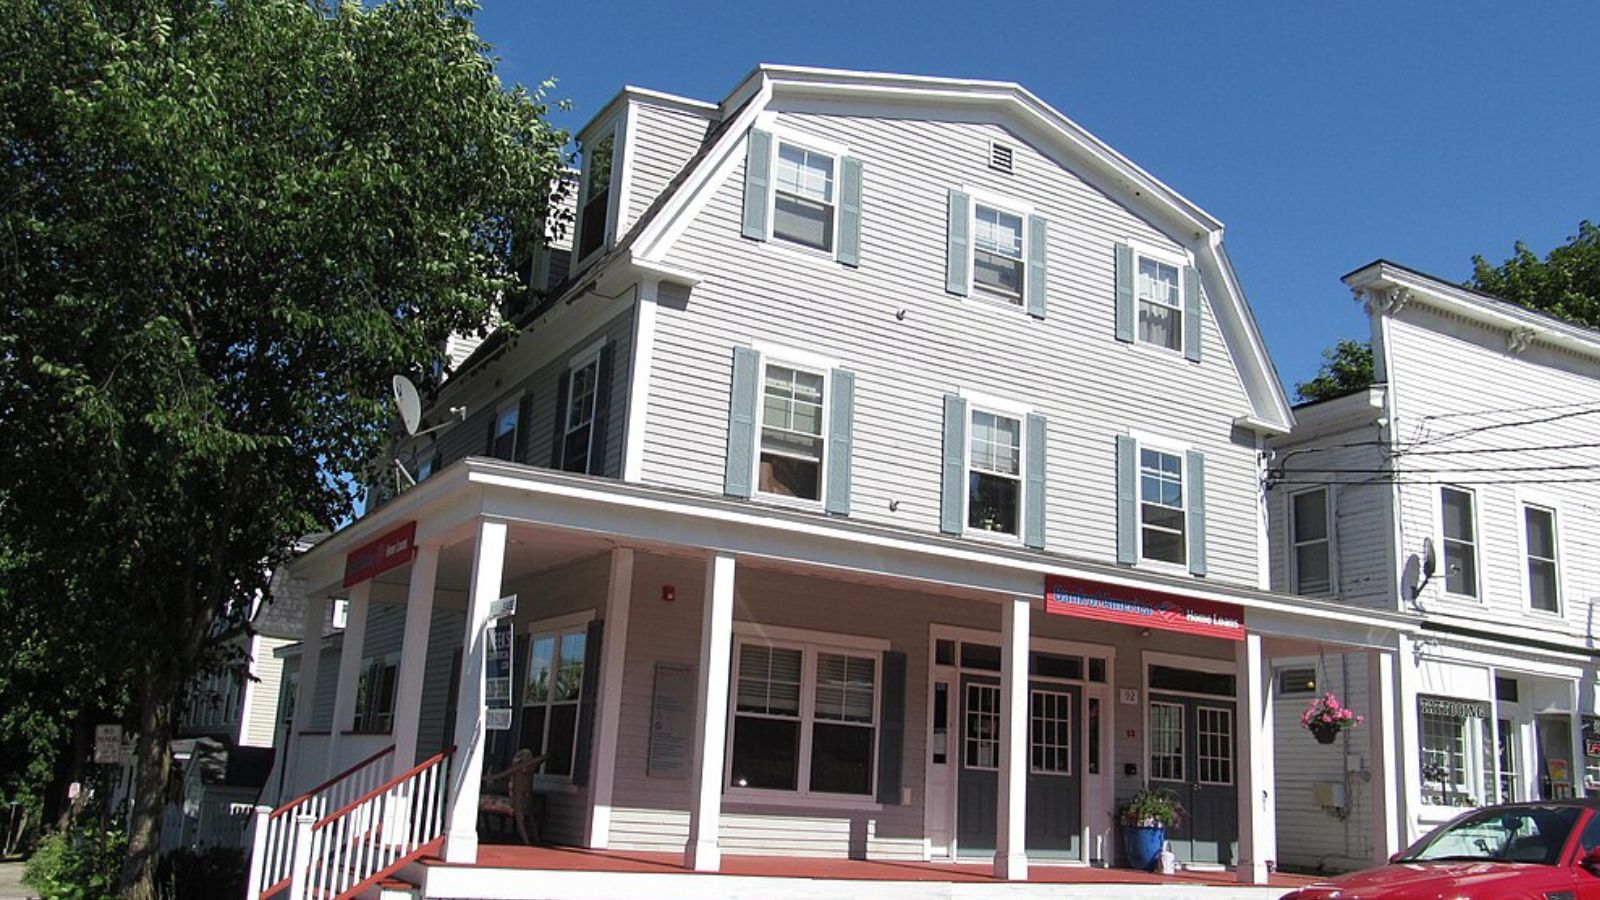
Franconia – White Mountains Recreation Haven
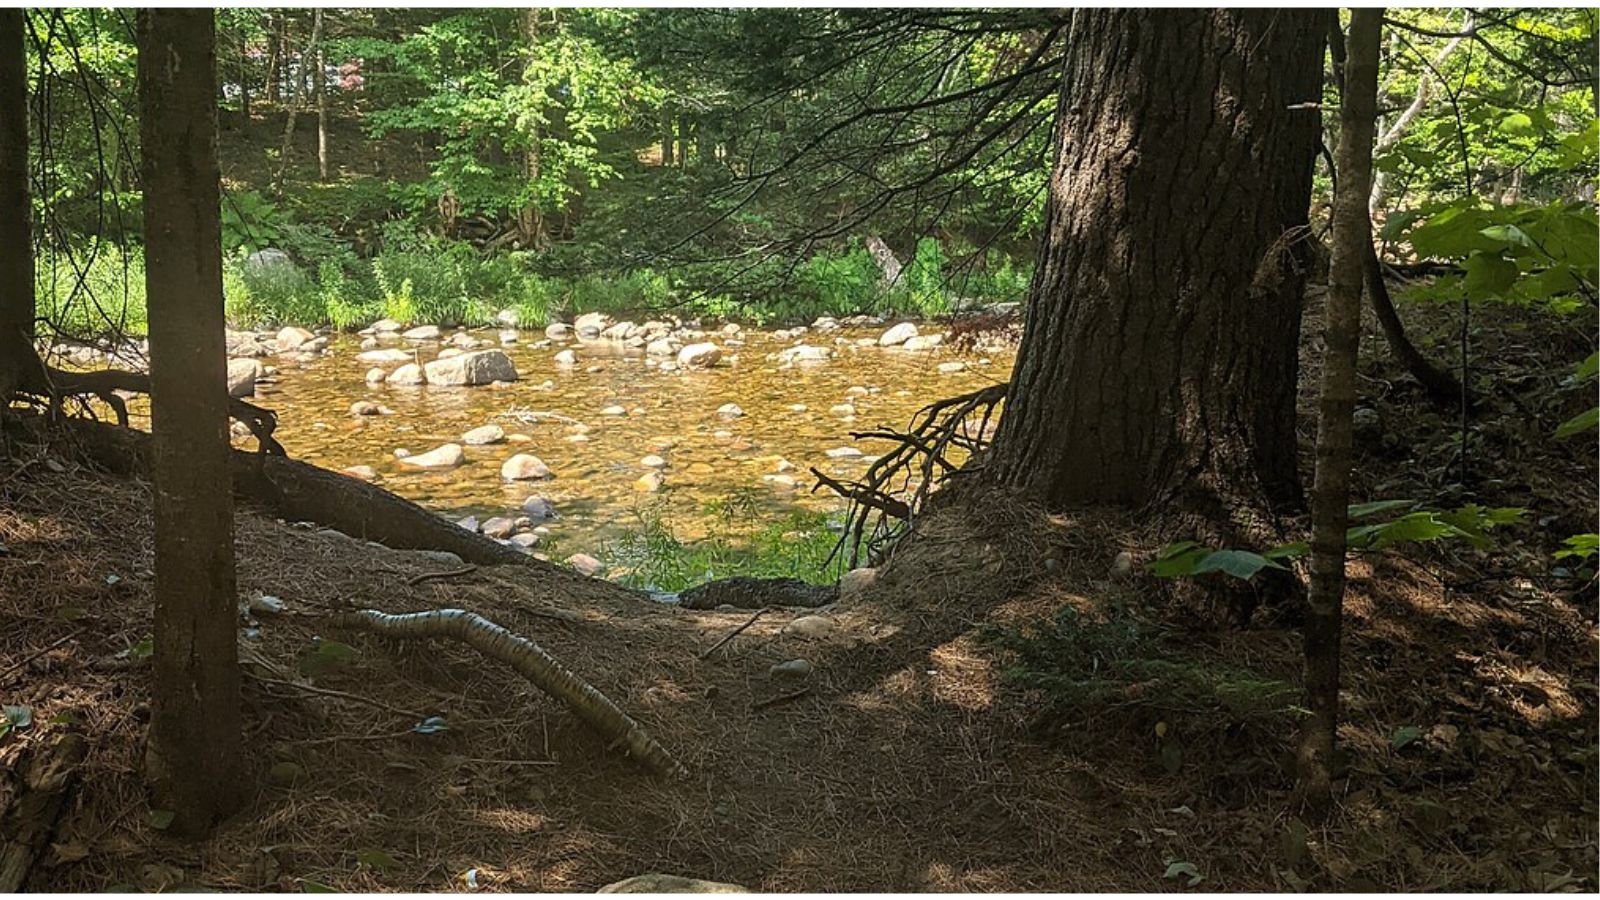
Franconia occupies a spectacular location in Grafton County at the heart of the White Mountains region, offering some of New Hampshire’s most dramatic mountain scenery and outdoor recreation opportunities. This community of approximately 1,100 residents has become increasingly attractive to buyers seeking mountain properties for both primary residence and vacation use. The area’s proximity to Cannon Mountain ski area, Franconia Notch State Park, and the Appalachian Trail creates year-round appeal for outdoor enthusiasts.
The town’s real estate market has been transformed by the growing popularity of mountain recreation and the increased flexibility of remote work arrangements. Franconia offers diverse property types, from modest year-round homes to luxury mountain retreats, with many properties providing spectacular mountain and valley views. The area’s natural amenities and recreational opportunities have attracted buyers from urban areas seeking lifestyle changes, driving significant price appreciation throughout the community.
28. Amherst – 103% Home Price Increase Since 2010
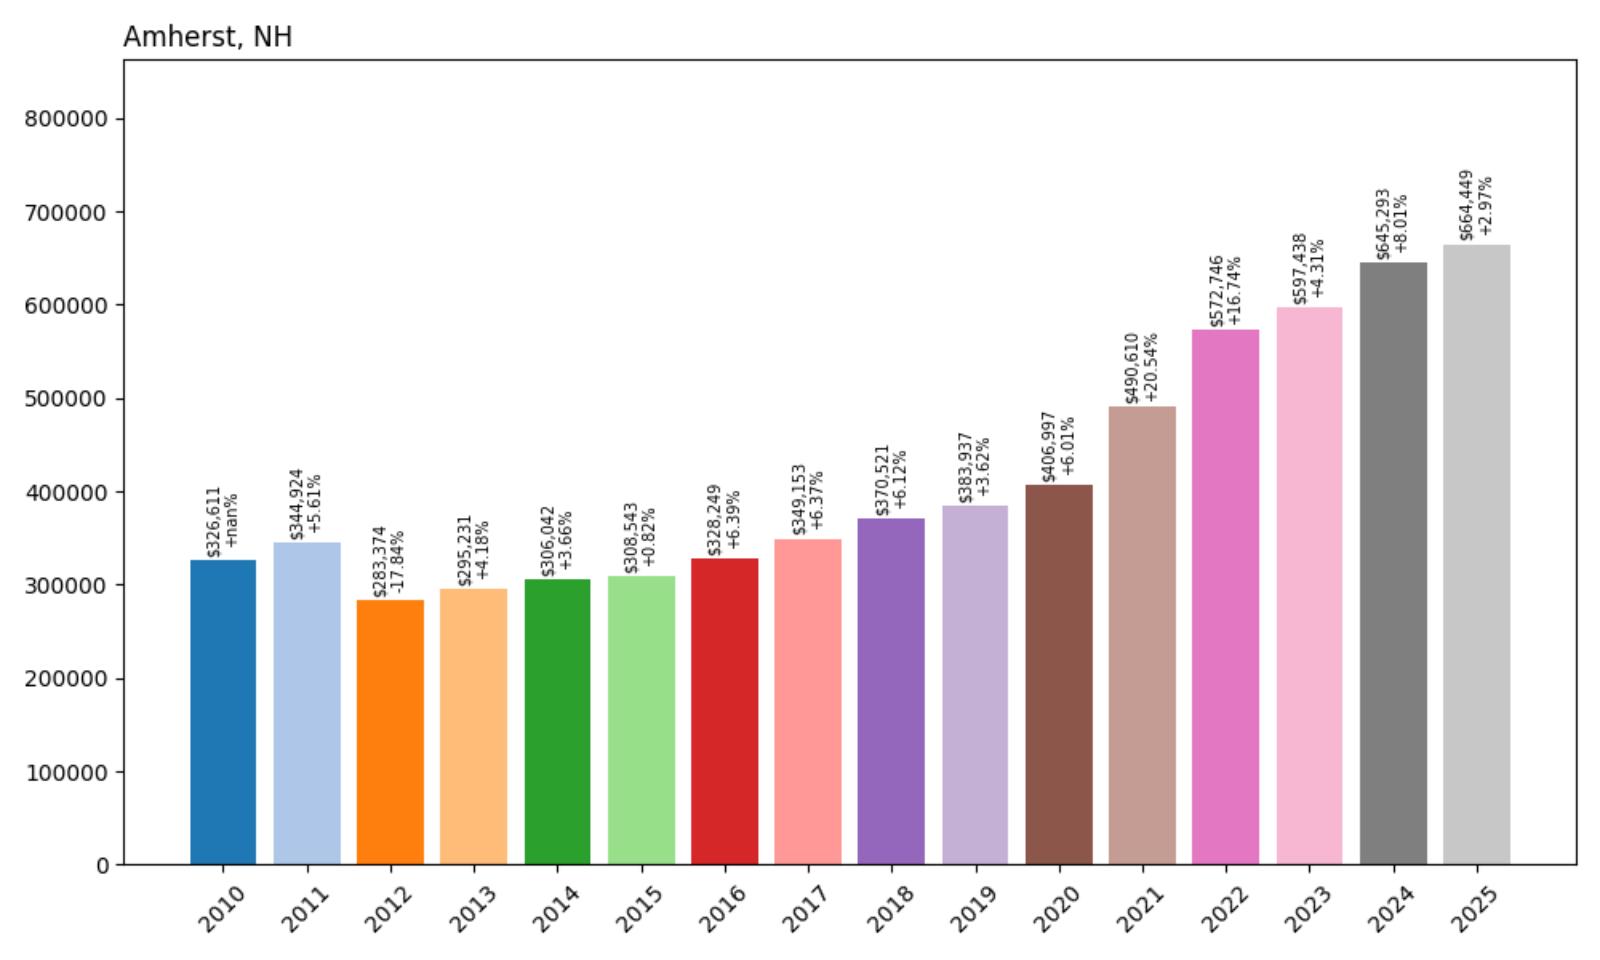
- 2010: $326,611
- 2011: $344,924 (+$18,313, +5.61% from previous year)
- 2012: $283,374 (-$61,549, -17.84% from previous year)
- 2013: $295,231 (+$11,856, +4.18% from previous year)
- 2014: $306,042 (+$10,812, +3.66% from previous year)
- 2015: $308,543 (+$2,500, +0.82% from previous year)
- 2016: $328,249 (+$19,706, +6.39% from previous year)
- 2017: $349,153 (+$20,904, +6.37% from previous year)
- 2018: $370,521 (+$21,369, +6.12% from previous year)
- 2019: $383,937 (+$13,416, +3.62% from previous year)
- 2020: $406,997 (+$23,060, +6.01% from previous year)
- 2021: $490,610 (+$83,613, +20.54% from previous year)
- 2022: $572,746 (+$82,136, +16.74% from previous year)
- 2023: $597,438 (+$24,692, +4.31% from previous year)
- 2024: $645,293 (+$47,855, +8.01% from previous year)
- 2025: $664,449 (+$19,156, +2.97% from previous year)
Amherst experienced severe market disruption in 2012, with home values plummeting nearly 18% in a single year before beginning a gradual recovery. The town showed consistent growth through the late 2010s before experiencing dramatic acceleration during 2021-2022, when values increased by over 37% in two years. The current median price of $664,449 represents slightly more than double the 2010 starting point, demonstrating remarkable long-term appreciation despite early volatility.
Amherst – Suburban Excellence in Southern New Hampshire
Amherst stands as one of southern New Hampshire’s most desirable suburban communities, located in Hillsborough County with approximately 11,200 residents. The town has earned recognition for its excellent school system, well-planned residential development, and strong sense of community that appeals to families and professionals throughout the region. Amherst’s location provides convenient access to Manchester and Nashua while maintaining the suburban character and amenities that define high-quality residential communities.
The town’s real estate market reflects its reputation as a premier family destination, with homes consistently commanding premium prices due to the area’s educational excellence and community amenities. Amherst offers diverse housing options, from historic homes in the village center to modern developments in residential neighborhoods, all benefiting from the town’s commitment to maintaining high standards for development and public services. The area’s recreational facilities, including parks, trails, and sports complexes, enhance quality of life and support sustained property values.
27. Brookline – 160% Home Price Increase Since 2010
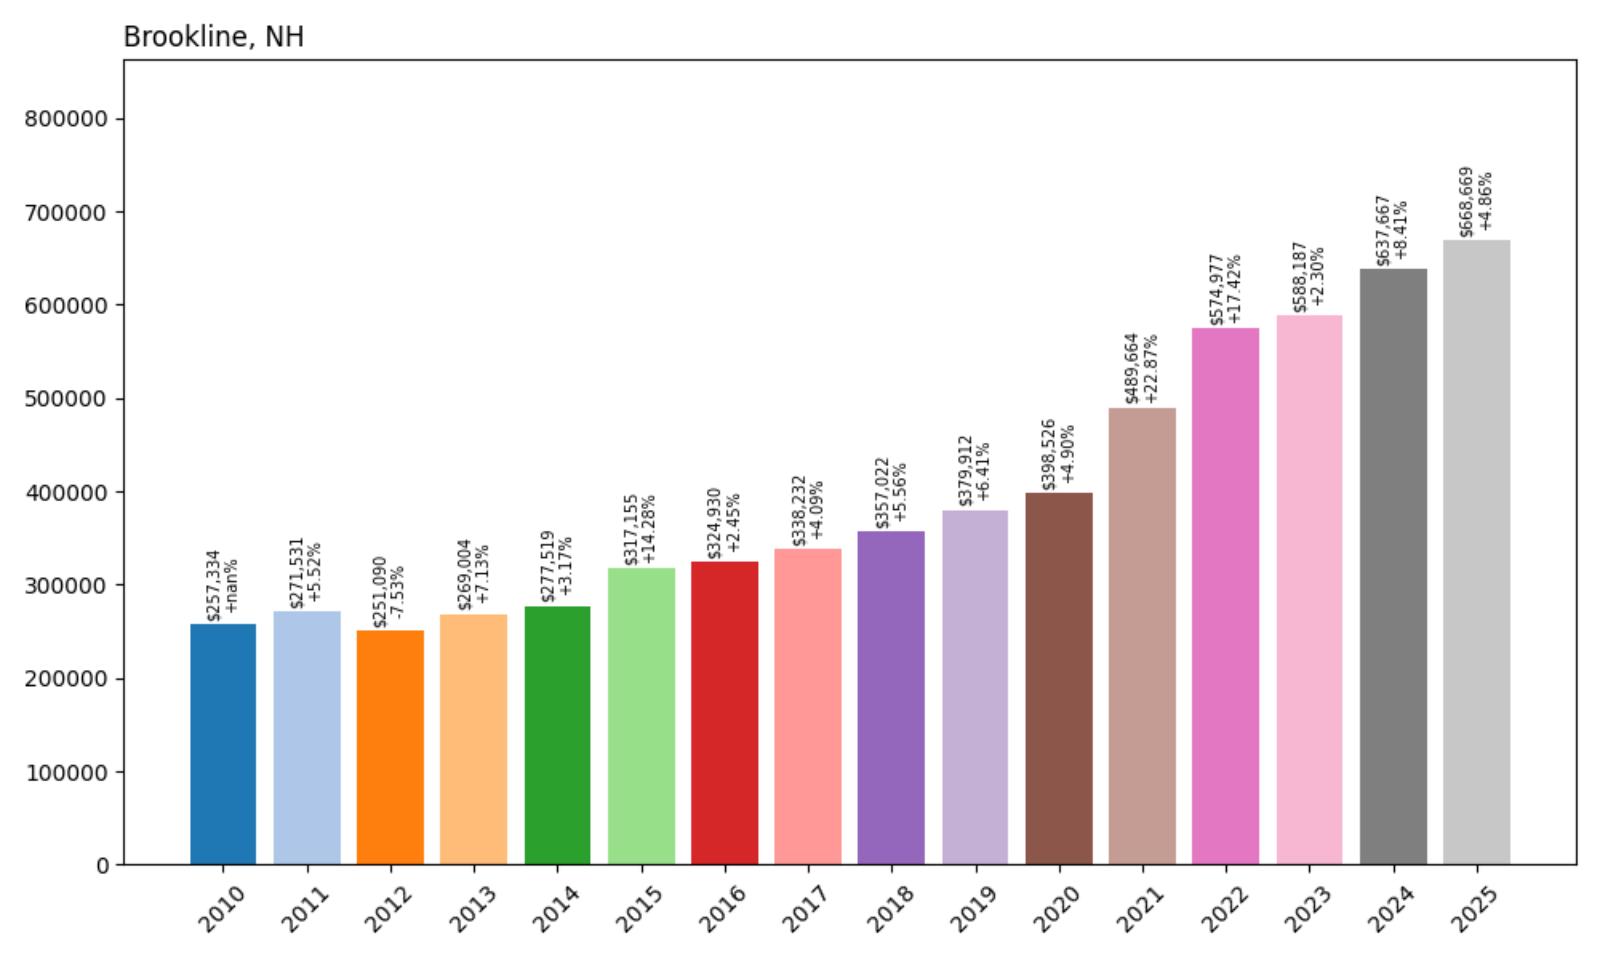
- 2010: $257,334
- 2011: $271,531 (+$14,197, +5.52% from previous year)
- 2012: $251,090 (-$20,441, -7.53% from previous year)
- 2013: $269,004 (+$17,915, +7.13% from previous year)
- 2014: $277,519 (+$8,514, +3.17% from previous year)
- 2015: $317,155 (+$39,636, +14.28% from previous year)
- 2016: $324,930 (+$7,775, +2.45% from previous year)
- 2017: $338,232 (+$13,302, +4.09% from previous year)
- 2018: $357,022 (+$18,790, +5.56% from previous year)
- 2019: $379,912 (+$22,890, +6.41% from previous year)
- 2020: $398,526 (+$18,615, +4.90% from previous year)
- 2021: $489,664 (+$91,138, +22.87% from previous year)
- 2022: $574,977 (+$85,314, +17.42% from previous year)
- 2023: $588,187 (+$13,209, +2.30% from previous year)
- 2024: $637,667 (+$49,480, +8.41% from previous year)
- 2025: $668,669 (+$31,002, +4.86% from previous year)
Brookline’s housing market showed resilience through the early 2010s recession, with a notable surge beginning in 2015 when values increased by over 14% in a single year. The community maintained steady growth through the late 2010s before experiencing dramatic acceleration during the pandemic period, with values increasing by over 40% between 2020 and 2022. The 160% total appreciation since 2010 represents one of the strongest performance records among southern New Hampshire communities.
Brookline – Rural Charm Within Commuting Distance
Brookline, located in Hillsborough County near the Massachusetts border, offers an appealing combination of rural character and suburban accessibility that has driven significant real estate appreciation. This community of approximately 5,400 residents provides the benefits of small-town living while maintaining reasonable commuting distances to major employment centers in both New Hampshire and Massachusetts. The town’s scenic rural roads, historic buildings, and agricultural heritage create an authentic New England atmosphere that commands premium pricing.
The town’s real estate market benefits from its strategic location that allows residents to enjoy rural amenities while accessing urban employment opportunities. Brookline offers larger lot sizes and more privacy than suburban alternatives while providing excellent school systems and community services that appeal to families. The area’s natural beauty, including forests, streams, and conservation areas, enhances property values and creates sustained demand from buyers seeking lifestyle alternatives to more developed areas.
26. Hebron – 132% Home Price Increase Since 2010
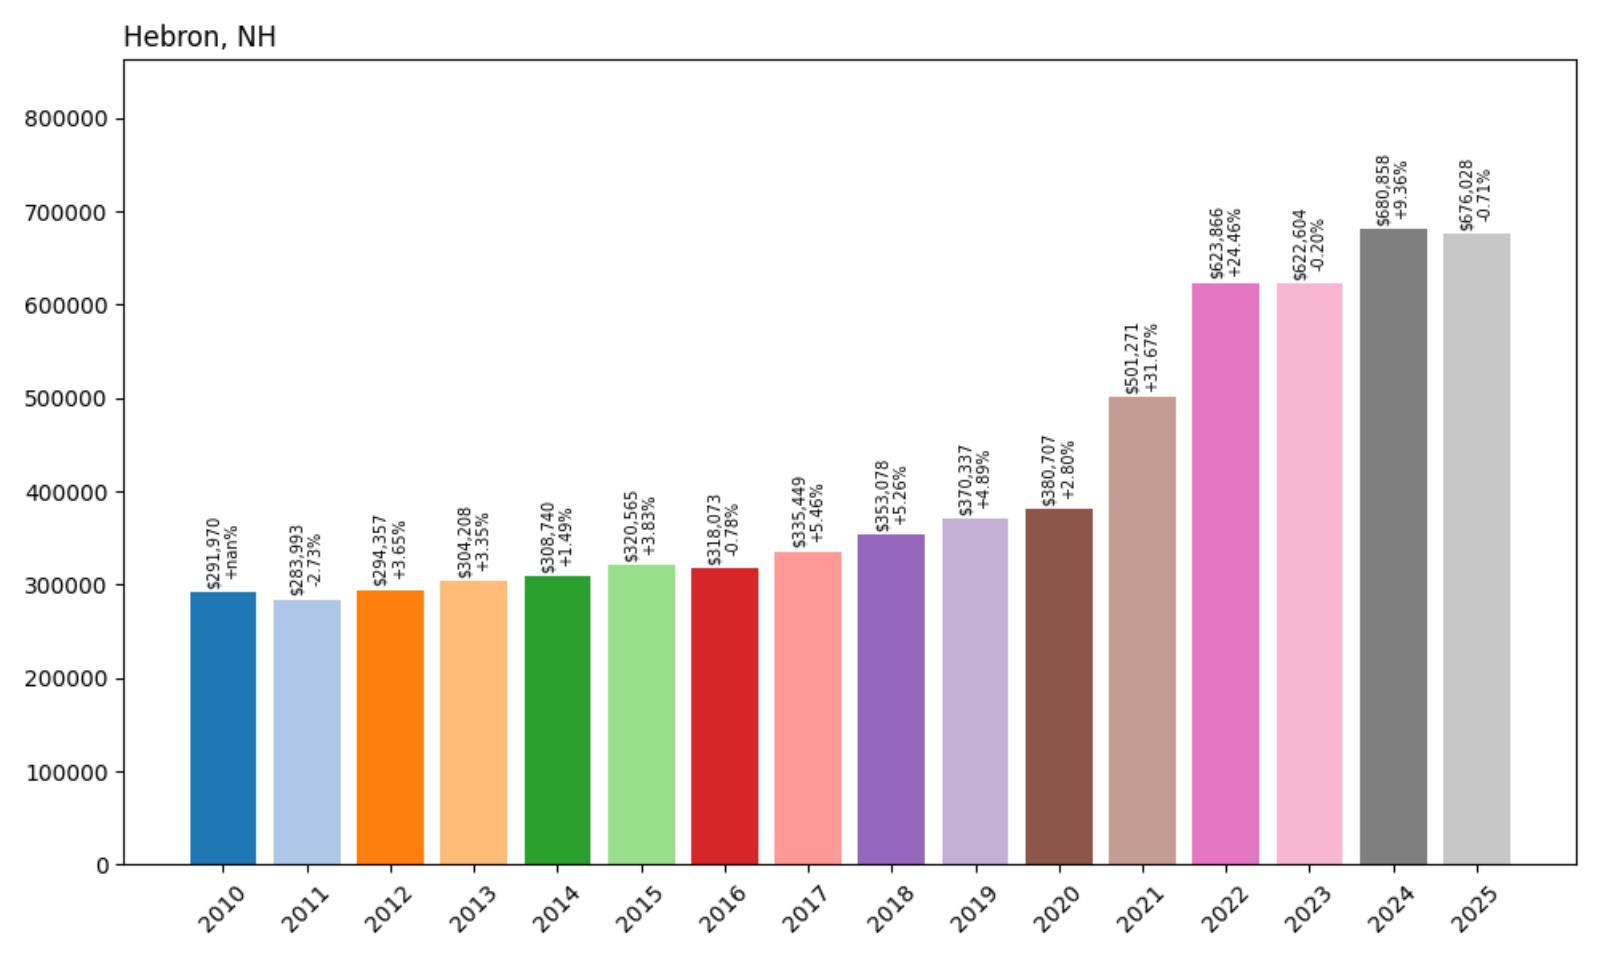
- 2010: $291,970
- 2011: $283,993 (-$7,978, -2.73% from previous year)
- 2012: $294,357 (+$10,365, +3.65% from previous year)
- 2013: $304,208 (+$9,851, +3.35% from previous year)
- 2014: $308,740 (+$4,532, +1.49% from previous year)
- 2015: $320,565 (+$11,825, +3.83% from previous year)
- 2016: $318,073 (-$2,492, -0.78% from previous year)
- 2017: $335,449 (+$17,377, +5.46% from previous year)
- 2018: $353,078 (+$17,629, +5.26% from previous year)
- 2019: $370,337 (+$17,259, +4.89% from previous year)
- 2020: $380,707 (+$10,370, +2.80% from previous year)
- 2021: $501,271 (+$120,564, +31.67% from previous year)
- 2022: $623,866 (+$122,596, +24.46% from previous year)
- 2023: $622,604 (-$1,262, -0.20% from previous year)
- 2024: $680,858 (+$58,254, +9.36% from previous year)
- 2025: $676,028 (-$4,830, -0.71% from previous year)
Hebron maintained relatively modest growth through most of the 2010s decade, with steady but unremarkable annual increases averaging around 3-5% per year. The transformation during 2021-2022 was extraordinary, with home values increasing by over 56% in just two years, reflecting intense demand for lakefront and rural properties during the pandemic. Despite slight recent declines, the overall 132% appreciation since 2010 demonstrates the community’s strong appeal to affluent buyers.
Hebron – Pristine Newfound Lake Community
Hebron occupies a coveted location on Newfound Lake in Grafton County, offering some of New Hampshire’s clearest and most pristine lake waters along with spectacular mountain views. This community of approximately 600 residents represents one of the state’s most exclusive lakefront destinations, where natural beauty and recreational opportunities drive significant real estate demand. The town’s location provides access to both water and mountain recreation while maintaining the rural character that defines much of central New Hampshire.
The town’s real estate market is heavily influenced by its lakefront properties, which command premium prices that significantly affect the overall median home value. Hebron attracts both year-round residents seeking natural amenities and seasonal property owners looking for vacation retreats in one of New Hampshire’s most scenic settings. The area’s recreational opportunities include swimming, boating, fishing, and hiking, with nearby ski areas providing four-season appeal that supports strong property values.
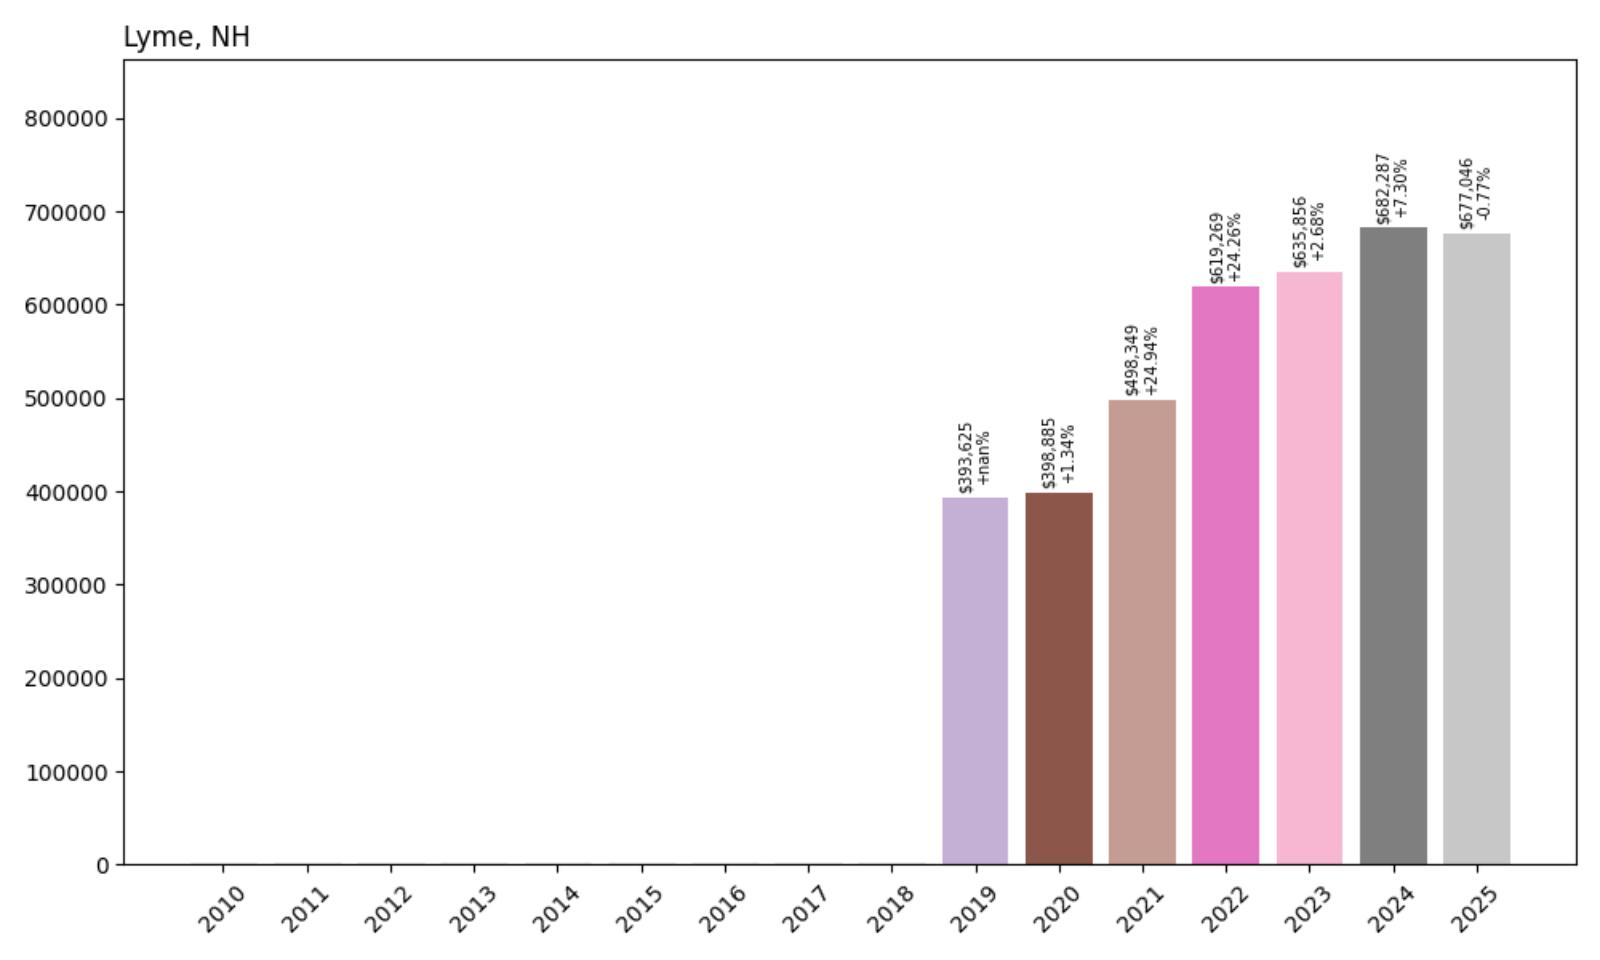
25. Lyme – 72% Home Price Increase Since 2019
- 2010: N/A
- 2011: N/A
- 2012: N/A
- 2013: N/A
- 2014: N/A
- 2015: N/A
- 2016: N/A
- 2017: N/A
- 2018: N/A
- 2019: $393,625
- 2020: $398,885 (+$5,261, +1.34% from previous year)
- 2021: $498,349 (+$99,463, +24.94% from previous year)
- 2022: $619,269 (+$120,921, +24.26% from previous year)
- 2023: $635,856 (+$16,587, +2.68% from previous year)
- 2024: $682,287 (+$46,431, +7.30% from previous year)
- 2025: $677,046 (-$5,242, -0.77% from previous year)
Lyme’s housing data begins in 2019, showing modest initial growth before experiencing dramatic acceleration during 2021-2022 when home values increased by nearly 50% over two years. Despite a slight decline in 2025, the 72% appreciation since 2019 represents remarkable growth over just six years. The current median price of $677,046 positions Lyme among New Hampshire’s higher-value communities despite its relatively recent emergence in the data.
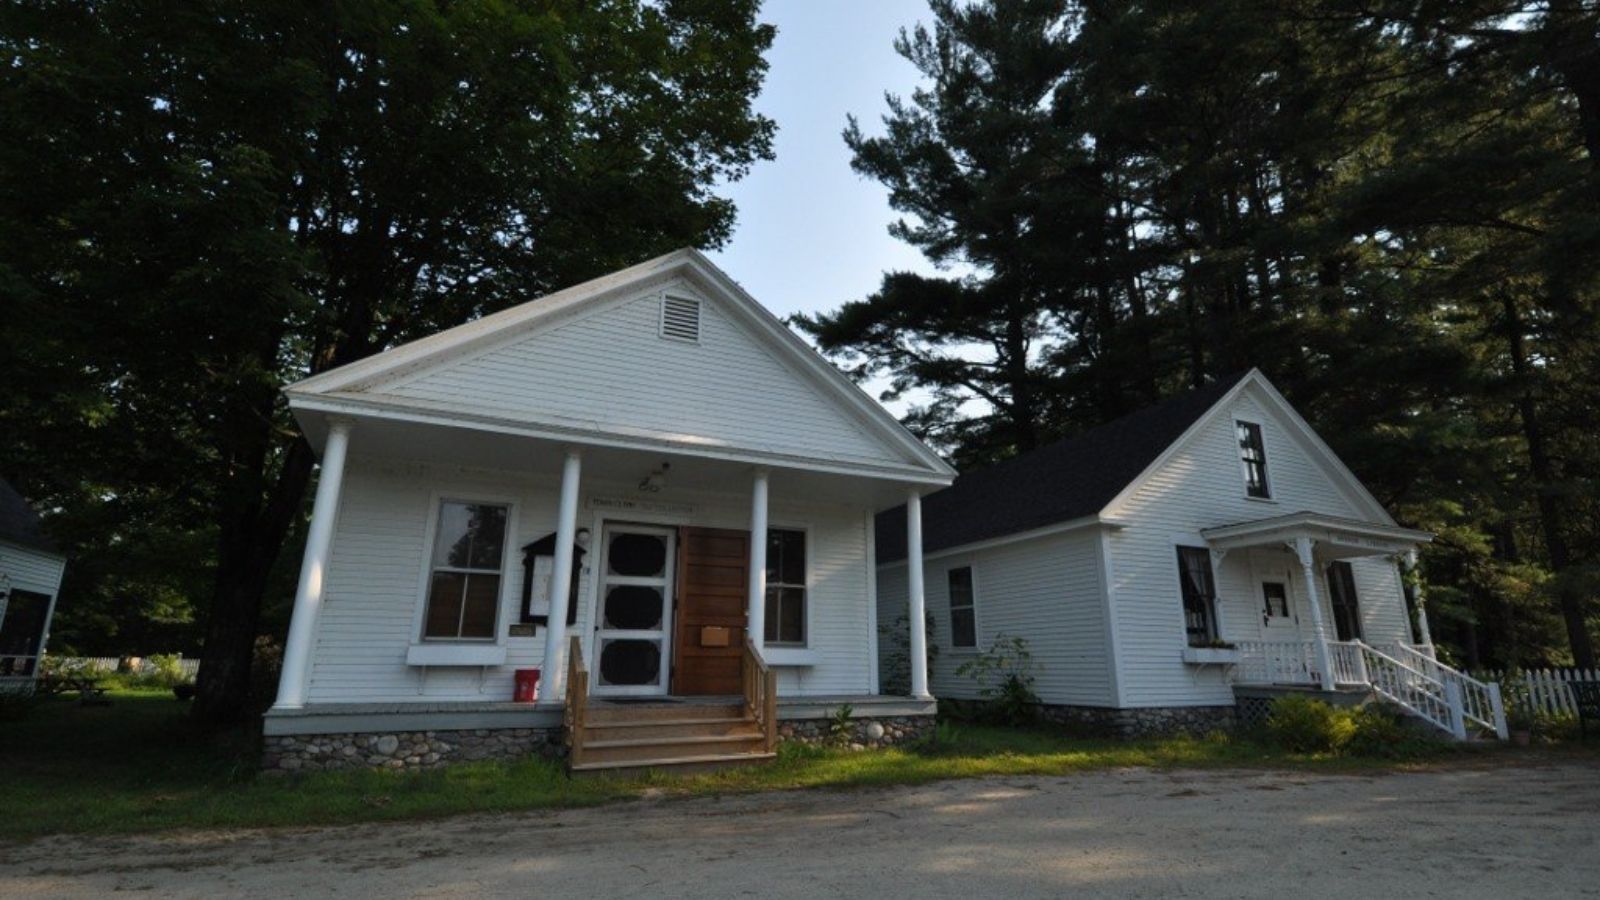
Lyme – Dartmouth Area Prestige and Natural Beauty
Lyme, located in Grafton County adjacent to Hanover and Dartmouth College, benefits from its association with one of New England’s most prestigious educational institutions while maintaining distinct rural character. This community of approximately 1,900 residents offers large estates, historic properties, and scenic rural roads that appeal to affluent buyers seeking privacy and natural beauty within reasonable distance of educational and cultural amenities. The town’s location along the Connecticut River provides additional recreational opportunities and scenic value.
The town’s real estate market reflects its appeal to faculty, administrators, and other professionals associated with Dartmouth College, as well as affluent retirees and second-home owners seeking prestigious addresses in a scenic setting. Lyme offers some of the area’s most exclusive residential properties, including historic estates and modern luxury homes on large parcels that provide privacy and natural amenities. The community’s rural character and proximity to educational institutions create a unique combination that supports premium property values.
24. Sunapee – 119% Home Price Increase Since 2010
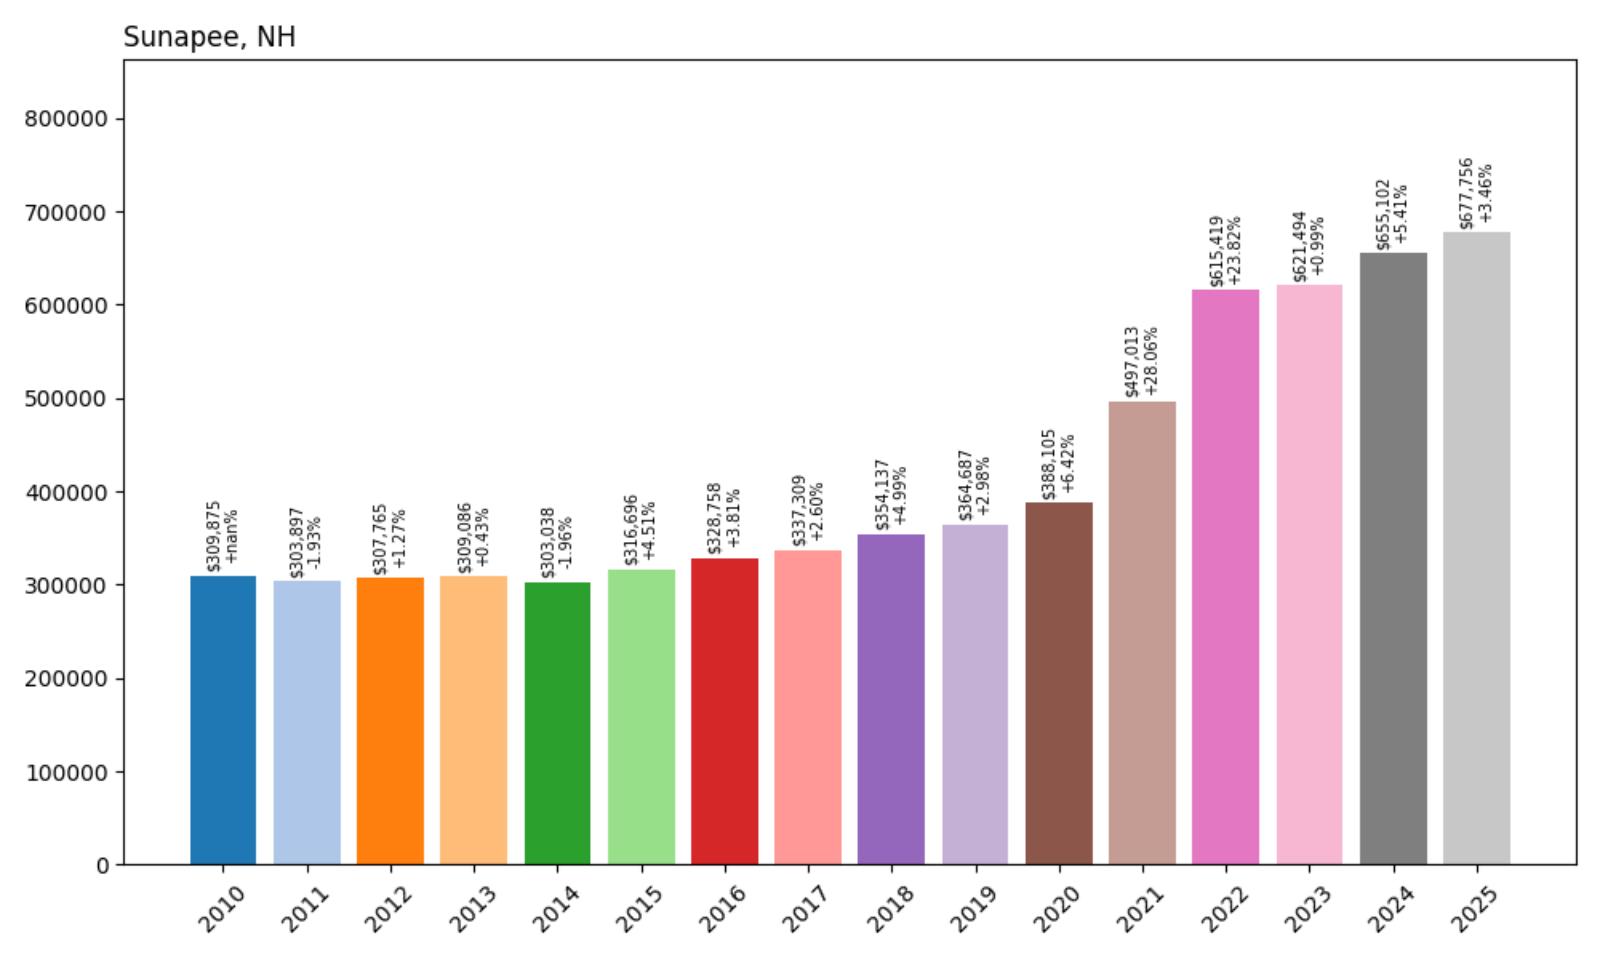
- 2010: $309,875
- 2011: $303,897 (-$5,978, -1.93% from previous year)
- 2012: $307,765 (+$3,868, +1.27% from previous year)
- 2013: $309,086 (+$1,321, +0.43% from previous year)
- 2014: $303,038 (-$6,048, -1.96% from previous year)
- 2015: $316,696 (+$13,658, +4.51% from previous year)
- 2016: $328,758 (+$12,062, +3.81% from previous year)
- 2017: $337,309 (+$8,551, +2.60% from previous year)
- 2018: $354,137 (+$16,829, +4.99% from previous year)
- 2019: $364,687 (+$10,550, +2.98% from previous year)
- 2020: $388,105 (+$23,418, +6.42% from previous year)
- 2021: $497,013 (+$108,908, +28.06% from previous year)
- 2022: $615,419 (+$118,405, +23.82% from previous year)
- 2023: $621,494 (+$6,075, +0.99% from previous year)
- 2024: $655,102 (+$33,607, +5.41% from previous year)
- 2025: $677,756 (+$22,655, +3.46% from previous year)
Sunapee’s housing market remained relatively flat through the first half of the 2010s, with values showing little consistent direction through 2017. The transformation beginning in 2018 gained momentum through 2020 before exploding during 2021-2022, when home values increased by over 52% in two years. The 119% total appreciation since 2010 reflects the community’s emergence as a premier recreational and residential destination in central New Hampshire.
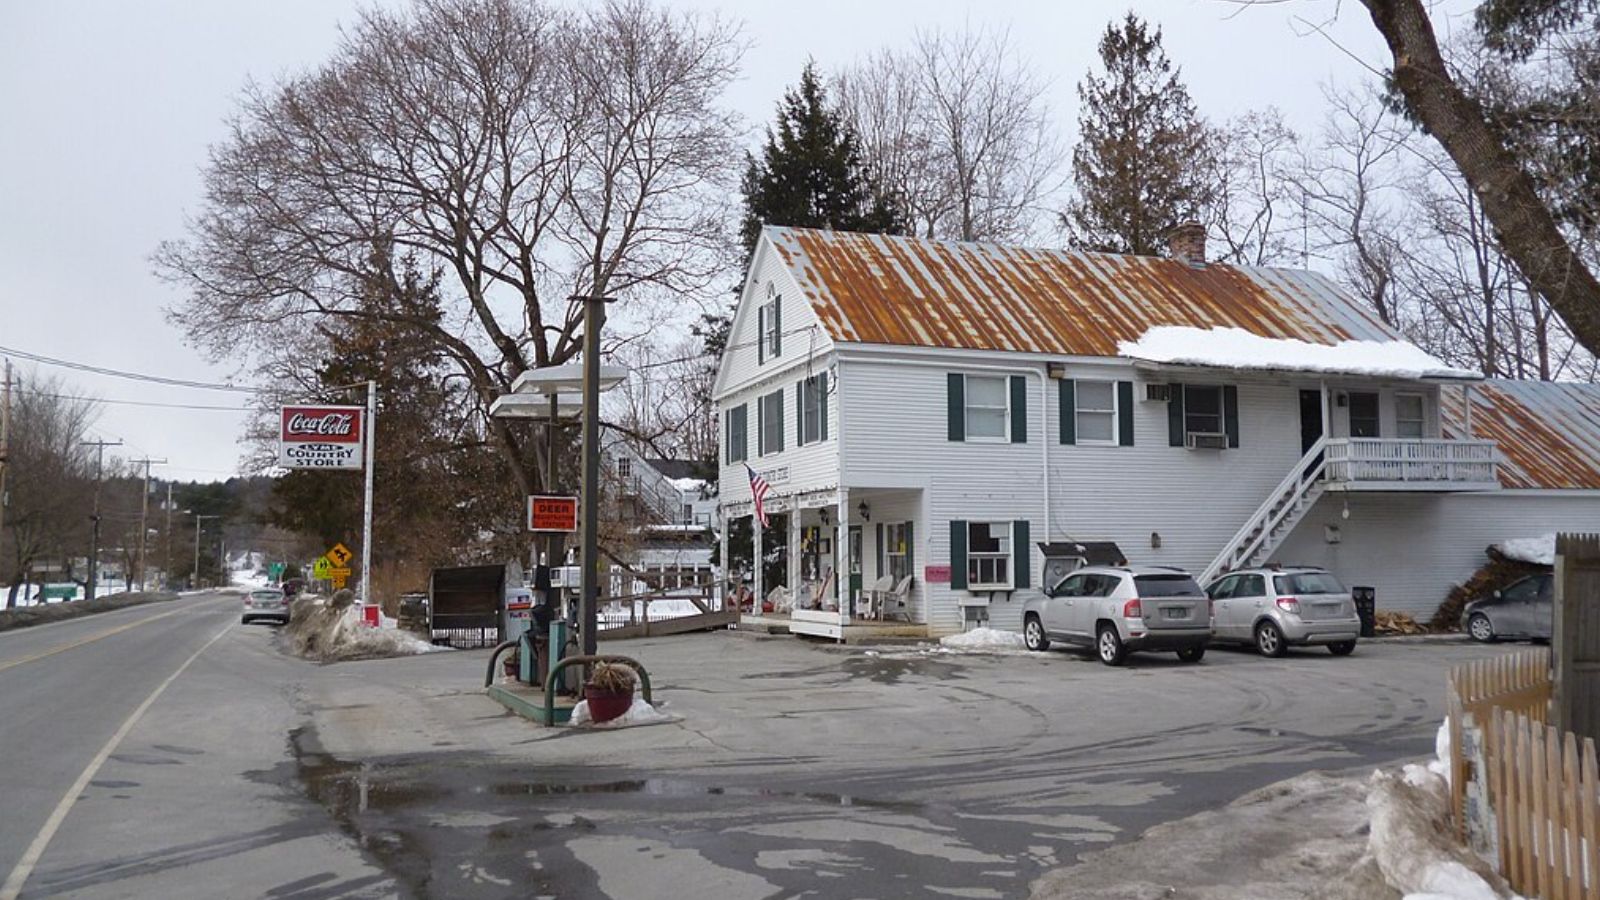
Sunapee – Four-Season Recreation Destination
Sunapee, located in Sullivan County around the scenic Lake Sunapee and Mount Sunapee ski area, has evolved into one of New Hampshire’s premier four-season recreational destinations. This community of approximately 3,400 residents offers an exceptional combination of water and mountain recreation that appeals to both year-round residents and seasonal property owners. The area’s natural amenities, including pristine lake waters and excellent skiing, create year-round appeal that drives significant real estate demand.
The town’s real estate market capitalizes on its unique combination of lake and mountain recreation, with properties ranging from lakefront estates to ski-area condominiums and everything in between. Sunapee’s appeal extends throughout the year, with summer activities centered on the lake and winter recreation at Mount Sunapee Resort, creating sustained demand that supports strong property values. The area’s scenic beauty and recreational opportunities attract buyers from throughout New England seeking both primary and vacation homes.
23. Pelham – 136% Home Price Increase Since 2010
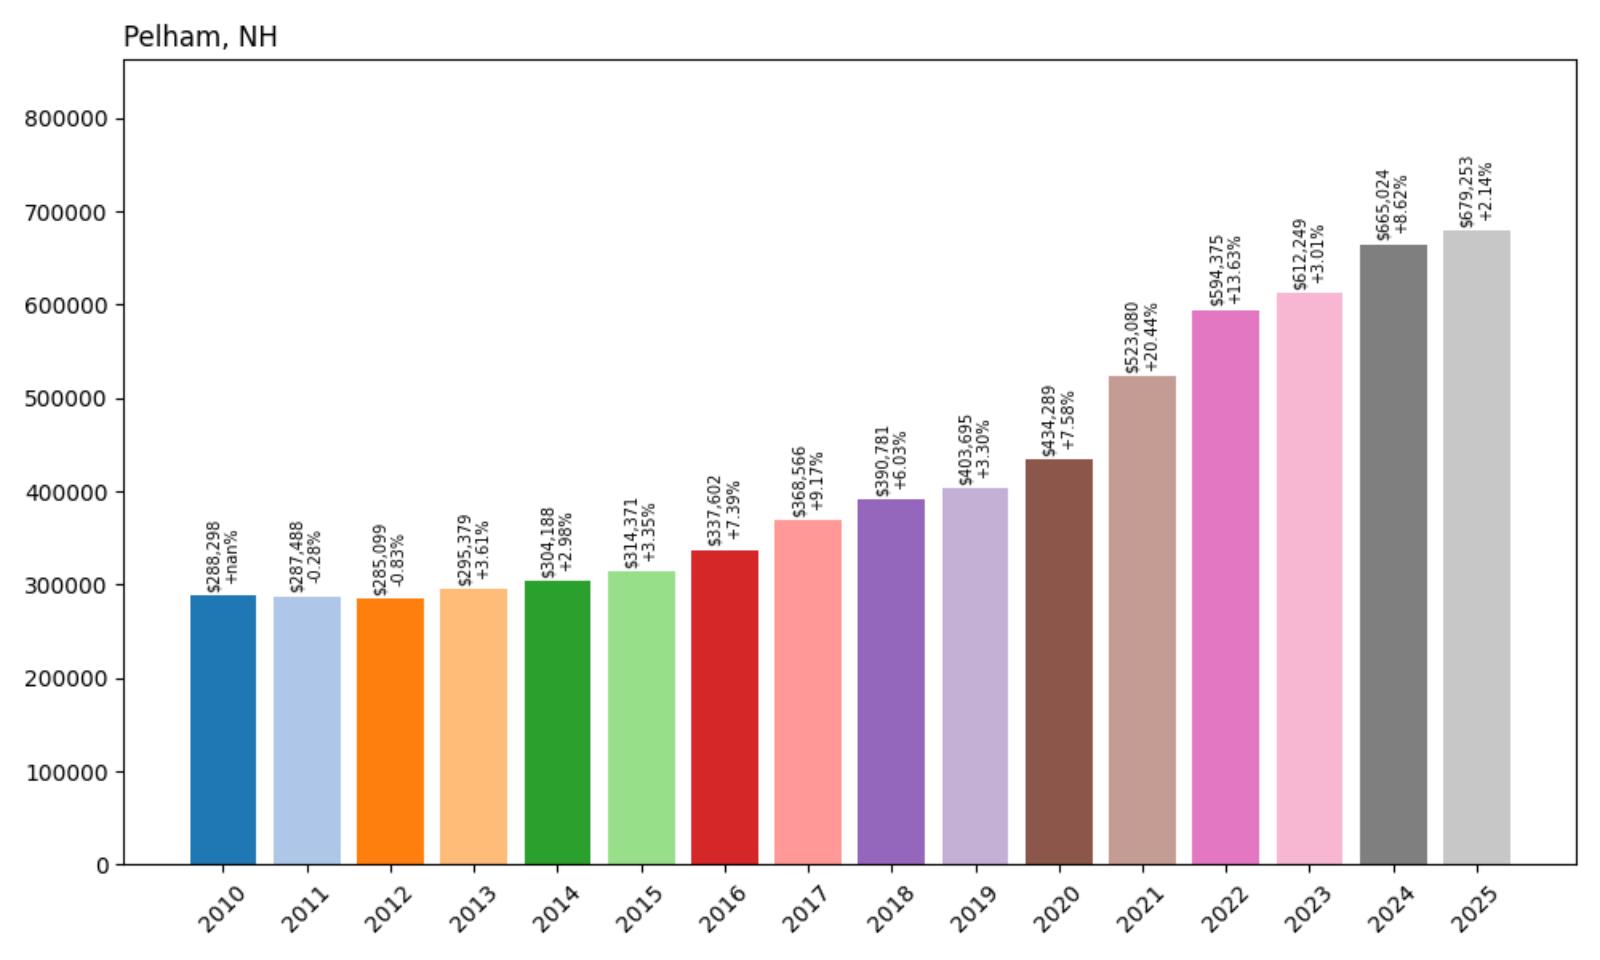
- 2010: $288,298
- 2011: $287,488 (-$810, -0.28% from previous year)
- 2012: $285,099 (-$2,389, -0.83% from previous year)
- 2013: $295,379 (+$10,280, +3.61% from previous year)
- 2014: $304,188 (+$8,808, +2.98% from previous year)
- 2015: $314,371 (+$10,183, +3.35% from previous year)
- 2016: $337,602 (+$23,231, +7.39% from previous year)
- 2017: $368,566 (+$30,964, +9.17% from previous year)
- 2018: $390,781 (+$22,215, +6.03% from previous year)
- 2019: $403,695 (+$12,914, +3.30% from previous year)
- 2020: $434,289 (+$30,594, +7.58% from previous year)
- 2021: $523,080 (+$88,790, +20.44% from previous year)
- 2022: $594,375 (+$71,295, +13.63% from previous year)
- 2023: $612,249 (+$17,875, +3.01% from previous year)
- 2024: $665,024 (+$52,775, +8.62% from previous year)
- 2025: $679,253 (+$14,229, +2.14% from previous year)
Pelham’s housing market remained stable through the early 2010s before beginning steady acceleration in 2016 that continued through the pandemic period. The most significant growth occurred during 2021-2022, when home values increased by over 34% in two years, reflecting the community’s appeal to buyers seeking suburban amenities with regional access. The 136% total appreciation since 2010 demonstrates sustained demand driven by the town’s strategic location and family-friendly amenities.
Pelham – Strategic Location Drives Family Appeal
Pelham occupies a prime location in Hillsborough County along the Massachusetts border, providing residents with excellent access to employment centers in both states while maintaining suburban New Hampshire character. This community of approximately 14,000 residents has become increasingly popular with families and professionals seeking alternatives to more expensive Massachusetts communities while maintaining reasonable commuting distances. The town’s location along major transportation corridors enhances its appeal to workers throughout the greater Boston metropolitan area.
The town’s real estate market benefits from its role as an affordable alternative to Massachusetts suburban communities while offering excellent schools and family amenities. Pelham provides diverse housing options, from starter homes to luxury properties, all benefiting from the community’s commitment to maintaining high-quality public services and recreational facilities. The area’s parks, sports complexes, and community programs enhance quality of life and support sustained demand from families with children.
22. Madbury – 133% Home Price Increase Since 2010

- 2010: $292,041
- 2011: $300,985 (+$8,944, +3.06% from previous year)
- 2012: $285,370 (-$15,615, -5.19% from previous year)
- 2013: $302,183 (+$16,813, +5.89% from previous year)
- 2014: $322,628 (+$20,446, +6.77% from previous year)
- 2015: $328,557 (+$5,928, +1.84% from previous year)
- 2016: $339,985 (+$11,429, +3.48% from previous year)
- 2017: $356,526 (+$16,540, +4.86% from previous year)
- 2018: $380,424 (+$23,899, +6.70% from previous year)
- 2019: $384,807 (+$4,383, +1.15% from previous year)
- 2020: $394,451 (+$9,644, +2.51% from previous year)
- 2021: $508,076 (+$113,626, +28.81% from previous year)
- 2022: $592,967 (+$84,891, +16.71% from previous year)
- 2023: $613,924 (+$20,957, +3.53% from previous year)
- 2024: $664,325 (+$50,401, +8.21% from previous year)
- 2025: $679,692 (+$15,367, +2.31% from previous year)
Madbury’s housing market showed consistent growth through most of the 2010s, with particularly strong performance beginning in 2014. The most dramatic transformation occurred during 2021, when home values increased by nearly 29% in a single year, followed by continued strong growth through 2022. The 133% total appreciation since 2010 reflects the community’s appeal to buyers seeking small-town character with access to regional amenities and employment opportunities.
Madbury – Small Town Character Near Durham
Madbury, located in Strafford County adjacent to Durham and the University of New Hampshire, offers small-town residential character within the broader university community ecosystem. This town of approximately 1,800 residents provides rural amenities and larger lot sizes while maintaining access to the cultural and economic opportunities associated with the university presence. The community’s location offers the benefits of both rural living and proximity to educational institutions and regional employment centers.
The town’s real estate market benefits from its proximity to the University of New Hampshire while maintaining distinct residential character that appeals to faculty, staff, and professionals seeking alternatives to more developed areas. Madbury offers larger properties and more privacy than communities closer to Durham while providing reasonable commuting distances to major employers throughout the Seacoast region. The area’s rural roads, conservation areas, and natural amenities enhance property values and appeal to buyers seeking lifestyle alternatives.
21. Center Harbor – 110% Home Price Increase Since 2010

- 2010: $329,680
- 2011: $327,173 (-$2,507, -0.76% from previous year)
- 2012: $325,466 (-$1,708, -0.52% from previous year)
- 2013: $311,963 (-$13,502, -4.15% from previous year)
- 2014: $304,344 (-$7,620, -2.44% from previous year)
- 2015: $312,888 (+$8,544, +2.81% from previous year)
- 2016: $325,987 (+$13,099, +4.19% from previous year)
- 2017: $345,560 (+$19,573, +6.00% from previous year)
- 2018: $368,370 (+$22,809, +6.60% from previous year)
- 2019: $387,440 (+$19,070, +5.18% from previous year)
- 2020: $399,554 (+$12,114, +3.13% from previous year)
- 2021: $521,102 (+$121,548, +30.42% from previous year)
- 2022: $623,608 (+$102,505, +19.67% from previous year)
- 2023: $643,162 (+$19,554, +3.14% from previous year)
- 2024: $719,512 (+$76,350, +11.87% from previous year)
- 2025: $693,006 (-$26,506, -3.68% from previous year)
Center Harbor experienced a challenging period through the mid-2010s, with home values declining through 2014 before beginning a gradual recovery. The transformation during 2021-2022 was remarkable, with values increasing by over 50% in two years, reflecting intense demand for lakefront properties during the pandemic. Despite a recent decline in 2025, the overall 110% appreciation since 2010 demonstrates the community’s strong long-term appeal.
Center Harbor – Premier Lake Winnipesaukee Location
Center Harbor occupies one of the most desirable locations on Lake Winnipesaukee, positioned at the northern end of the lake with spectacular water and mountain views. This community of approximately 1,200 residents offers some of New Hampshire’s most exclusive lakefront properties, where natural beauty and recreational opportunities drive significant real estate demand. The town’s location provides access to both lake activities and mountain recreation while maintaining the rural character that defines the Lakes Region.
The town’s real estate market is heavily influenced by its lakefront properties, which command premium prices that significantly affect the overall median home value. Center Harbor attracts affluent buyers seeking both primary and vacation homes in one of New Hampshire’s most scenic settings, with properties ranging from modest lake cottages to luxury waterfront estates. The area’s natural amenities and recreational opportunities create year-round appeal that supports strong property values despite seasonal population fluctuations.
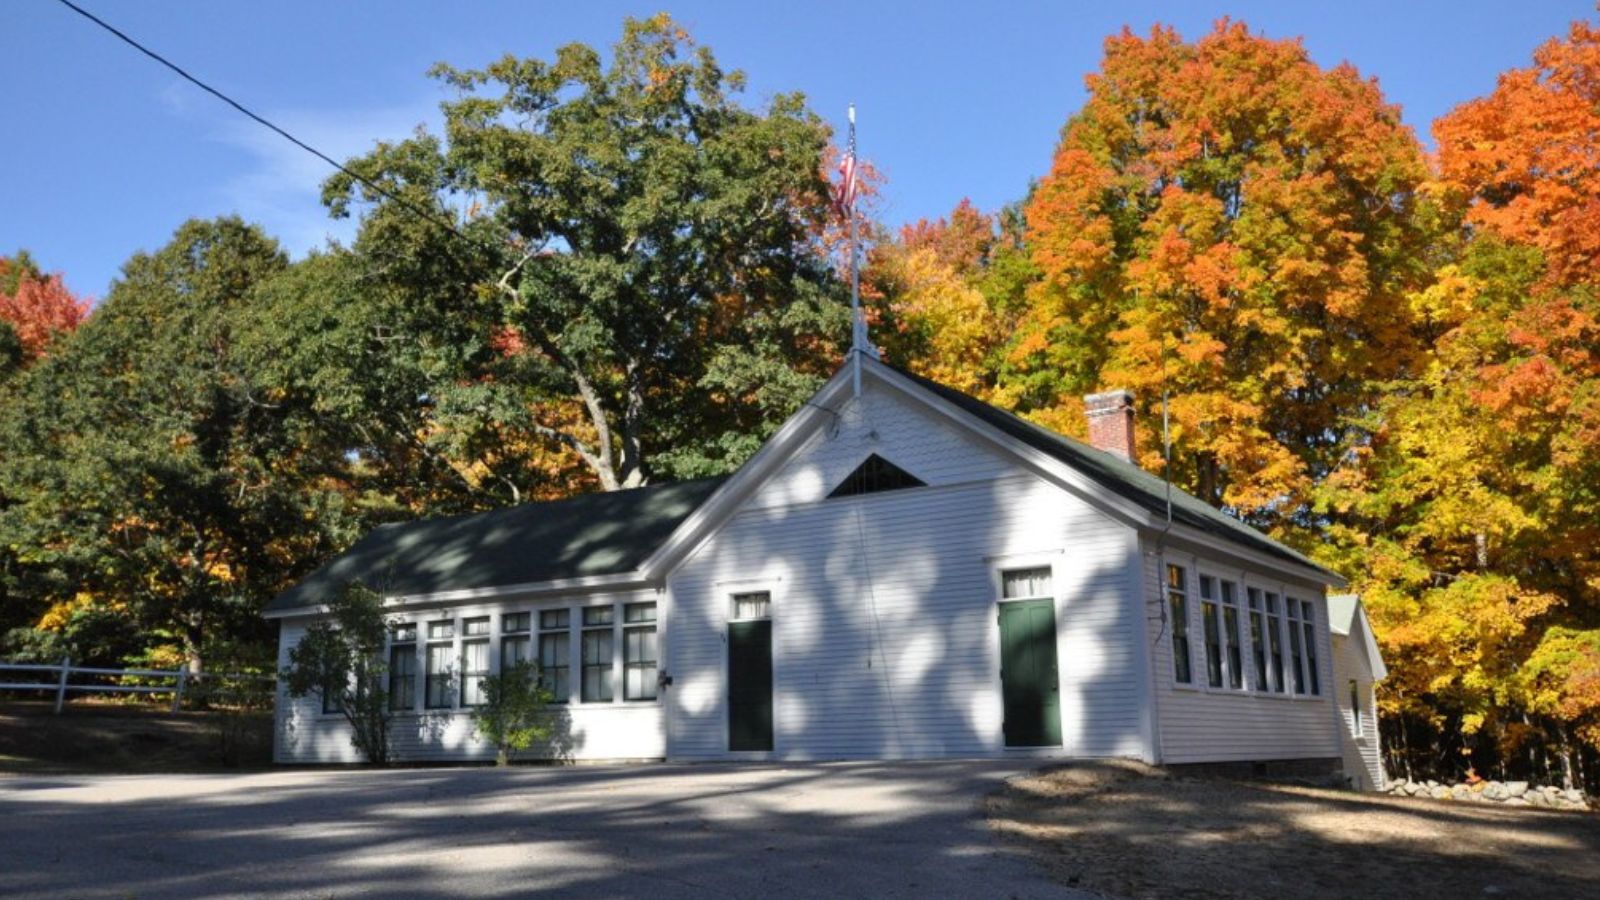
20. Brentwood – 99% Home Price Increase Since 2010
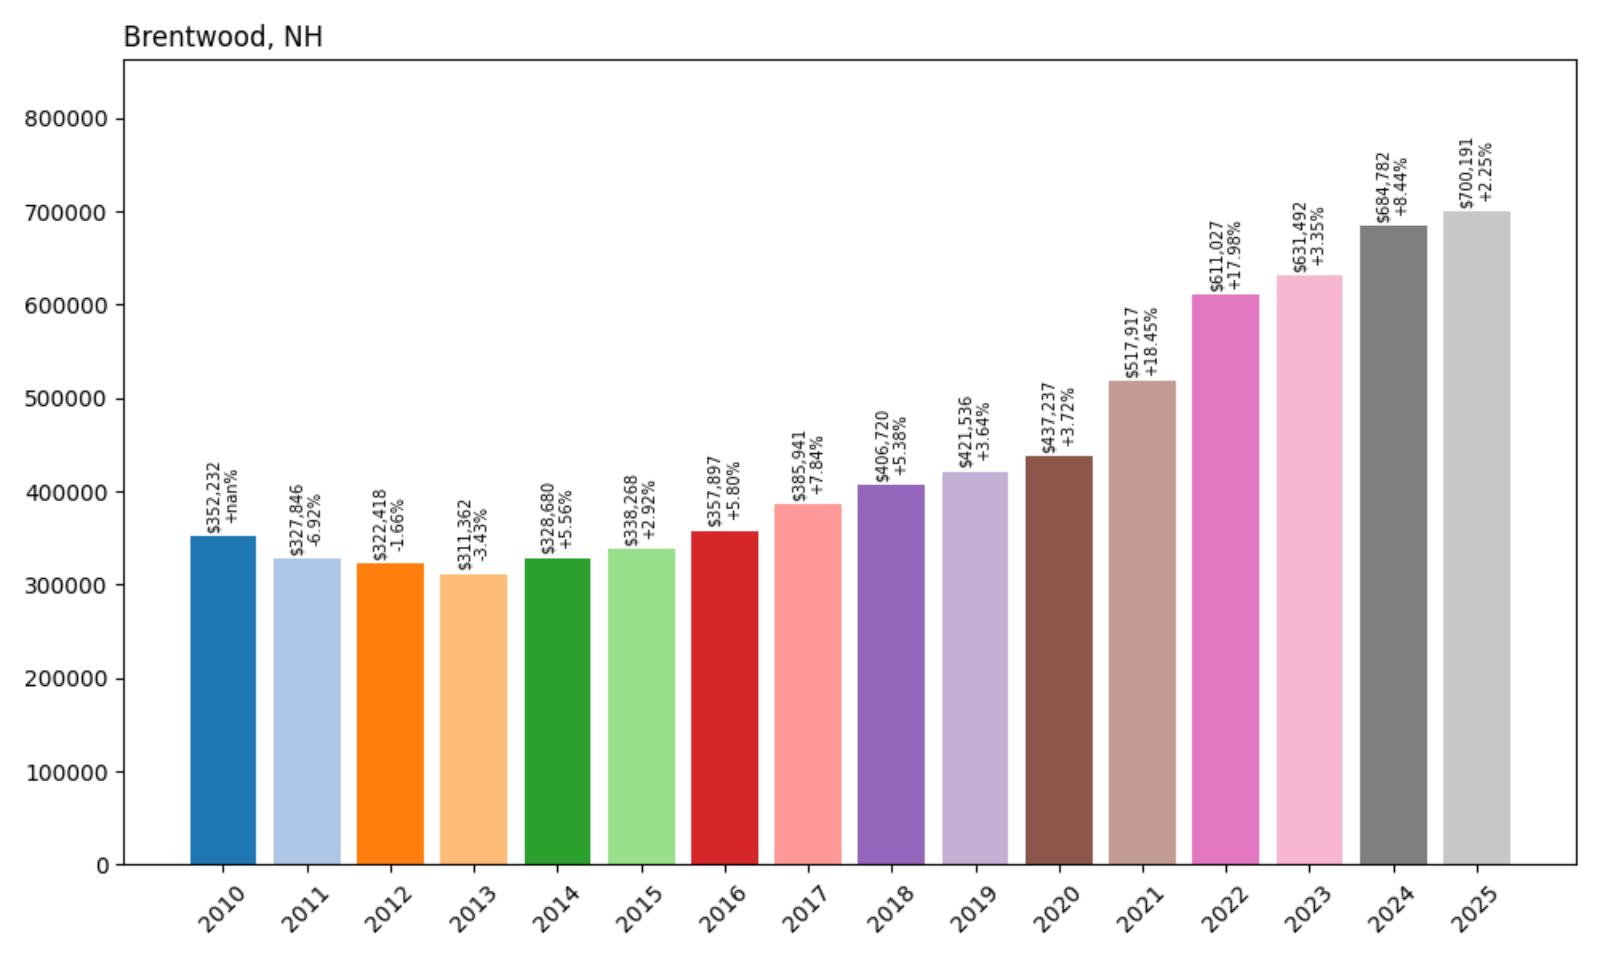
- 2010: $352,232
- 2011: $327,846 (-$24,386, -6.92% from previous year)
- 2012: $322,418 (-$5,428, -1.66% from previous year)
- 2013: $311,362 (-$11,056, -3.43% from previous year)
- 2014: $328,680 (+$17,318, +5.56% from previous year)
- 2015: $338,268 (+$9,588, +2.92% from previous year)
- 2016: $357,897 (+$19,628, +5.80% from previous year)
- 2017: $385,941 (+$28,044, +7.84% from previous year)
- 2018: $406,720 (+$20,779, +5.38% from previous year)
- 2019: $421,536 (+$14,816, +3.64% from previous year)
- 2020: $437,237 (+$15,701, +3.72% from previous year)
- 2021: $517,917 (+$80,680, +18.45% from previous year)
- 2022: $611,027 (+$93,110, +17.98% from previous year)
- 2023: $631,492 (+$20,465, +3.35% from previous year)
- 2024: $684,782 (+$53,290, +8.44% from previous year)
- 2025: $700,191 (+$15,409, +2.25% from previous year)
Brentwood endured a difficult period from 2011 through 2013, with home values declining by over 11% from their 2010 peak. The recovery that began in 2014 gained steady momentum through the late 2010s before accelerating dramatically during 2021-2022, when values increased by over 36% in two years. The current median price of $700,191 represents nearly double the 2010 starting point, demonstrating the community’s strong long-term appreciation potential.
Brentwood – Rural Character With Regional Access
Brentwood, located in Rockingham County with approximately 4,500 residents, offers an appealing combination of rural character and suburban accessibility that has driven consistent real estate appreciation. The community provides the benefits of country living while maintaining reasonable access to employment centers throughout the Seacoast region and southern New Hampshire. Brentwood’s rural roads, agricultural heritage, and natural amenities create an authentic New England atmosphere that attracts buyers seeking alternatives to suburban development patterns.
The town’s real estate market benefits from its location that allows residents to enjoy larger properties and rural amenities while accessing employment and cultural opportunities in nearby urban areas. Brentwood offers diverse housing options, from historic farmhouses to modern developments, all benefiting from the community’s commitment to preserving rural character while accommodating controlled growth. The area’s agricultural lands, conservation areas, and outdoor recreation opportunities enhance property values and create sustained demand from buyers seeking lifestyle alternatives.
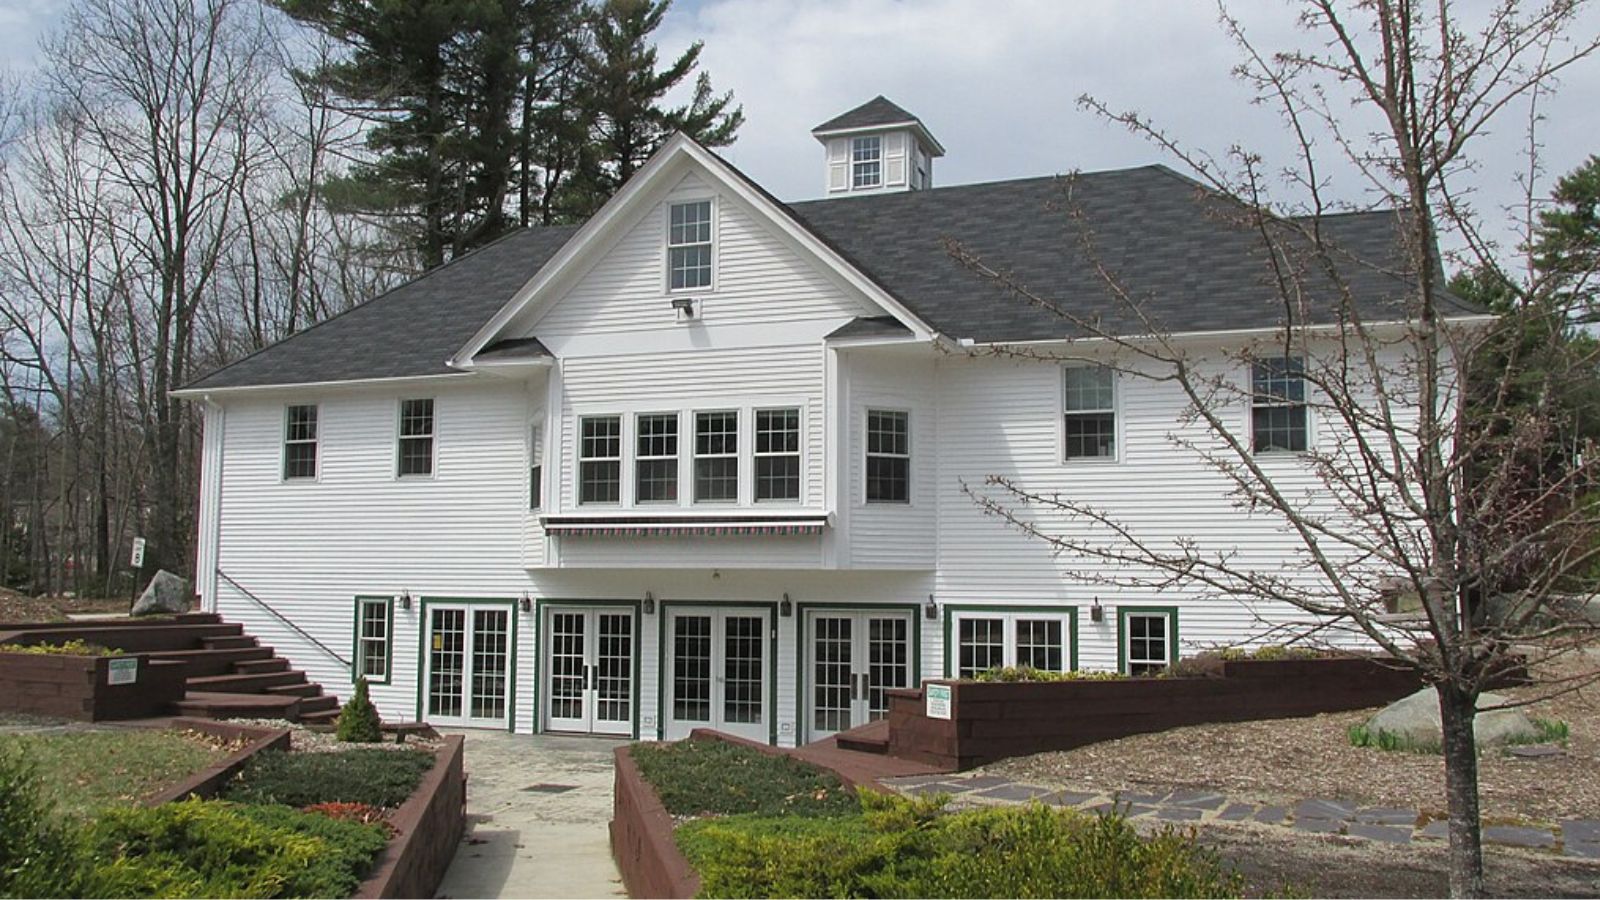
19. Durham – 135% Home Price Increase Since 2010
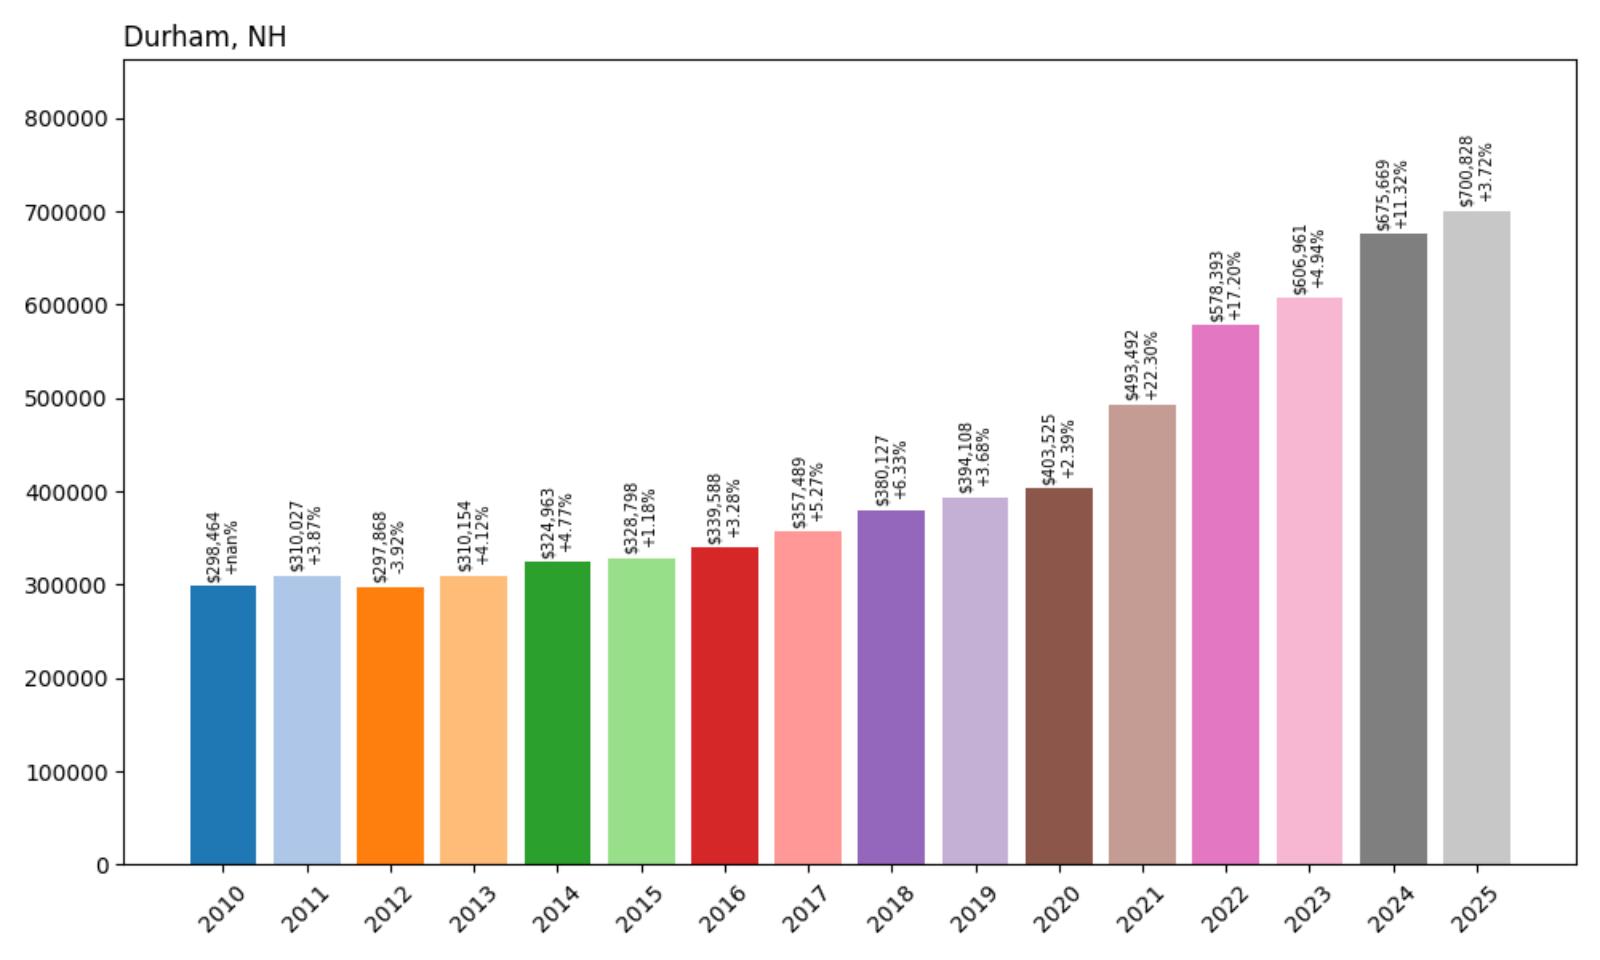
- 2010: $298,464
- 2011: $310,027 (+$11,562, +3.87% from previous year)
- 2012: $297,868 (-$12,159, -3.92% from previous year)
- 2013: $310,154 (+$12,286, +4.12% from previous year)
- 2014: $324,963 (+$14,809, +4.77% from previous year)
- 2015: $328,798 (+$3,835, +1.18% from previous year)
- 2016: $339,588 (+$10,790, +3.28% from previous year)
- 2017: $357,489 (+$17,901, +5.27% from previous year)
- 2018: $380,127 (+$22,639, +6.33% from previous year)
- 2019: $394,108 (+$13,981, +3.68% from previous year)
- 2020: $403,525 (+$9,417, +2.39% from previous year)
- 2021: $493,492 (+$89,967, +22.30% from previous year)
- 2022: $578,393 (+$84,901, +17.20% from previous year)
- 2023: $606,961 (+$28,567, +4.94% from previous year)
- 2024: $675,669 (+$68,709, +11.32% from previous year)
- 2025: $700,828 (+$25,159, +3.72% from previous year)
Durham’s housing market showed steady but modest growth through most of the 2010s before experiencing dramatic acceleration during the pandemic years. The most significant transformation occurred during 2021-2022, when home values increased by nearly 40% over two years, reflecting the university town’s appeal during a period of increased remote work flexibility. The 135% total appreciation since 2010 demonstrates the community’s strong fundamentals and continued appeal to diverse buyer demographics.
Durham – University Town With Broader Appeal
Durham, home to the University of New Hampshire and approximately 15,500 residents, has evolved beyond its traditional role as a college town to become an attractive residential destination for diverse buyer demographics. The community’s location in Strafford County provides access to both educational and employment opportunities while offering small-town character and natural amenities. Durham’s combination of cultural resources, recreational opportunities, and proximity to the Seacoast region creates appeal that extends far beyond the university community.
The town’s real estate market benefits from institutional stability provided by the University of New Hampshire while appealing to buyers seeking alternatives to more expensive Seacoast communities. Durham offers diverse housing options, from historic homes near the university to modern developments on the town’s periphery, all benefiting from excellent schools and community amenities. The area’s cultural resources, including museums, theaters, and lecture series, enhance quality of life and support sustained property values.
18. Auburn – 136% Home Price Increase Since 2010

- 2010: $299,726
- 2011: $289,998 (-$9,727, -3.25% from previous year)
- 2012: $280,060 (-$9,939, -3.43% from previous year)
- 2013: $292,323 (+$12,264, +4.38% from previous year)
- 2014: $308,257 (+$15,933, +5.45% from previous year)
- 2015: $317,699 (+$9,442, +3.06% from previous year)
- 2016: $336,066 (+$18,367, +5.78% from previous year)
- 2017: $357,395 (+$21,329, +6.35% from previous year)
- 2018: $380,544 (+$23,149, +6.48% from previous year)
- 2019: $411,739 (+$31,196, +8.20% from previous year)
- 2020: $429,022 (+$17,283, +4.20% from previous year)
- 2021: $518,272 (+$89,249, +20.80% from previous year)
- 2022: $593,613 (+$75,342, +14.54% from previous year)
- 2023: $612,754 (+$19,141, +3.22% from previous year)
- 2024: $661,522 (+$48,768, +7.96% from previous year)
- 2025: $708,296 (+$46,774, +7.07% from previous year)
Auburn experienced initial market weakness through 2012 before beginning a remarkable recovery that accelerated consistently through the decade. The community showed particularly strong performance from 2016 onward, with exceptional growth during 2021-2022 when values increased by over 35% in two years. The 136% total appreciation since 2010 represents one of the strongest performance records among southern New Hampshire communities, with the current median price exceeding $700,000.
Auburn – Rapid Growth Reflects Regional Appeal
Auburn, located in Rockingham County with approximately 5,400 residents, has emerged as one of southern New Hampshire’s fastest-growing residential markets due to its strategic location and suburban appeal. The community provides easy access to major employment centers in Manchester, Derry, and the greater Boston metropolitan area while maintaining rural character and family-friendly amenities. Auburn’s transformation from a rural farming community to a desirable suburban destination reflects broader demographic shifts throughout southern New Hampshire.
The town’s real estate market benefits from its location along major transportation corridors that provide excellent regional connectivity while offering larger lot sizes and more affordable alternatives to coastal communities. Auburn has attracted significant new residential development while maintaining its rural character through careful planning and zoning policies. The community’s excellent school system, recreational facilities, and natural amenities create appeal for families seeking suburban alternatives with rural benefits.
17. New London – 107% Home Price Increase Since 2010
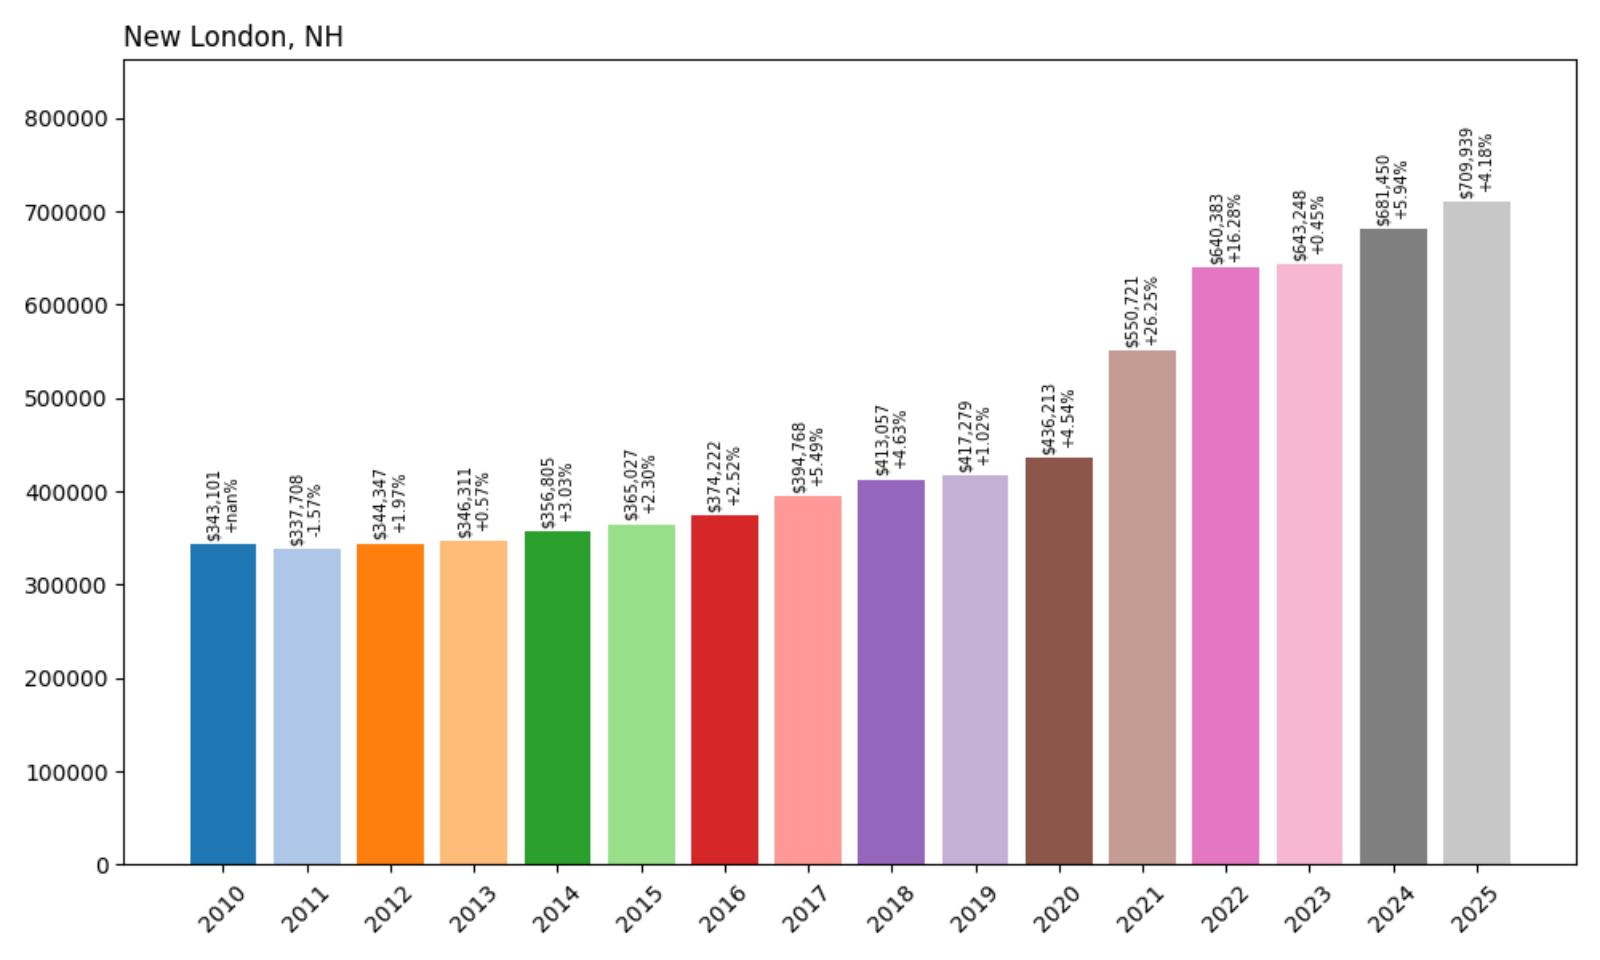
- 2010: $343,101
- 2011: $337,708 (-$5,394, -1.57% from previous year)
- 2012: $344,347 (+$6,640, +1.97% from previous year)
- 2013: $346,311 (+$1,963, +0.57% from previous year)
- 2014: $356,805 (+$10,495, +3.03% from previous year)
- 2015: $365,027 (+$8,221, +2.30% from previous year)
- 2016: $374,222 (+$9,195, +2.52% from previous year)
- 2017: $394,768 (+$20,547, +5.49% from previous year)
- 2018: $413,057 (+$18,289, +4.63% from previous year)
- 2019: $417,279 (+$4,222, +1.02% from previous year)
- 2020: $436,213 (+$18,934, +4.54% from previous year)
- 2021: $550,721 (+$114,508, +26.25% from previous year)
- 2022: $640,383 (+$89,662, +16.28% from previous year)
- 2023: $643,248 (+$2,865, +0.45% from previous year)
- 2024: $681,450 (+$38,202, +5.94% from previous year)
- 2025: $709,939 (+$28,489, +4.18% from previous year)
New London demonstrated remarkable market stability through most of the 2010s, with consistent but modest growth averaging around 3% annually. The dramatic transformation during 2021 stands out, with home values increasing by over 26% in a single year, followed by continued strong growth that pushed the median price above $700,000. The 107% total appreciation since 2010 reflects the community’s evolution into a premium residential destination in central New Hampshire.
New London – Education and Recreation Excellence
New London, located in Merrimack County with approximately 4,400 residents, combines educational excellence with recreational opportunities that create exceptional appeal for affluent families and retirees. The community is home to Colby-Sawyer College, which provides cultural and educational resources that enhance quality of life while contributing to local economic stability. New London’s location near Lake Sunapee and Mount Sunapee provides year-round recreational opportunities that drive significant real estate demand.
The town’s real estate market benefits from its unique combination of educational institutions, recreational amenities, and small-town character that appeals to diverse buyer demographics. New London offers historic charm in its village center along with modern residential developments that provide diverse housing options while maintaining community character. The area’s cultural resources, including theaters, galleries, and educational programs, create amenities typically associated with larger communities while preserving small-town appeal.
16. Moultonborough – 135% Home Price Increase Since 2010
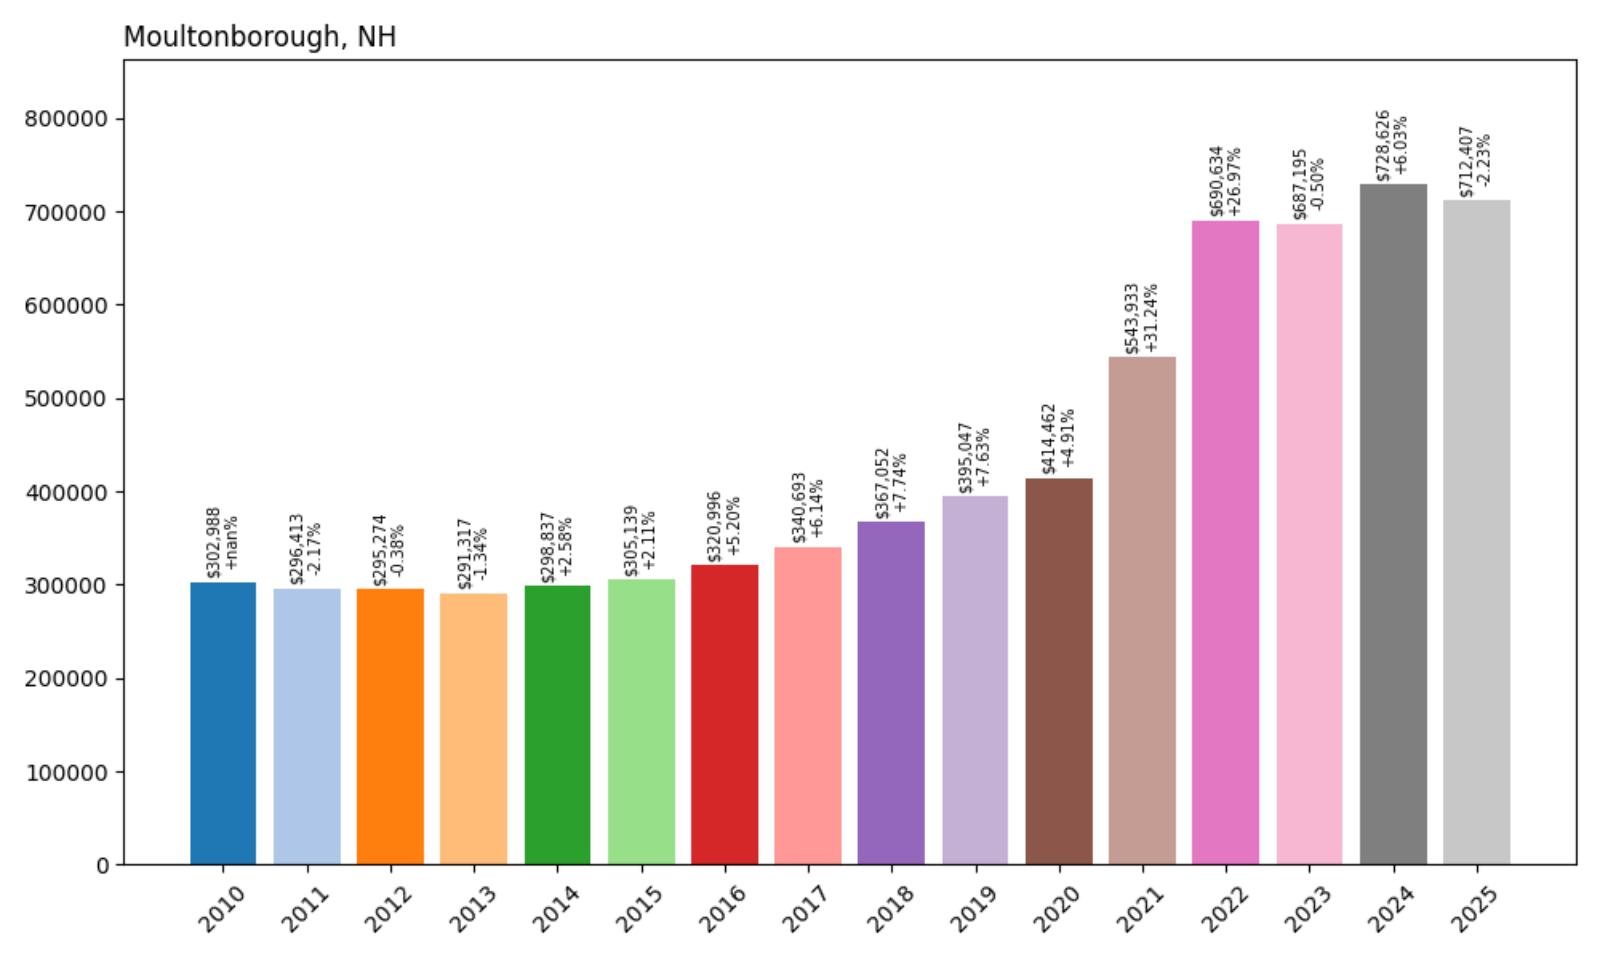
- 2010: $302,988
- 2011: $296,413 (-$6,575, -2.17% from previous year)
- 2012: $295,274 (-$1,139, -0.38% from previous year)
- 2013: $291,317 (-$3,958, -1.34% from previous year)
- 2014: $298,837 (+$7,521, +2.58% from previous year)
- 2015: $305,139 (+$6,302, +2.11% from previous year)
- 2016: $320,996 (+$15,856, +5.20% from previous year)
- 2017: $340,693 (+$19,697, +6.14% from previous year)
- 2018: $367,052 (+$26,360, +7.74% from previous year)
- 2019: $395,047 (+$27,995, +7.63% from previous year)
- 2020: $414,462 (+$19,414, +4.91% from previous year)
- 2021: $543,933 (+$129,472, +31.24% from previous year)
- 2022: $690,634 (+$146,700, +26.97% from previous year)
- 2023: $687,195 (-$3,438, -0.50% from previous year)
- 2024: $728,626 (+$41,430, +6.03% from previous year)
- 2025: $712,407 (-$16,219, -2.23% from previous year)
Moultonborough experienced a prolonged period of market weakness through 2013 before beginning steady recovery that accelerated dramatically during the pandemic years. The most extraordinary growth occurred during 2021-2022, when home values increased by an astounding 58% over two years, reflecting intense demand for lakefront properties. Despite recent declines, the 135% total appreciation since 2010 demonstrates the community’s transformation into a premium Lakes Region destination.
Moultonborough – Lake Winnipesaukee’s Hidden Treasure
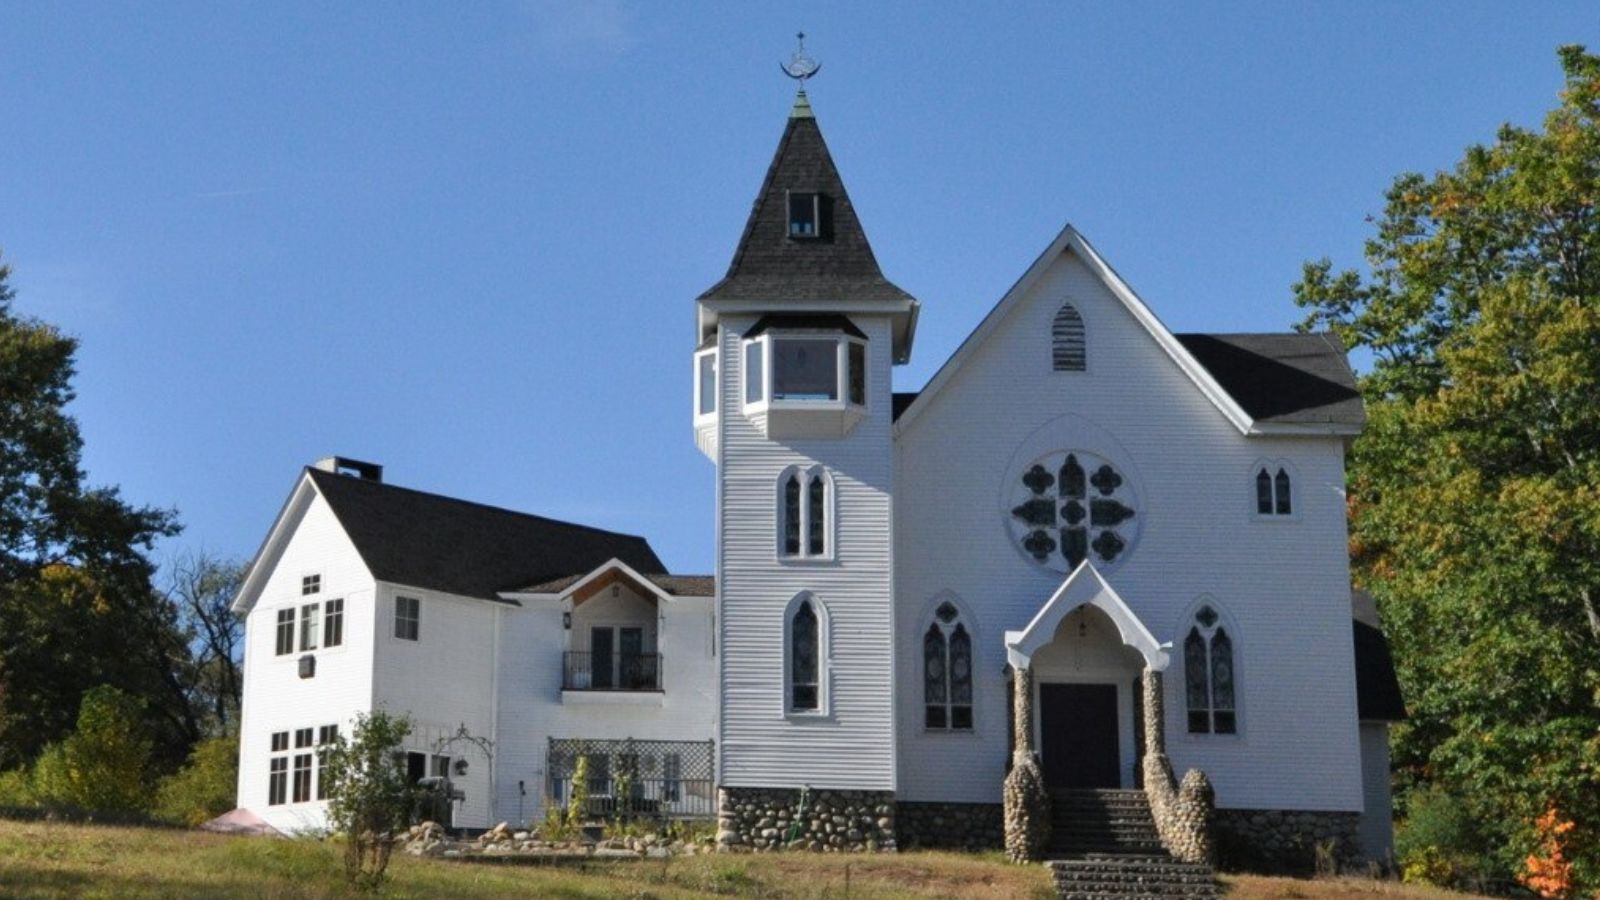
Moultonborough stretches along the northwestern shore of Lake Winnipesaukee in Carroll County, offering some of New Hampshire’s most diverse and desirable lakefront properties. This community of approximately 4,000 residents provides access to multiple lake systems, including Winnipesaukee, Squam Lake, and numerous smaller ponds that create exceptional recreational opportunities. The town’s natural amenities and scenic beauty have made it increasingly attractive to affluent buyers seeking both primary and vacation homes.
The town’s real estate market capitalizes on its extensive shoreline and natural amenities, with waterfront properties commanding premium prices that significantly influence the overall median home value. Moultonborough offers diverse property types, from modest lake cottages to luxury waterfront estates, creating opportunities for various buyer demographics while maintaining the rural character that defines the Lakes Region. The area’s recreational opportunities include boating, fishing, hiking, and winter sports that provide year-round appeal.
15. Stratham – 137% Home Price Increase Since 2010
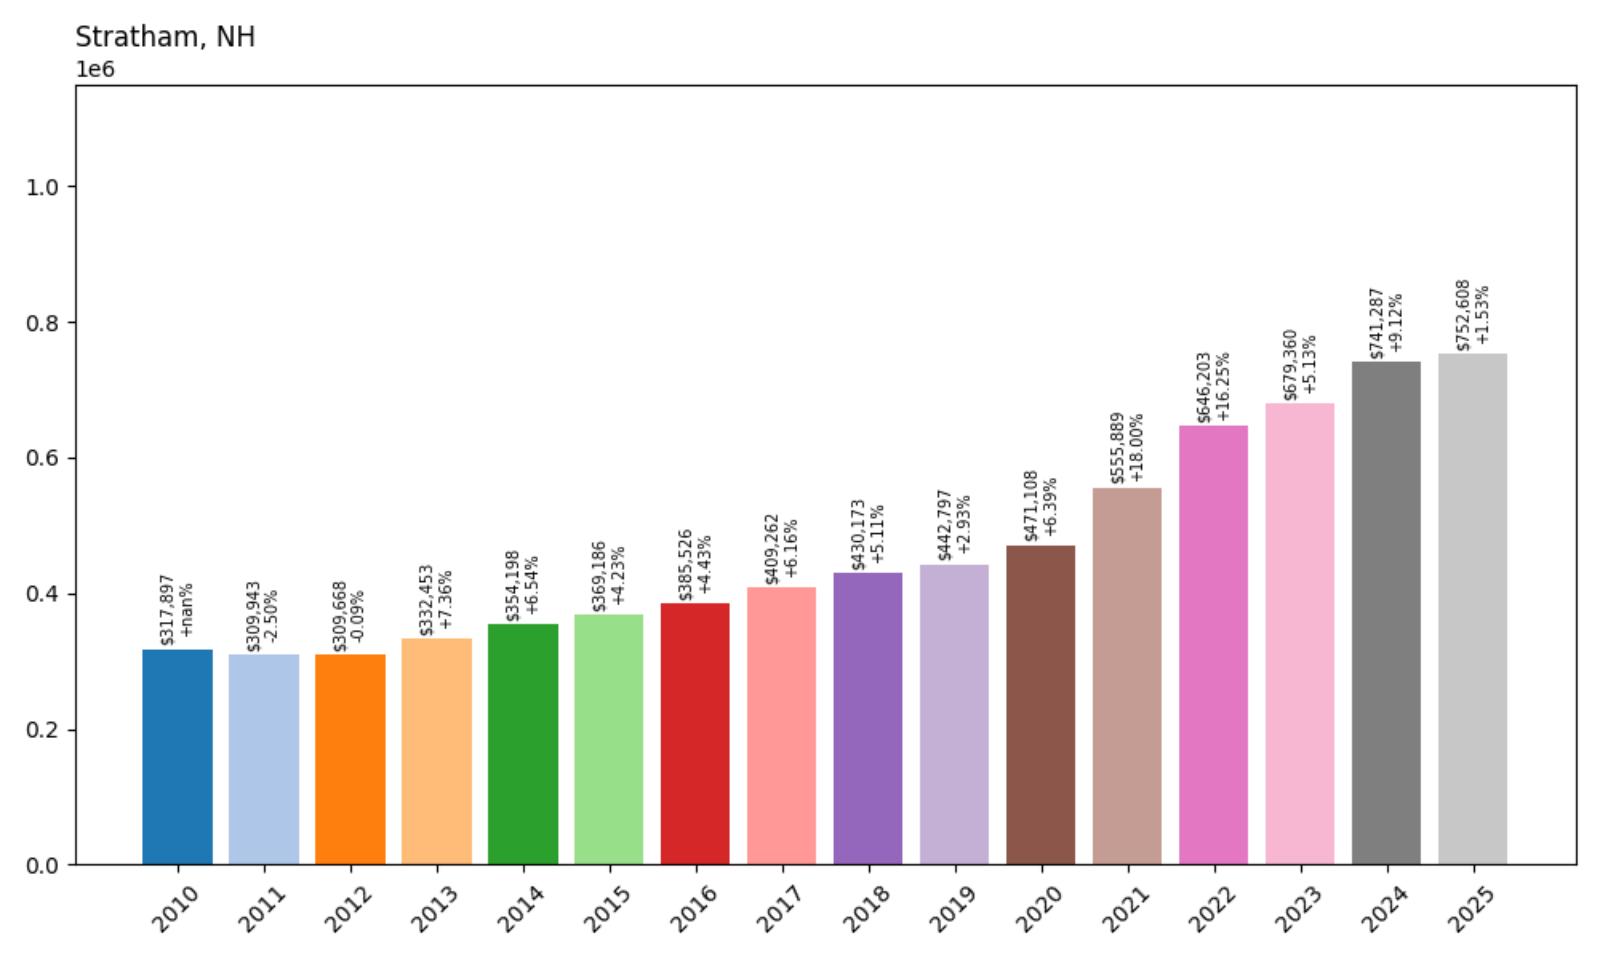
- 2010: $317,897
- 2011: $309,943 (-$7,954, -2.50% from previous year)
- 2012: $309,668 (-$275, -0.09% from previous year)
- 2013: $332,453 (+$22,784, +7.36% from previous year)
- 2014: $354,198 (+$21,745, +6.54% from previous year)
- 2015: $369,186 (+$14,989, +4.23% from previous year)
- 2016: $385,526 (+$16,340, +4.43% from previous year)
- 2017: $409,262 (+$23,736, +6.16% from previous year)
- 2018: $430,173 (+$20,911, +5.11% from previous year)
- 2019: $442,797 (+$12,624, +2.93% from previous year)
- 2020: $471,108 (+$28,311, +6.39% from previous year)
- 2021: $555,889 (+$84,781, +18.00% from previous year)
- 2022: $646,203 (+$90,314, +16.25% from previous year)
- 2023: $679,360 (+$33,157, +5.13% from previous year)
- 2024: $741,287 (+$61,927, +9.12% from previous year)
- 2025: $752,608 (+$11,320, +1.53% from previous year)
Stratham’s housing market showed initial weakness in the early 2010s before beginning consistent recovery in 2013 that continued throughout the decade. The community demonstrated particularly strong performance from 2017 onward, with exceptional growth during 2021-2022 when values increased by over 34% in two years. The 137% total appreciation since 2010 reflects Stratham’s emergence as one of the Seacoast region’s most desirable residential communities.
Stratham – Seacoast Accessibility With Rural Character
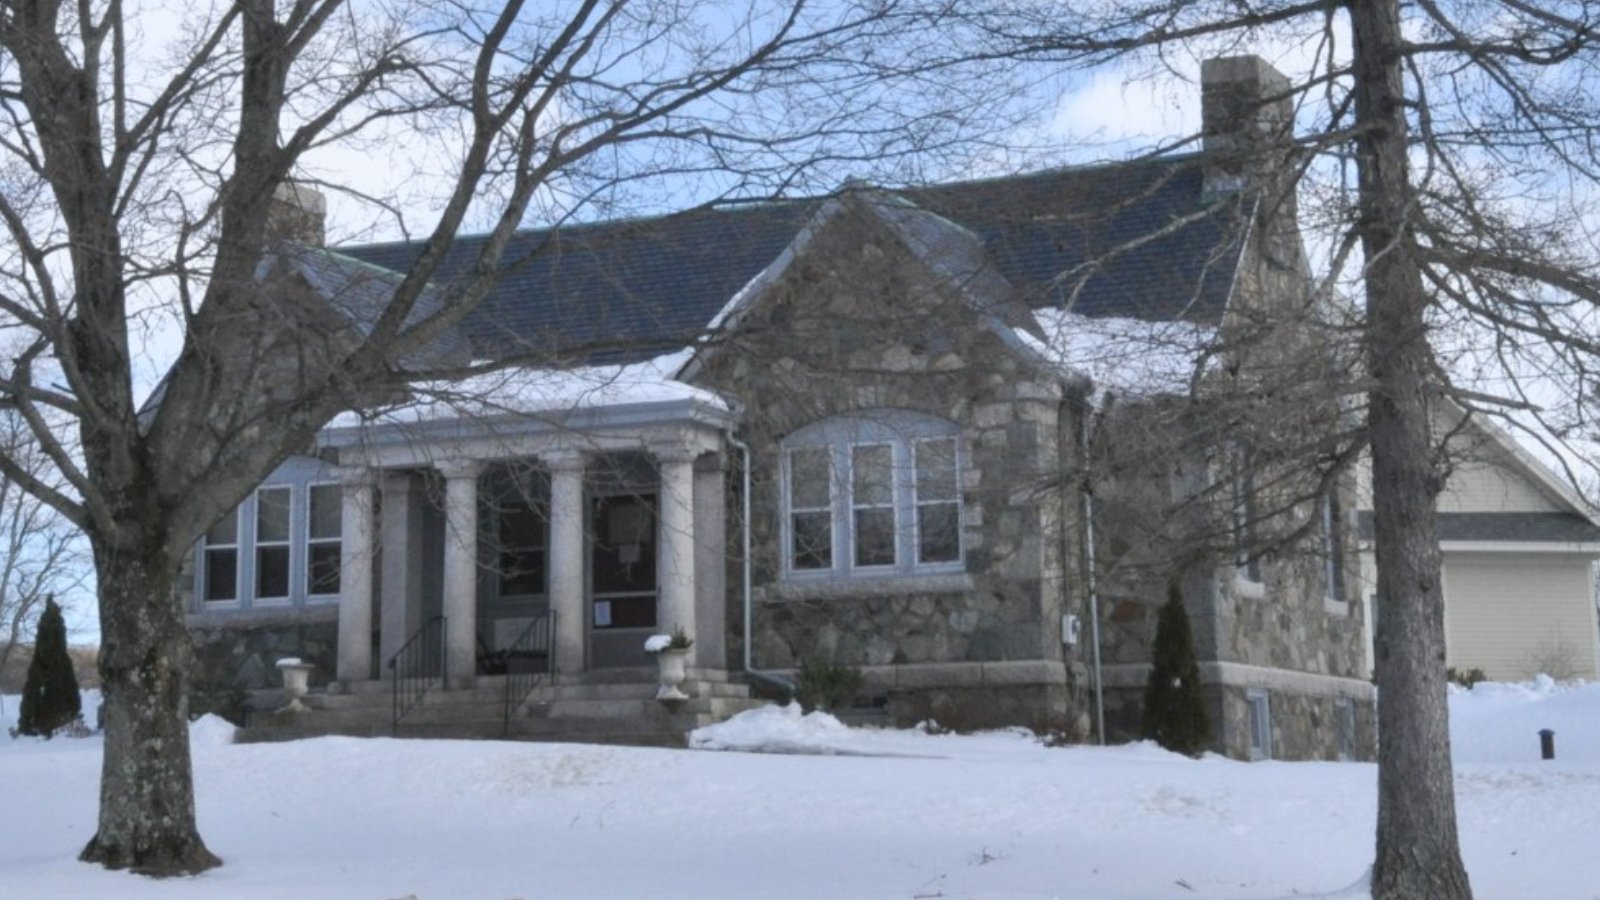
Stratham, located in Rockingham County with approximately 7,300 residents, offers an ideal combination of Seacoast accessibility and rural character that has driven exceptional real estate appreciation. The community provides convenient access to Portsmouth, the Atlantic coast, and employment centers throughout the region while maintaining agricultural lands, historic sites, and natural amenities that create authentic New England appeal. Stratham’s strategic location has made it increasingly attractive to professionals seeking alternatives to more expensive coastal communities.
The town’s real estate market benefits from its position within the greater Portsmouth metropolitan area while offering larger properties and rural amenities that coastal communities cannot match. Stratham has attracted significant residential development while preserving its agricultural heritage through careful planning and conservation efforts. The community’s excellent school system, recreational facilities, and historic character create sustained appeal for families seeking suburban alternatives with rural benefits.
14. Bedford – 112% Home Price Increase Since 2010
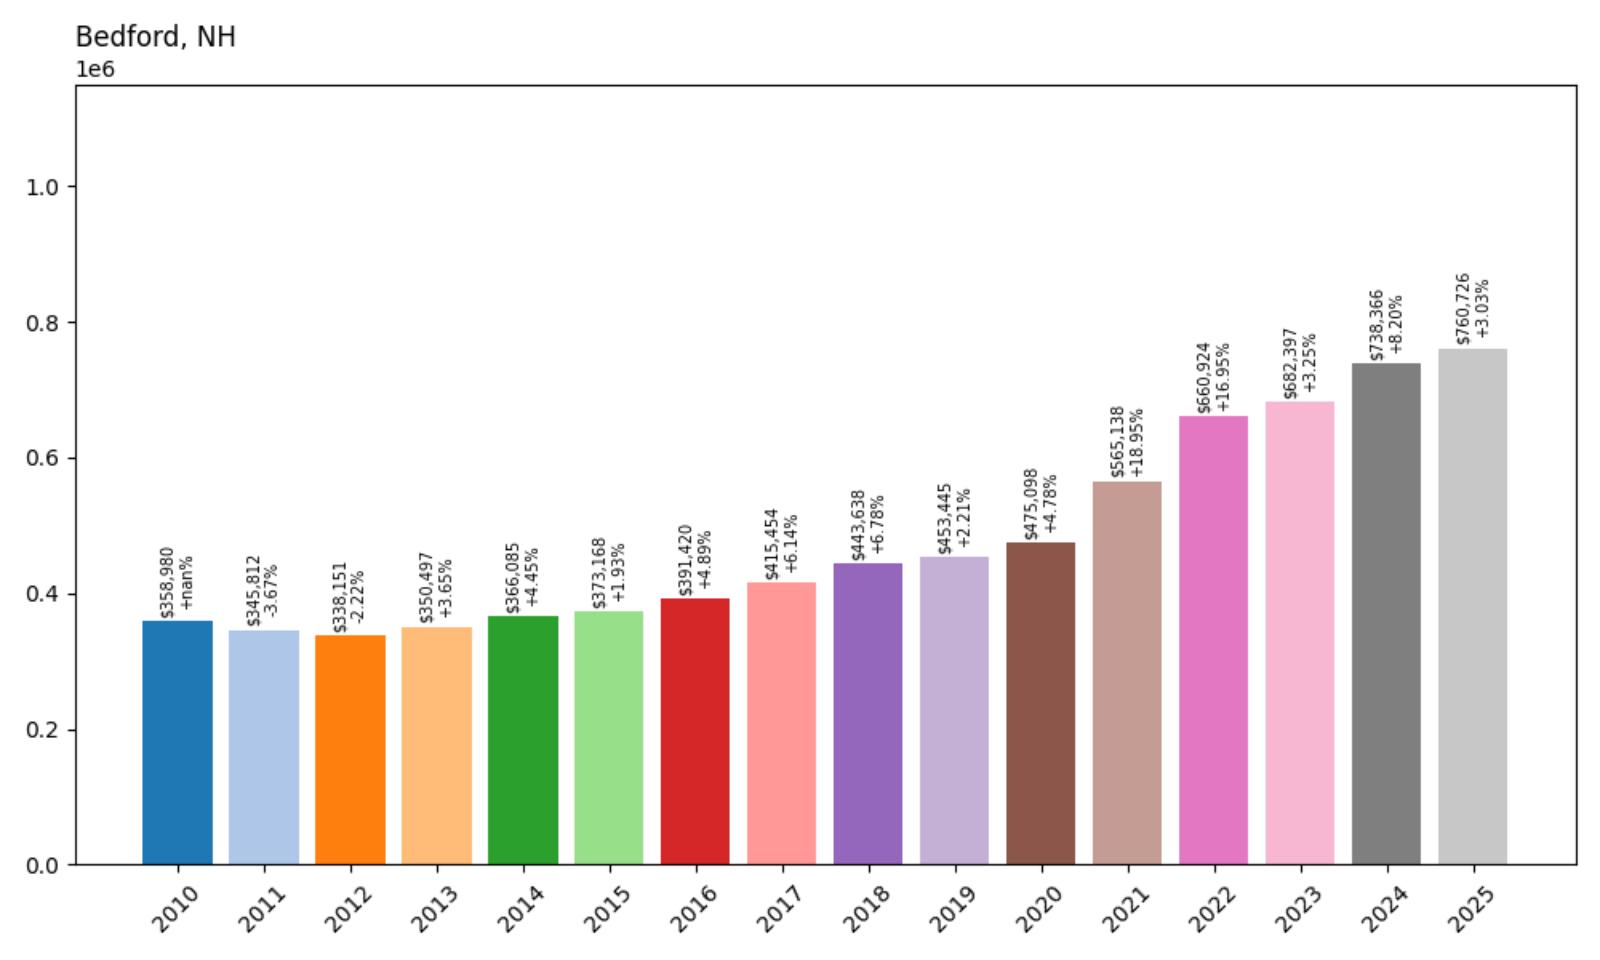
- 2010: $358,980
- 2011: $345,812 (-$13,168, -3.67% from previous year)
- 2012: $338,151 (-$7,661, -2.22% from previous year)
- 2013: $350,497 (+$12,346, +3.65% from previous year)
- 2014: $366,085 (+$15,588, +4.45% from previous year)
- 2015: $373,168 (+$7,083, +1.93% from previous year)
- 2016: $391,420 (+$18,252, +4.89% from previous year)
- 2017: $415,454 (+$24,033, +6.14% from previous year)
- 2018: $443,638 (+$28,184, +6.78% from previous year)
- 2019: $453,445 (+$9,807, +2.21% from previous year)
- 2020: $475,098 (+$21,654, +4.78% from previous year)
- 2021: $565,138 (+$90,040, +18.95% from previous year)
- 2022: $660,924 (+$95,786, +16.95% from previous year)
- 2023: $682,397 (+$21,473, +3.25% from previous year)
- 2024: $738,366 (+$55,969, +8.20% from previous year)
- 2025: $760,726 (+$22,360, +3.03% from previous year)
Bedford experienced initial market weakness through 2012 before beginning steady recovery that gained momentum throughout the late 2010s. The community showed exceptional performance during 2021-2022, when home values increased by over 35% in two years, reflecting its appeal as one of southern New Hampshire’s premier suburban communities. The 112% total appreciation since 2010 demonstrates Bedford’s sustained appeal to affluent families and professionals seeking high-quality residential environments.
Bedford – Premium Suburban Living
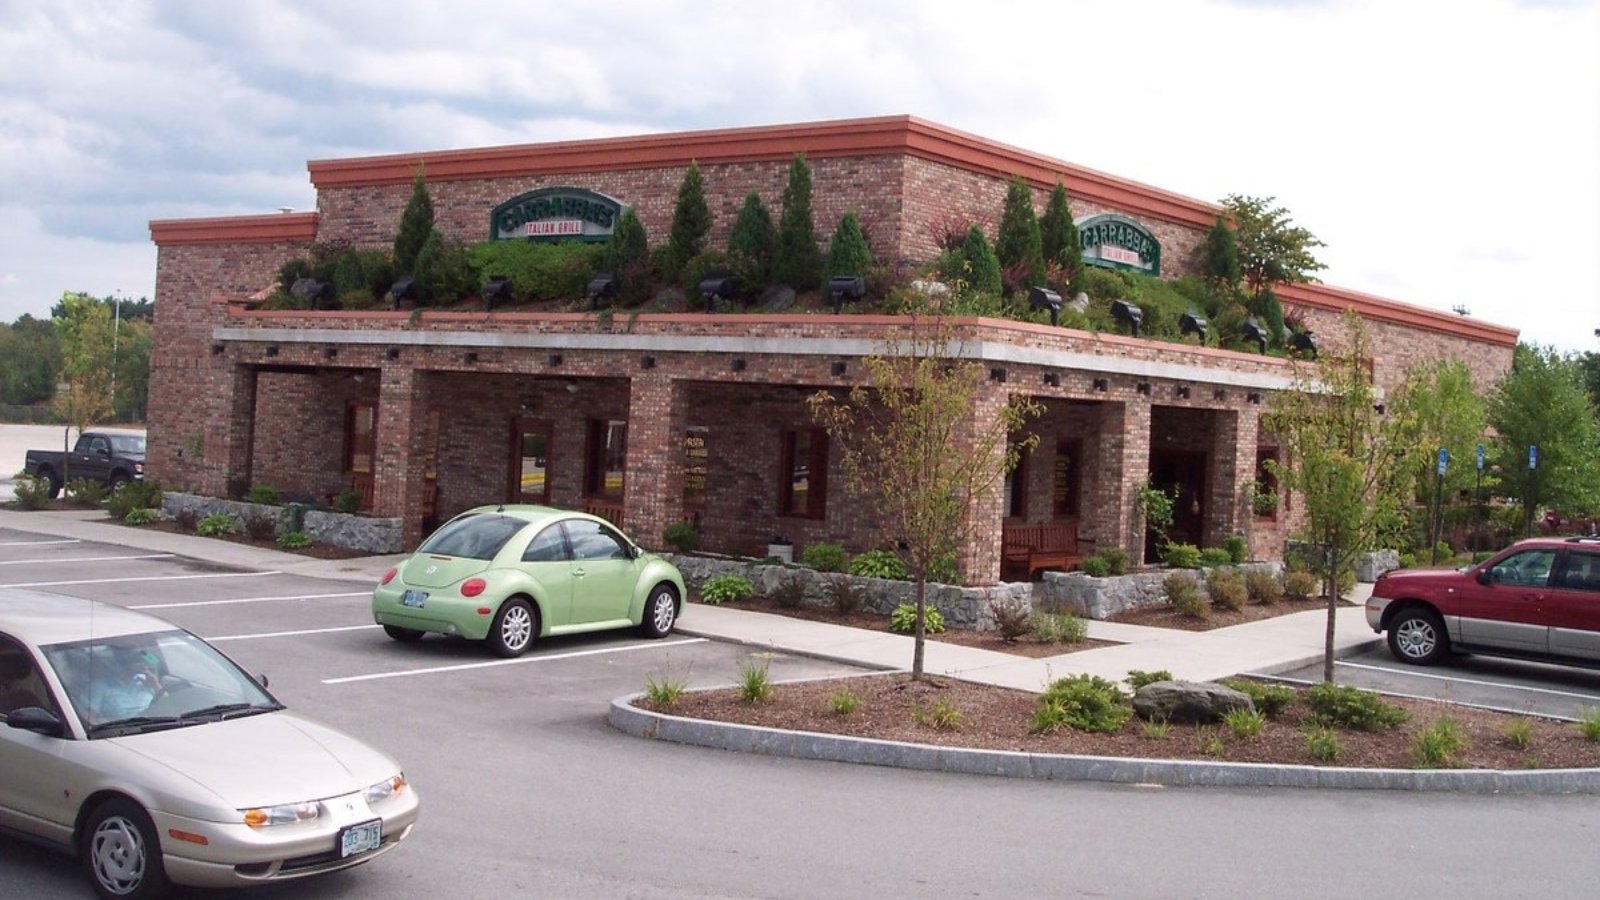
Bedford, located in Hillsborough County with approximately 22,000 residents, has established itself as one of New Hampshire’s most desirable suburban communities through exceptional schools, well-planned development, and comprehensive municipal services. The community’s proximity to Manchester provides convenient access to employment and urban amenities while maintaining the suburban character and family-friendly atmosphere that defines premium residential areas. Bedford’s commitment to quality development and public services has created sustained demand that supports premium property values.
The town’s real estate market reflects its reputation as a destination for affluent families seeking excellent schools and suburban amenities while maintaining reasonable access to employment centers. Bedford offers diverse housing options, from executive homes in established neighborhoods to luxury developments that provide modern amenities and conveniences. The community’s recreational facilities, including parks, sports complexes, and cultural programs, enhance quality of life and justify premium pricing compared to less developed areas.
13. Portsmouth – 132% Home Price Increase Since 2010
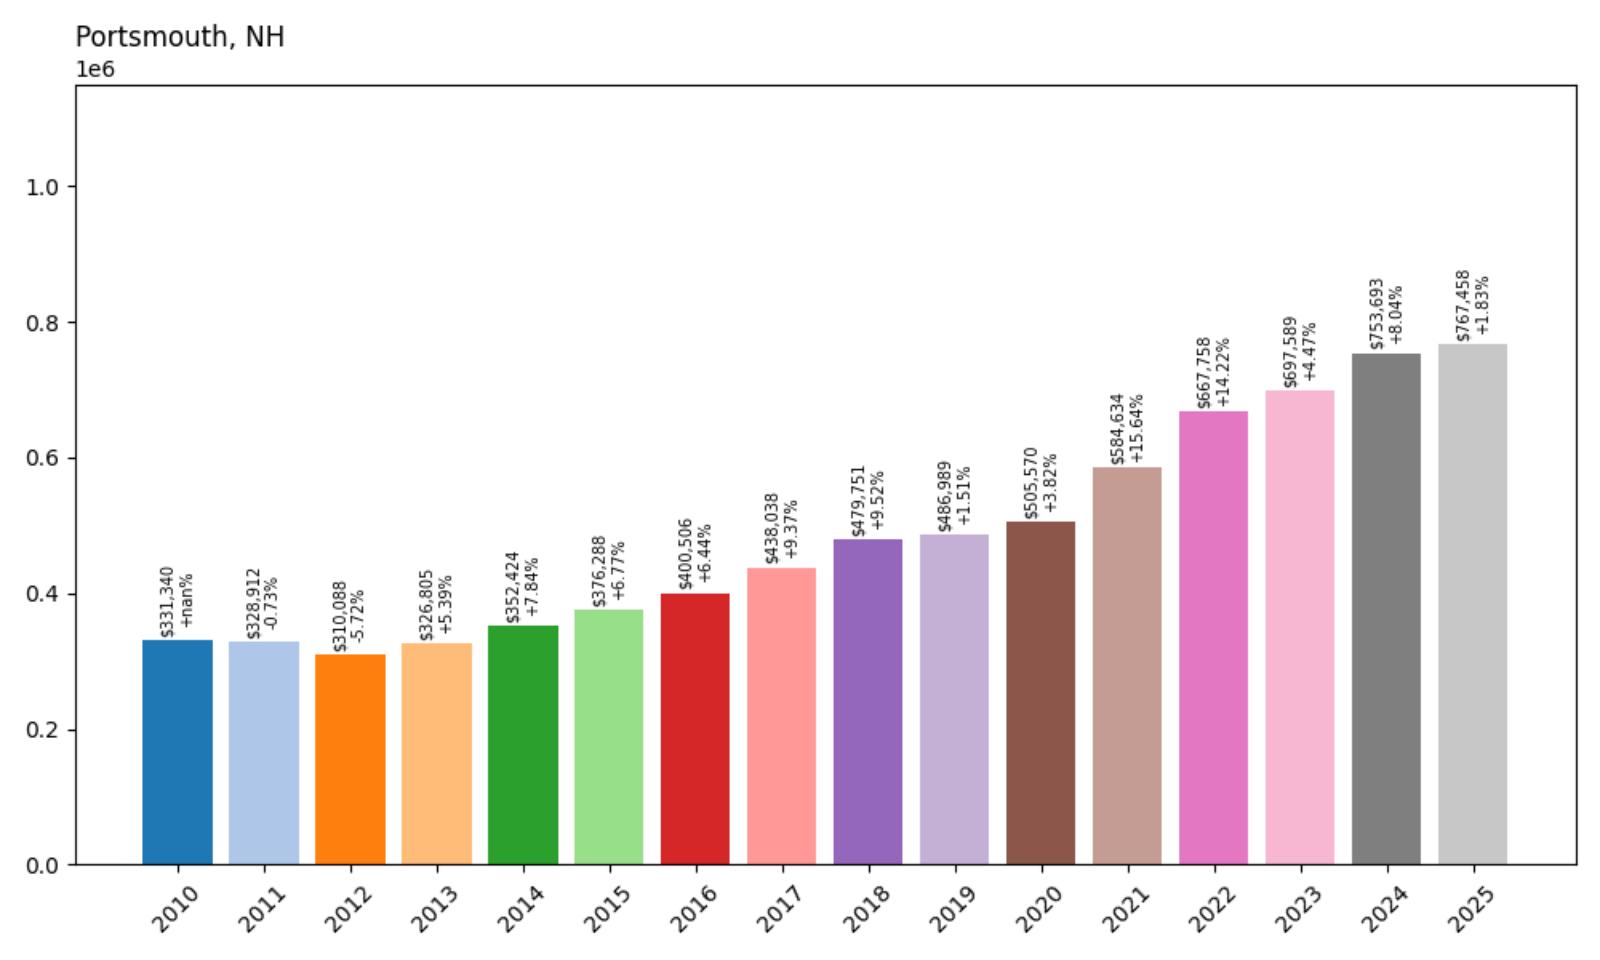
- 2010: $331,340
- 2011: $328,912 (-$2,428, -0.73% from previous year)
- 2012: $310,088 (-$18,823, -5.72% from previous year)
- 2013: $326,805 (+$16,717, +5.39% from previous year)
- 2014: $352,424 (+$25,619, +7.84% from previous year)
- 2015: $376,288 (+$23,864, +6.77% from previous year)
- 2016: $400,506 (+$24,217, +6.44% from previous year)
- 2017: $438,038 (+$37,532, +9.37% from previous year)
- 2018: $479,751 (+$41,713, +9.52% from previous year)
- 2019: $486,989 (+$7,238, +1.51% from previous year)
- 2020: $505,570 (+$18,581, +3.82% from previous year)
- 2021: $584,634 (+$79,064, +15.64% from previous year)
- 2022: $667,758 (+$83,124, +14.22% from previous year)
- 2023: $697,589 (+$29,831, +4.47% from previous year)
- 2024: $753,693 (+$56,104, +8.04% from previous year)
- 2025: $767,458 (+$13,765, +1.83% from previous year)
Portsmouth recovered from early 2010s weakness to demonstrate exceptional consistency through the mid-2010s, with particularly strong performance from 2014 through 2018 averaging over 7% annual growth. The pandemic period brought accelerated appreciation, with values increasing by nearly 30% during 2021-2022. The 132% total appreciation since 2010 reflects Portsmouth’s status as New Hampshire’s premier coastal city and cultural center.
Portsmouth – Historic Seaport Meets Modern Prosperity
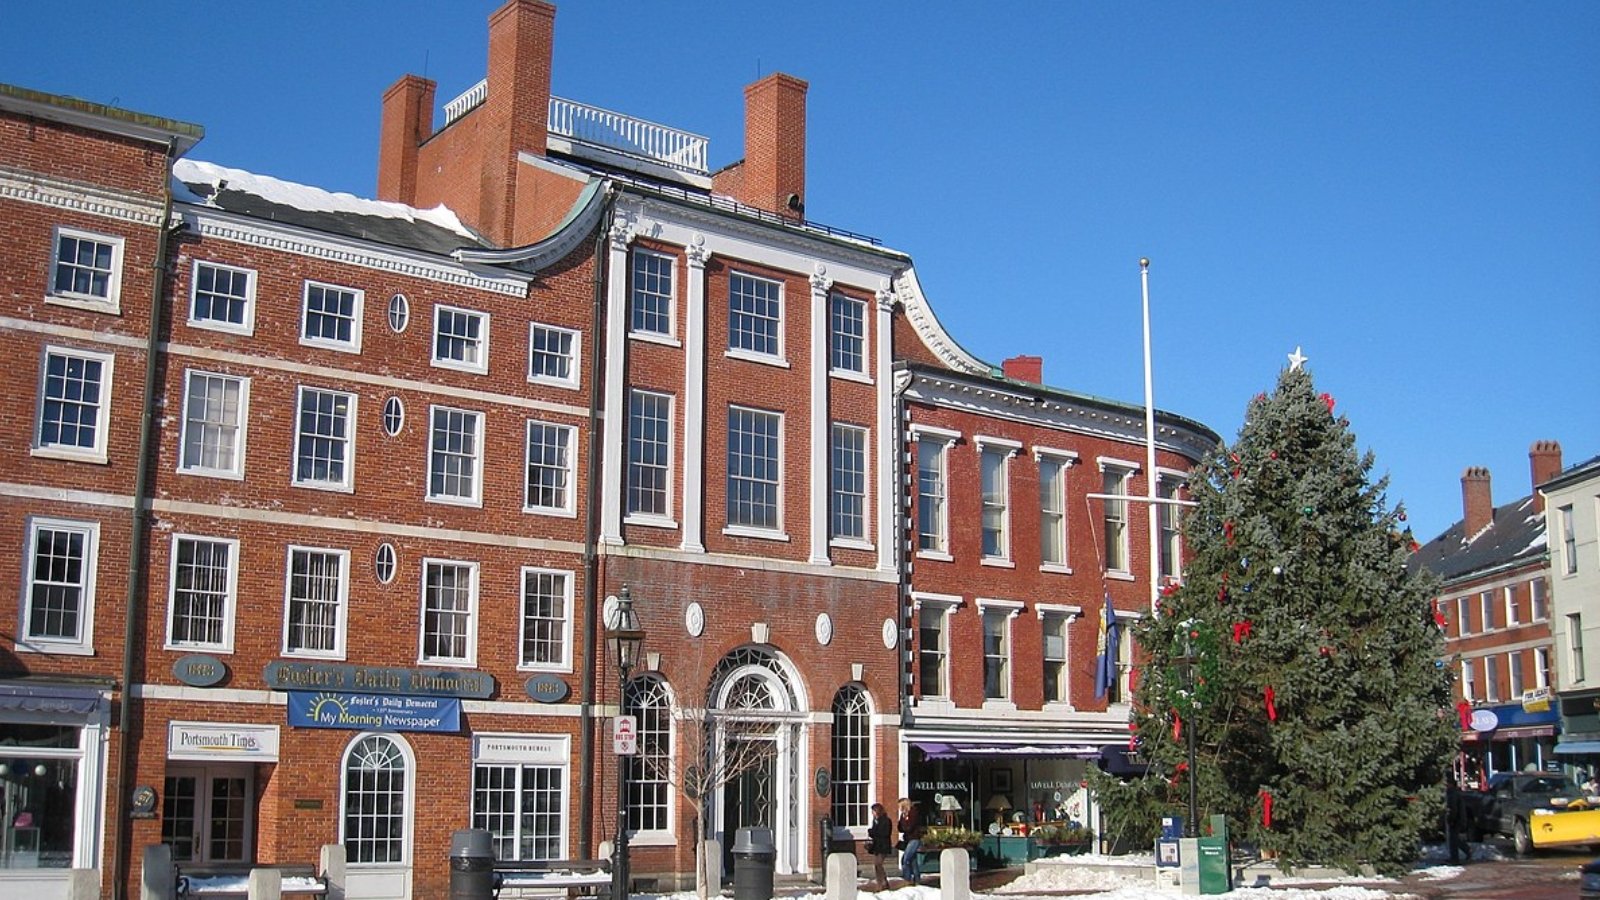
Portsmouth, New Hampshire’s only seaport city with approximately 22,000 residents, combines historic charm with modern prosperity to create one of New England’s most desirable urban real estate markets. Located in Rockingham County where the Piscataqua River meets the Atlantic Ocean, the city offers waterfront properties, historic architecture, and urban amenities that appeal to diverse buyer demographics. Portsmouth’s transformation from an industrial port to a cultural and economic center has driven exceptional real estate appreciation over the past decade.
The city’s real estate market capitalizes on its unique combination of historic character, waterfront location, and urban amenities that create appeal for both year-round residents and seasonal property owners. Portsmouth offers diverse housing options, from converted historic buildings in the downtown area to modern waterfront condominiums and traditional neighborhoods with colonial-era homes. The city’s vibrant downtown area features restaurants, shops, theaters, and cultural attractions that enhance property values throughout the community.
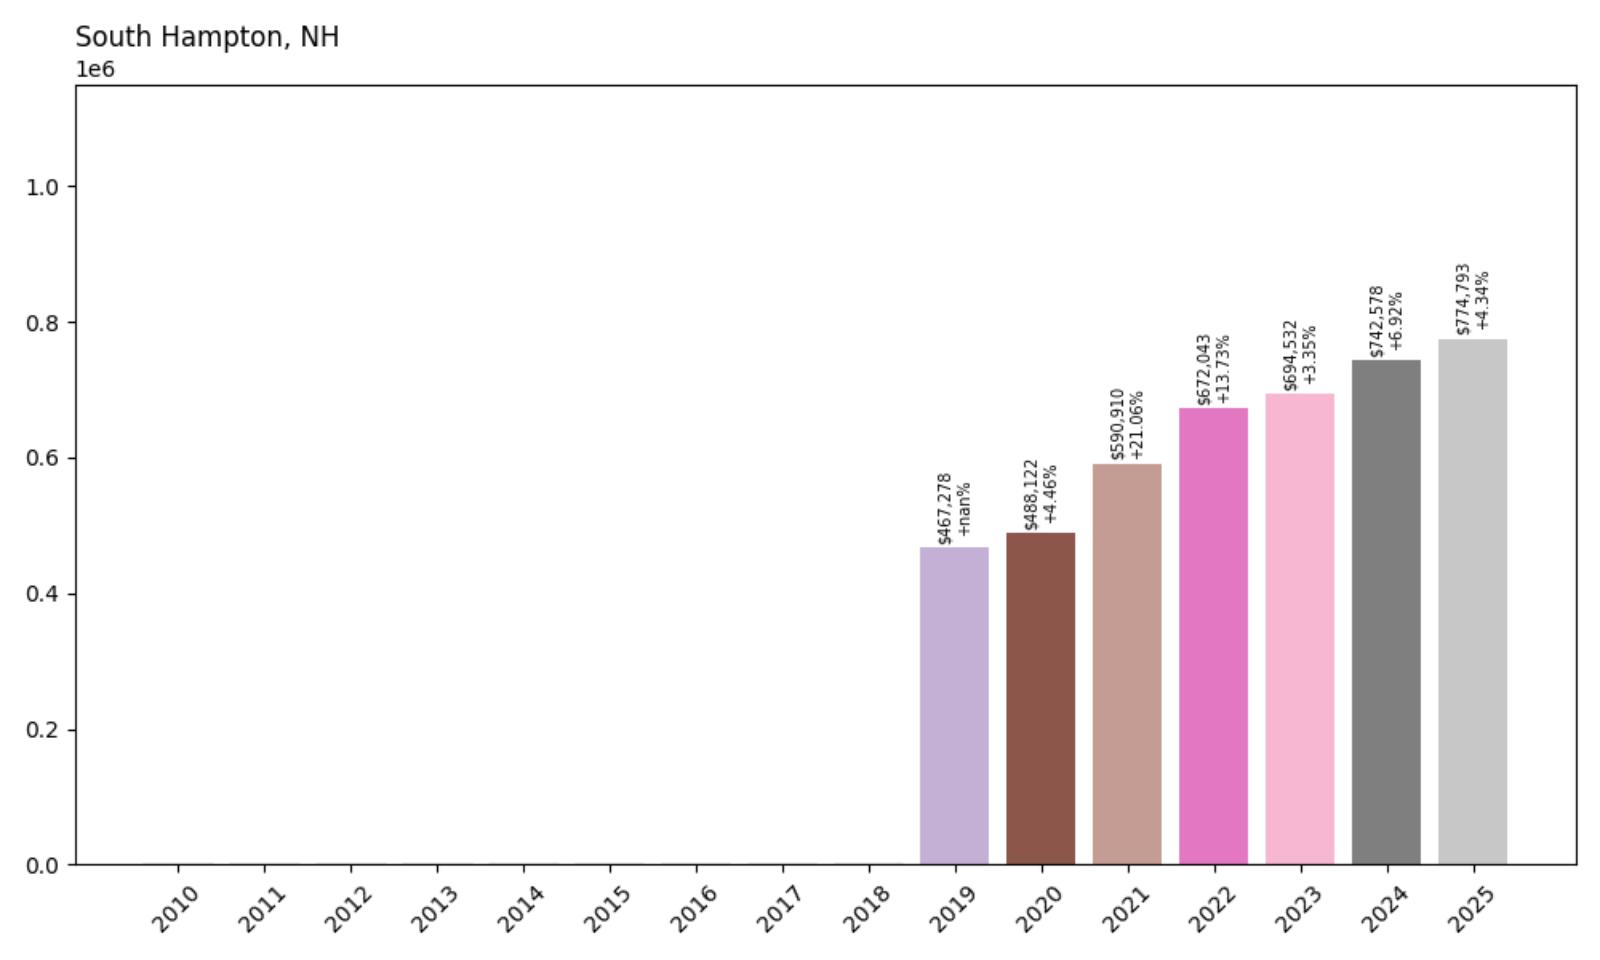
12. South Hampton – 66% Home Price Increase Since 2019
- 2010: N/A
- 2011: N/A
- 2012: N/A
- 2013: N/A
- 2014: N/A
- 2015: N/A
- 2016: N/A
- 2017: N/A
- 2018: N/A
- 2019: $467,278
- 2020: $488,122 (+$20,844, +4.46% from previous year)
- 2021: $590,910 (+$102,787, +21.06% from previous year)
- 2022: $672,043 (+$81,133, +13.73% from previous year)
- 2023: $694,532 (+$22,490, +3.35% from previous year)
- 2024: $742,578 (+$48,046, +6.92% from previous year)
- 2025: $774,793 (+$32,215, +4.34% from previous year)
South Hampton’s housing data begins in 2019, showing dramatic acceleration during the pandemic period with particularly strong growth in 2021 when values increased by over 21%. The community has maintained steady appreciation since then, with the current median price approaching $775,000. The 66% appreciation since 2019 represents remarkable growth over just six years, positioning South Hampton among New Hampshire’s most rapidly appreciating markets.
South Hampton – Exclusive Residential Enclave
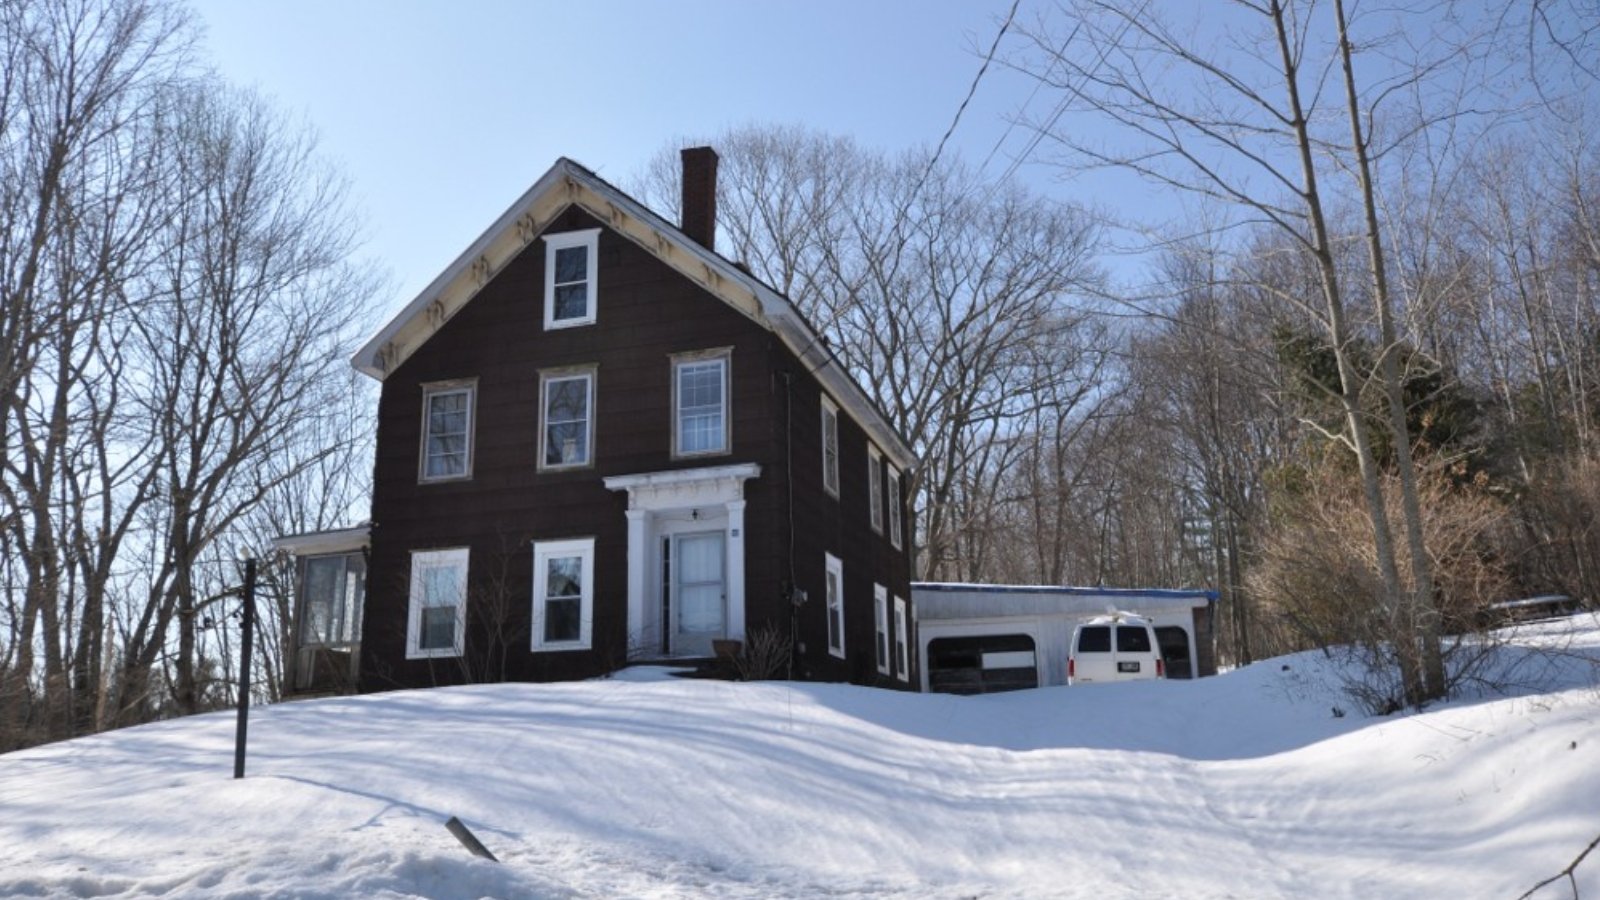
South Hampton, located in Rockingham County with approximately 900 residents, represents one of New Hampshire’s most exclusive small communities where rural character meets proximity to major metropolitan areas. The town’s location near the Massachusetts border provides convenient access to Boston-area employment while maintaining the privacy and natural amenities that appeal to affluent buyers seeking residential alternatives to suburban development patterns. South Hampton’s small size and rural character create an intimate community atmosphere that commands premium pricing.
The town’s real estate market benefits from its combination of rural exclusivity and regional accessibility that appeals to high-income professionals and executives seeking lifestyle alternatives to urban and suburban living. South Hampton offers large estates, historic properties, and modern luxury homes on substantial parcels that provide privacy and natural amenities while maintaining reasonable commuting distances to major employment centers. The community’s commitment to preserving rural character through zoning and conservation efforts helps maintain the environmental qualities that drive premium real estate demand.
11. Windham – 131% Home Price Increase Since 2010
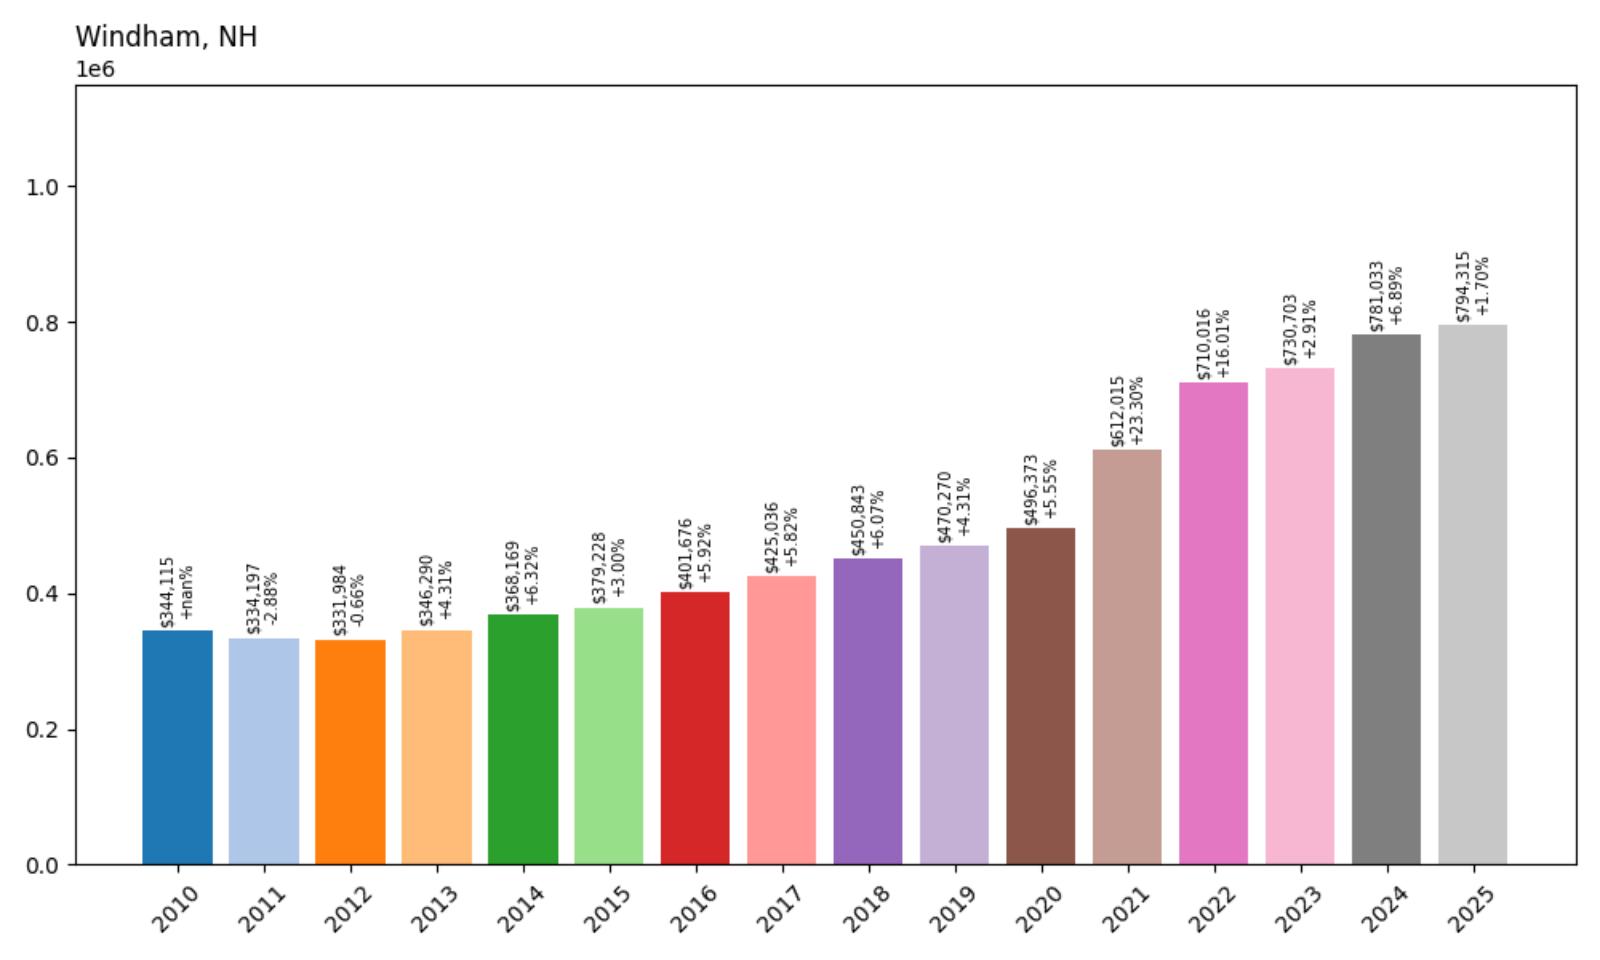
- 2010: $344,115
- 2011: $334,197 (-$9,918, -2.88% from previous year)
- 2012: $331,984 (-$2,213, -0.66% from previous year)
- 2013: $346,290 (+$14,306, +4.31% from previous year)
- 2014: $368,169 (+$21,879, +6.32% from previous year)
- 2015: $379,228 (+$11,059, +3.00% from previous year)
- 2016: $401,676 (+$22,448, +5.92% from previous year)
- 2017: $425,036 (+$23,359, +5.82% from previous year)
- 2018: $450,843 (+$25,807, +6.07% from previous year)
- 2019: $470,270 (+$19,427, +4.31% from previous year)
- 2020: $496,373 (+$26,103, +5.55% from previous year)
- 2021: $612,015 (+$115,642, +23.30% from previous year)
- 2022: $710,016 (+$98,001, +16.01% from previous year)
- 2023: $730,703 (+$20,686, +2.91% from previous year)
- 2024: $781,033 (+$50,330, +6.89% from previous year)
- 2025: $794,315 (+$13,282, +1.70% from previous year)
Windham demonstrated remarkable consistency throughout the 2010s, with steady annual appreciation averaging around 5-6% per year through most of the decade. The pandemic period brought exceptional acceleration, particularly during 2021 when values increased by over 23%, followed by continued strong growth that pushed the median price above $794,000. The 131% total appreciation since 2010 reflects Windham’s appeal as a premium suburban community with excellent regional access.
Windham – Strategic Location Drives Premium Pricing
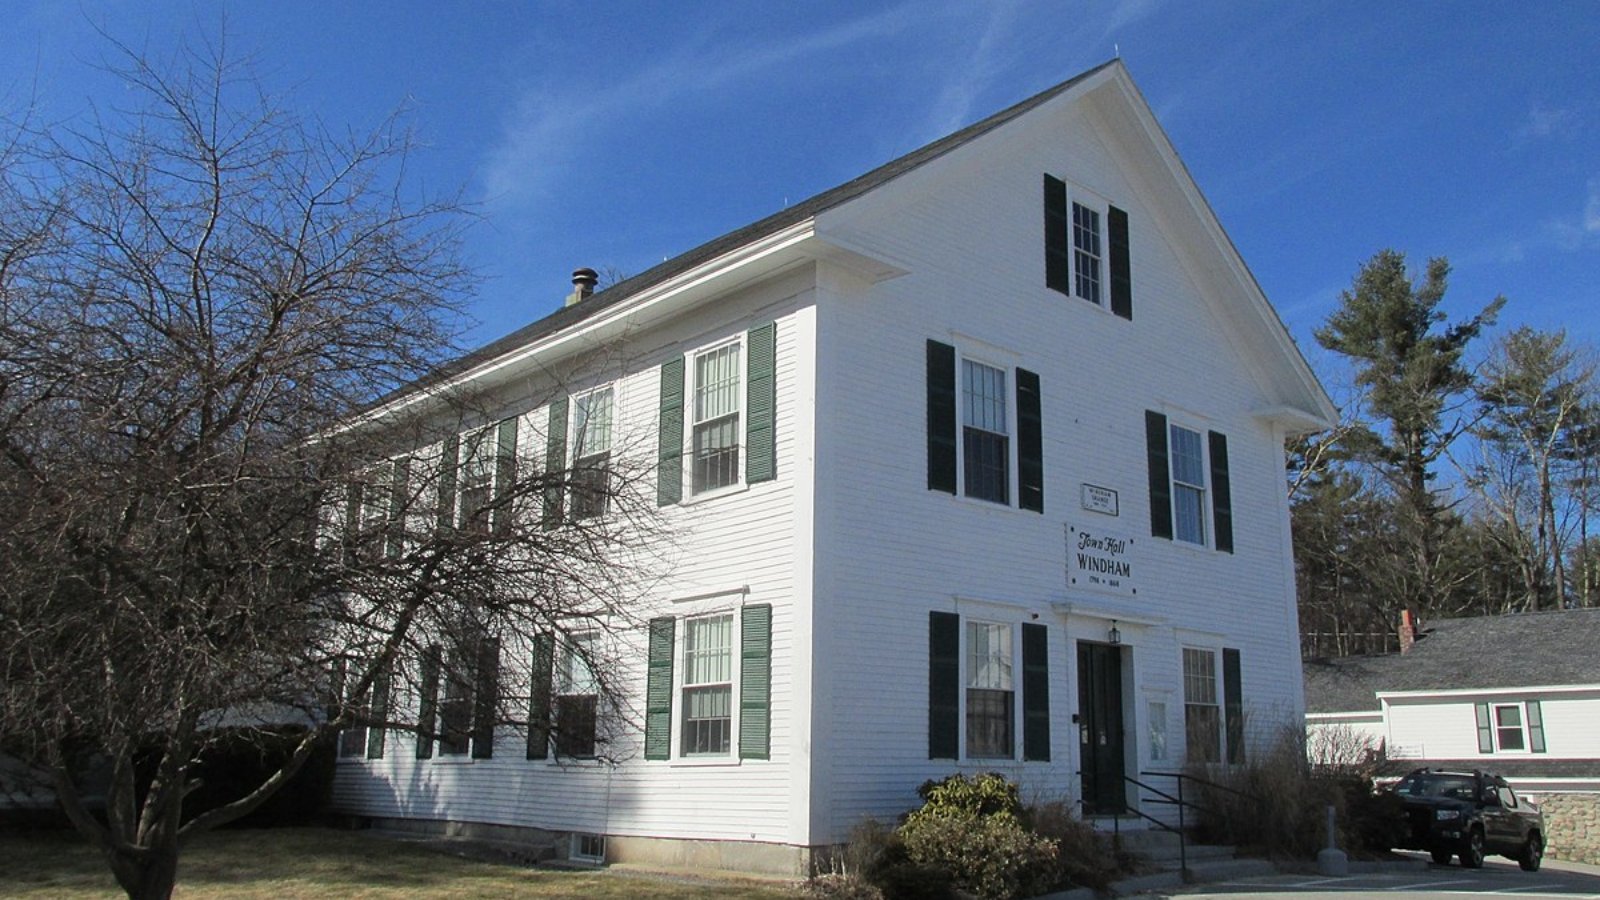
Windham, located in Rockingham County with approximately 16,000 residents, occupies a strategic position that provides excellent access to employment centers in both New Hampshire and Massachusetts while maintaining suburban character and family-friendly amenities. The community’s location along major transportation corridors, combined with excellent schools and recreational facilities, has made it one of southern New Hampshire’s most sought-after residential destinations. Windham’s proximity to Salem and the Massachusetts border creates exceptional appeal for professionals working throughout the greater Boston metropolitan area.
The town’s real estate market reflects its role as a premium suburban destination that offers larger properties and more amenities than many Massachusetts communities at competitive prices. Windham has attracted significant residential development while maintaining its suburban character through comprehensive planning and quality municipal services. The community’s recreational facilities, including parks, golf courses, and sports complexes, enhance quality of life and justify premium pricing compared to less developed areas.
10. Kensington – 116% Home Price Increase Since 2010
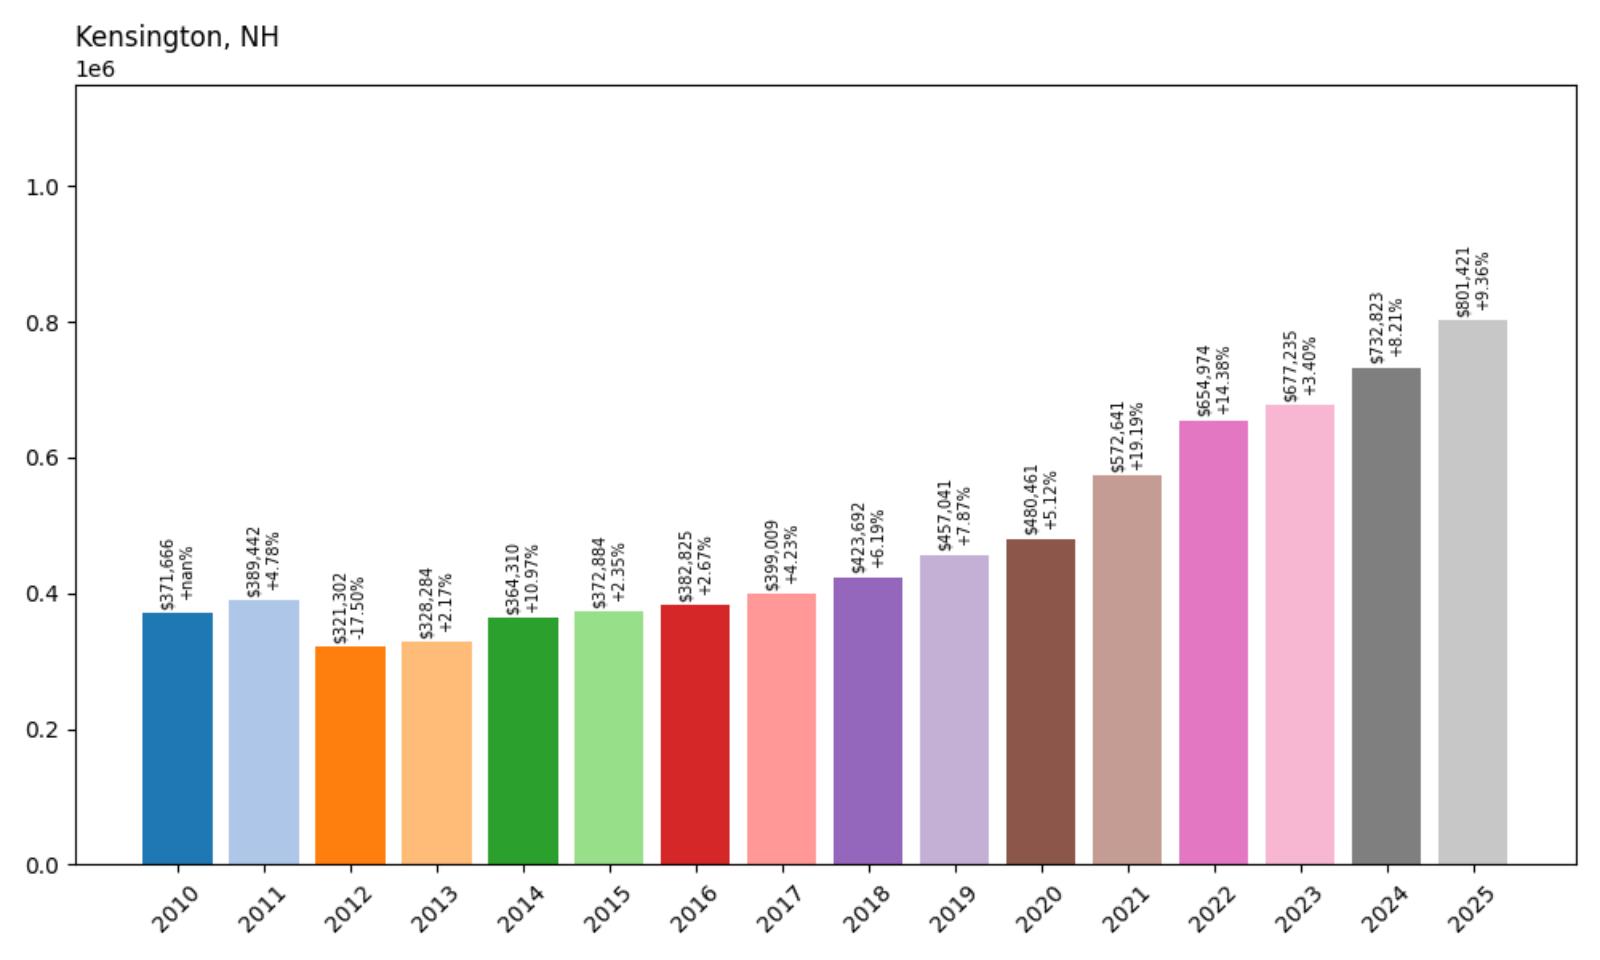
- 2010: $371,666
- 2011: $389,442 (+$17,776, +4.78% from previous year)
- 2012: $321,302 (-$68,140, -17.50% from previous year)
- 2013: $328,284 (+$6,982, +2.17% from previous year)
- 2014: $364,310 (+$36,026, +10.97% from previous year)
- 2015: $372,884 (+$8,573, +2.35% from previous year)
- 2016: $382,825 (+$9,941, +2.67% from previous year)
- 2017: $399,009 (+$16,184, +4.23% from previous year)
- 2018: $423,692 (+$24,683, +6.19% from previous year)
- 2019: $457,041 (+$33,349, +7.87% from previous year)
- 2020: $480,461 (+$23,420, +5.12% from previous year)
- 2021: $572,641 (+$92,180, +19.19% from previous year)
- 2022: $654,974 (+$82,333, +14.38% from previous year)
- 2023: $677,235 (+$22,261, +3.40% from previous year)
- 2024: $732,823 (+$55,589, +8.21% from previous year)
- 2025: $801,421 (+$68,597, +9.36% from previous year)
Kensington experienced severe market disruption in 2012, with home values declining by over 17% before beginning a gradual recovery that accelerated dramatically during the pandemic years. The most remarkable growth occurred during 2021-2022, when values increased by over 33% in two years, followed by continued strong appreciation through 2025. The 116% total appreciation since 2010 demonstrates the community’s resilience and growing appeal to affluent buyers.
Kensington – Small Town Exclusivity

Kensington, located in Rockingham County with approximately 2,100 residents, represents one of New Hampshire’s most exclusive small communities where rural character combines with proximity to regional amenities and employment centers. The town’s small size and agricultural heritage create an intimate community atmosphere that appeals to buyers seeking alternatives to suburban development patterns while maintaining access to urban conveniences. Kensington’s rural roads, historic properties, and natural amenities command premium pricing due to their scarcity and desirability.
The town’s real estate market benefits from its combination of rural exclusivity and regional accessibility that creates appeal for high-income professionals seeking lifestyle alternatives to urban and suburban living. Kensington offers diverse property types, from historic farmhouses to modern luxury homes on large parcels that provide privacy and natural amenities while maintaining reasonable access to employment and cultural opportunities. The community’s commitment to preserving agricultural land and rural character helps maintain the environmental qualities that drive premium real estate demand.
9. Hollis – 54% Home Price Increase Since 2010
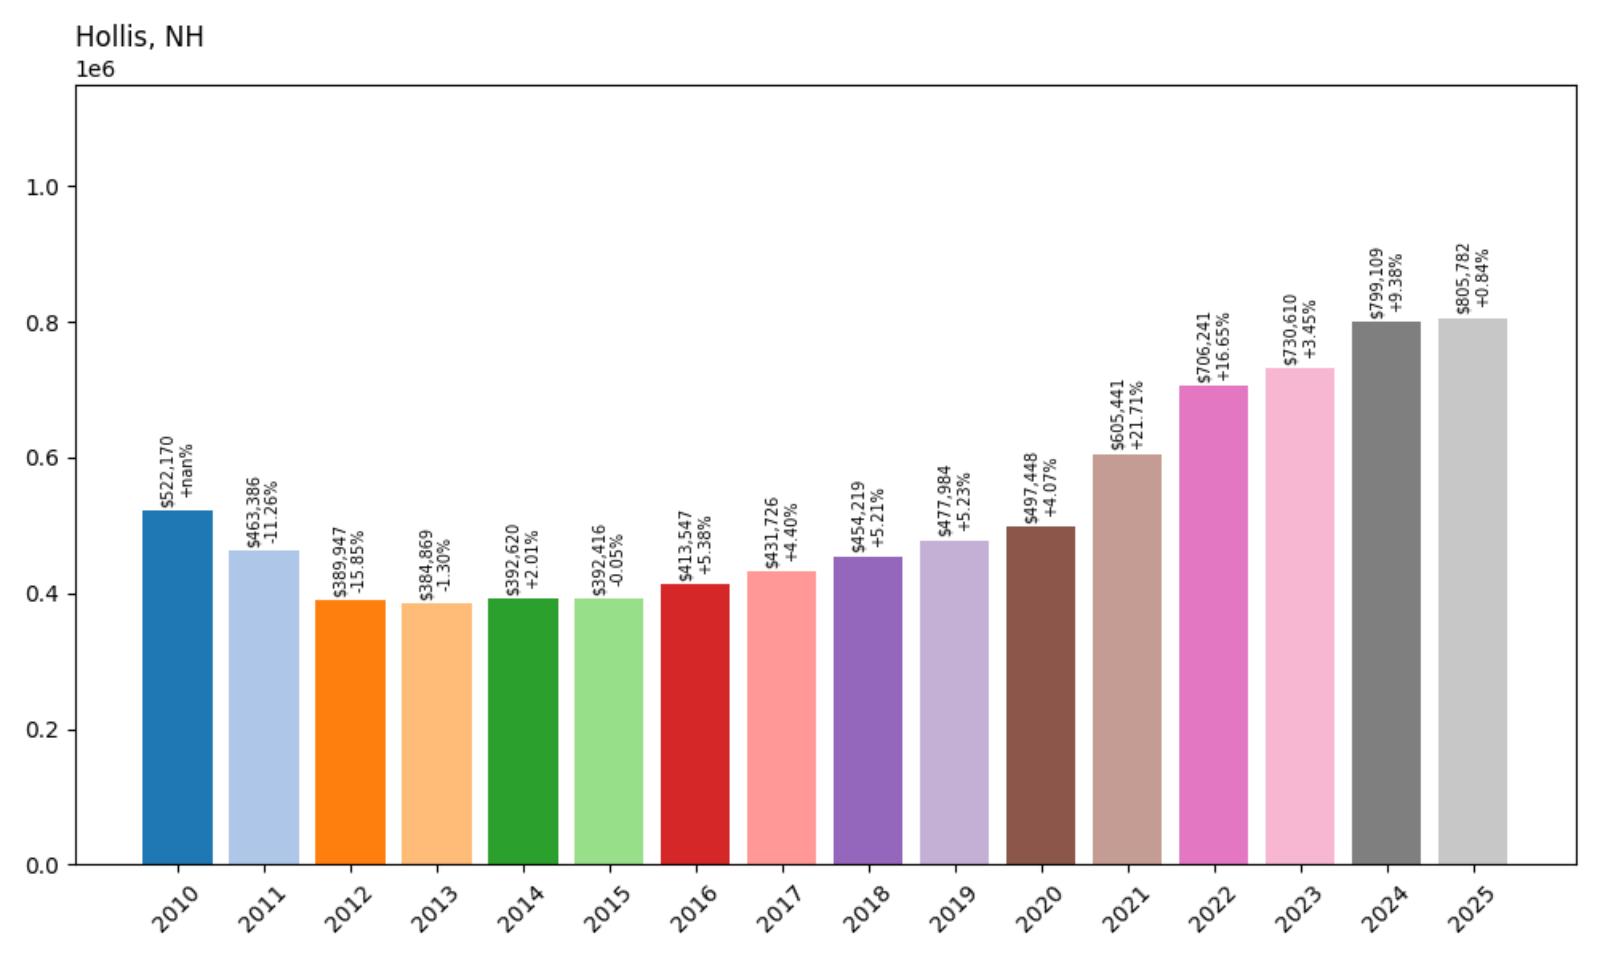
- 2010: $522,170
- 2011: $463,386 (-$58,784, -11.26% from previous year)
- 2012: $389,947 (-$73,440, -15.85% from previous year)
- 2013: $384,869 (-$5,078, -1.30% from previous year)
- 2014: $392,620 (+$7,751, +2.01% from previous year)
- 2015: $392,416 (-$204, -0.05% from previous year)
- 2016: $413,547 (+$21,131, +5.38% from previous year)
- 2017: $431,726 (+$18,179, +4.40% from previous year)
- 2018: $454,219 (+$22,494, +5.21% from previous year)
- 2019: $477,984 (+$23,764, +5.23% from previous year)
- 2020: $497,448 (+$19,465, +4.07% from previous year)
- 2021: $605,441 (+$107,992, +21.71% from previous year)
- 2022: $706,241 (+$100,800, +16.65% from previous year)
- 2023: $730,610 (+$24,370, +3.45% from previous year)
- 2024: $799,109 (+$68,498, +9.38% from previous year)
- 2025: $805,782 (+$6,674, +0.84% from previous year)
Hollis endured one of the most severe market corrections of any New Hampshire community, with home values declining by over 25% between 2010 and 2013. The recovery was gradual through the late 2010s before accelerating dramatically during 2021-2022, when values increased by over 38% in two years. Despite the modest 54% total appreciation since 2010, the current median price above $805,000 positions Hollis among the state’s most expensive communities.
Hollis – Premium Community With Historic Appeal
Hollis, located in Hillsborough County with approximately 8,200 residents, has long been recognized as one of southern New Hampshire’s most desirable residential communities, combining historic New England charm with modern suburban amenities. The town’s well-preserved village center, excellent schools, and commitment to maintaining rural character create exceptional appeal for affluent families seeking premium residential environments. Hollis’s location provides convenient access to employment centers throughout southern New Hampshire and northern Massachusetts while preserving the small-town atmosphere that defines its character.
The town’s real estate market reflects its established reputation as a premium destination where historic properties, excellent schools, and comprehensive municipal services justify higher home prices. Hollis offers diverse housing options, from colonial-era homes in the historic village to modern developments that provide contemporary amenities while respecting traditional architectural styles. The community’s recreational facilities, cultural programs, and natural amenities enhance quality of life and support sustained demand from buyers willing to pay premium prices for exceptional residential environments.
8. Greenland – 139% Home Price Increase Since 2010
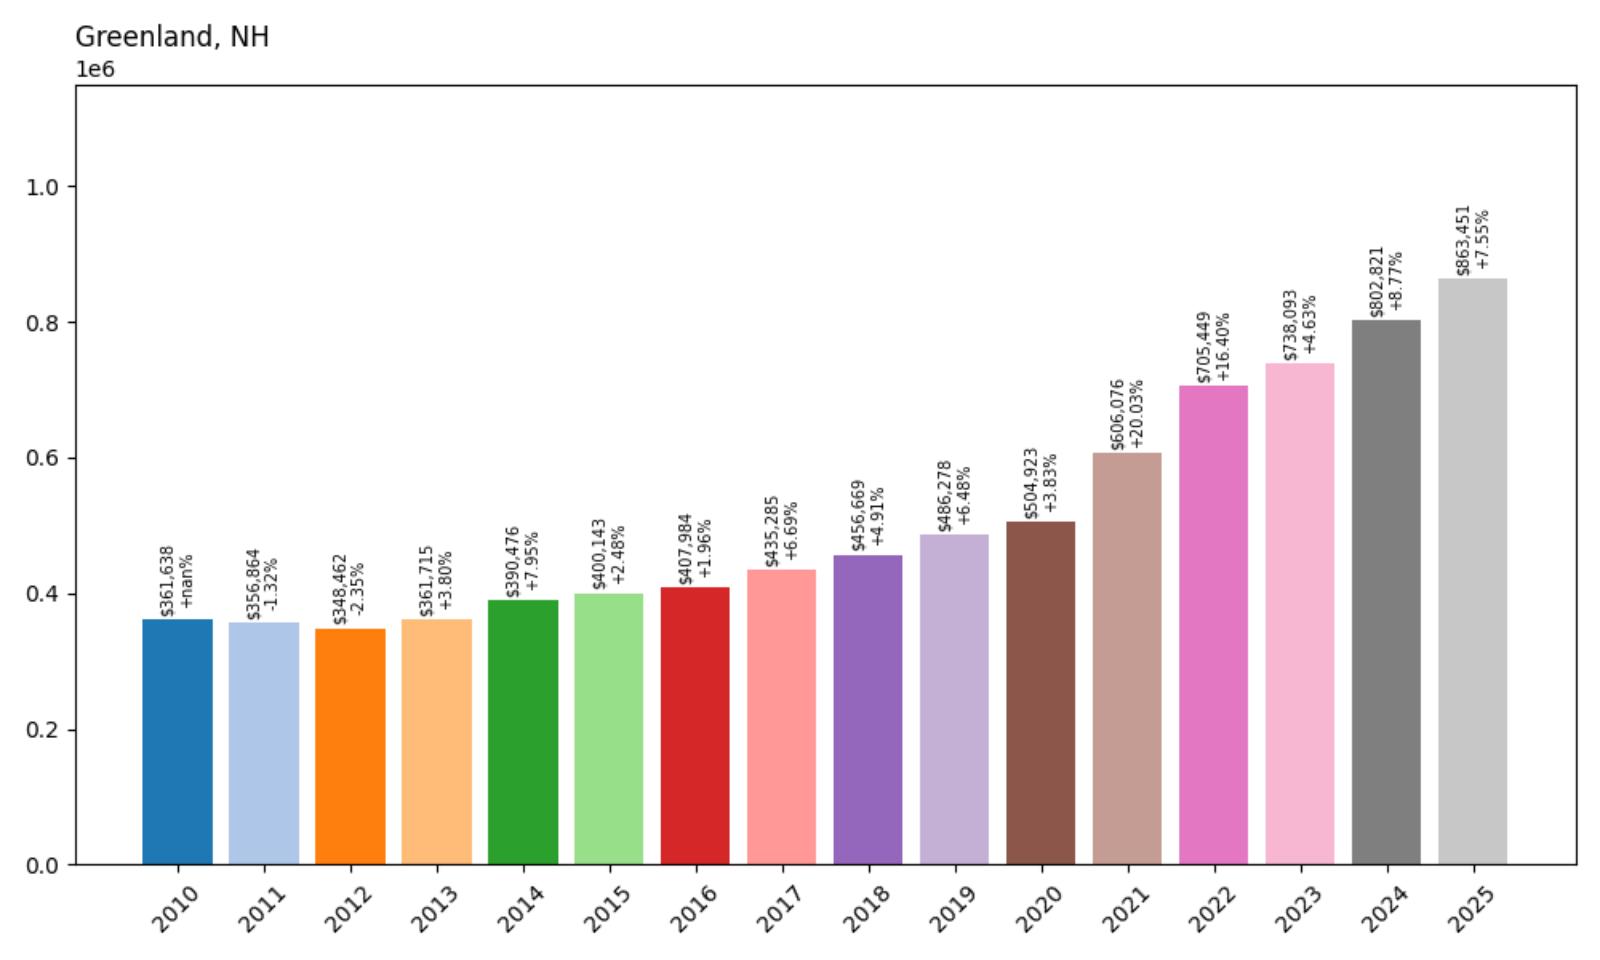
- 2010: $361,638
- 2011: $356,864 (-$4,774, -1.32% from previous year)
- 2012: $348,462 (-$8,402, -2.35% from previous year)
- 2013: $361,715 (+$13,253, +3.80% from previous year)
- 2014: $390,476 (+$28,761, +7.95% from previous year)
- 2015: $400,143 (+$9,667, +2.48% from previous year)
- 2016: $407,984 (+$7,841, +1.96% from previous year)
- 2017: $435,285 (+$27,301, +6.69% from previous year)
- 2018: $456,669 (+$21,384, +4.91% from previous year)
- 2019: $486,278 (+$29,609, +6.48% from previous year)
- 2020: $504,923 (+$18,645, +3.83% from previous year)
- 2021: $606,076 (+$101,153, +20.03% from previous year)
- 2022: $705,449 (+$99,373, +16.40% from previous year)
- 2023: $738,093 (+$32,644, +4.63% from previous year)
- 2024: $802,821 (+$64,728, +8.77% from previous year)
- 2025: $863,451 (+$60,630, +7.55% from previous year)
Greenland experienced minor weakness in the early 2010s before beginning consistent recovery that accelerated through the decade. The community showed particularly strong performance during 2021-2022, when home values increased by over 36% in two years, followed by continued robust growth through 2025. The 139% total appreciation since 2010 reflects Greenland’s strategic location and appeal as a premium Seacoast community with both residential charm and regional accessibility.
Greenland – Seacoast Character With Modern Appeal
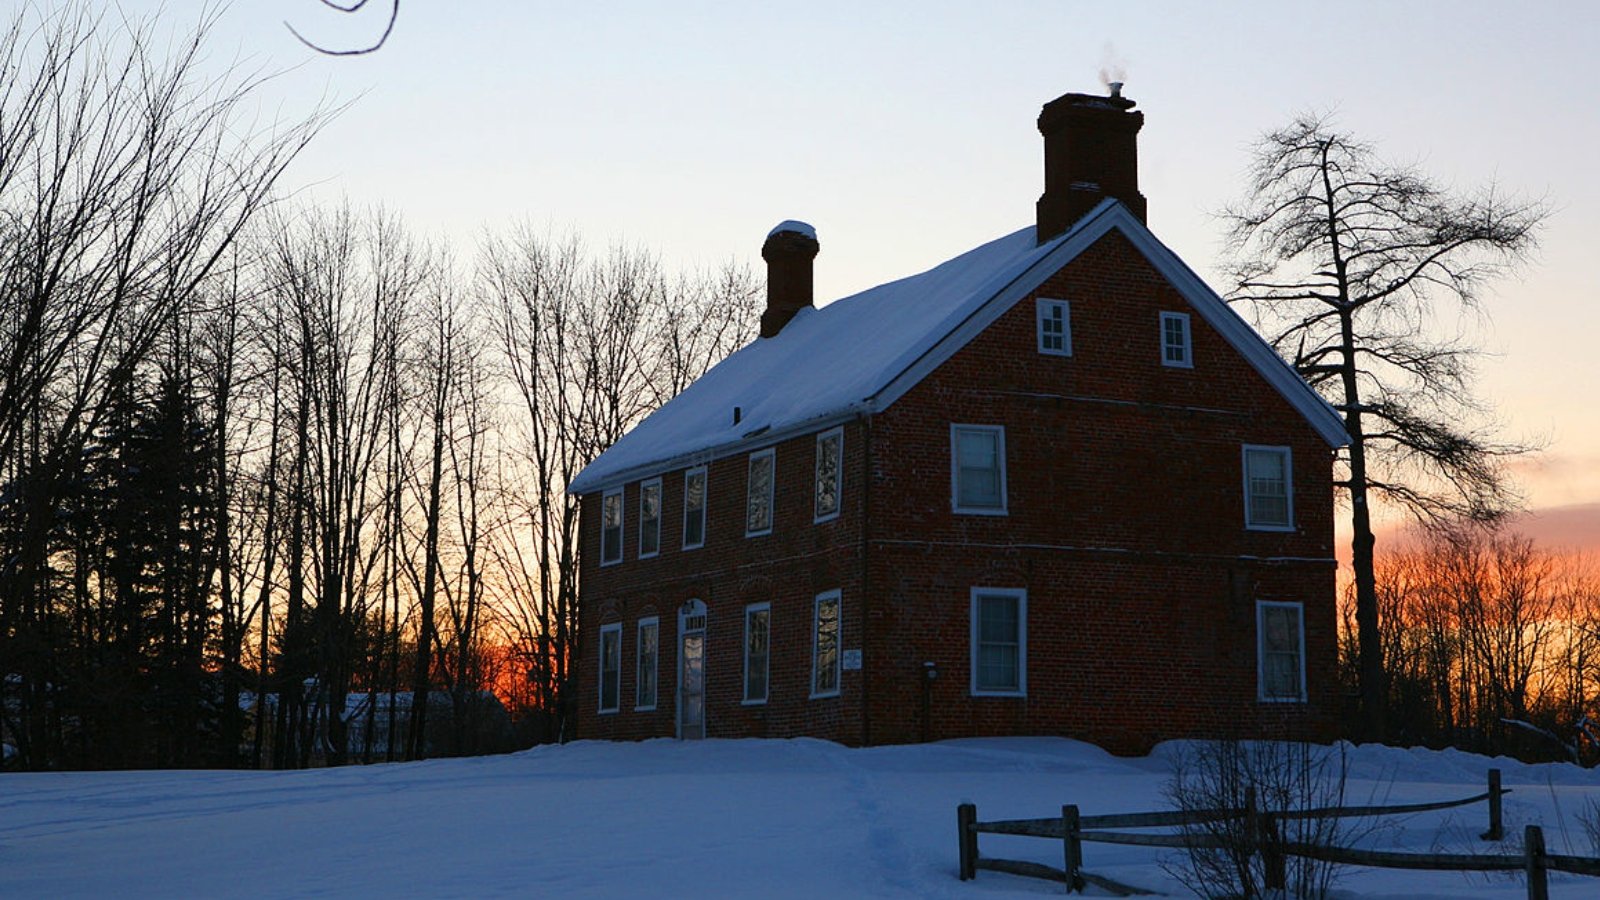
Greenland, located in Rockingham County with approximately 4,300 residents, offers an exceptional combination of Seacoast location, rural character, and modern suburban amenities that has driven remarkable real estate appreciation. The community’s position between Portsmouth and Exeter provides convenient access to major employment centers while maintaining the agricultural heritage and natural beauty that define much of the New Hampshire Seacoast. Greenland’s careful balance of development and conservation has created sustained appeal for buyers seeking alternatives to more urbanized coastal areas.
The town’s real estate market benefits from its strategic location that provides Seacoast access without the density and expense of oceanfront communities. Greenland offers diverse housing options, from historic homes in rural settings to modern developments that provide contemporary amenities while preserving community character. The area’s natural amenities, including conservation lands, agricultural areas, and proximity to both inland and coastal recreation, enhance property values and create appeal for diverse buyer demographics seeking quality of life benefits.
7. Newfields – 55% Home Price Increase Since 2010
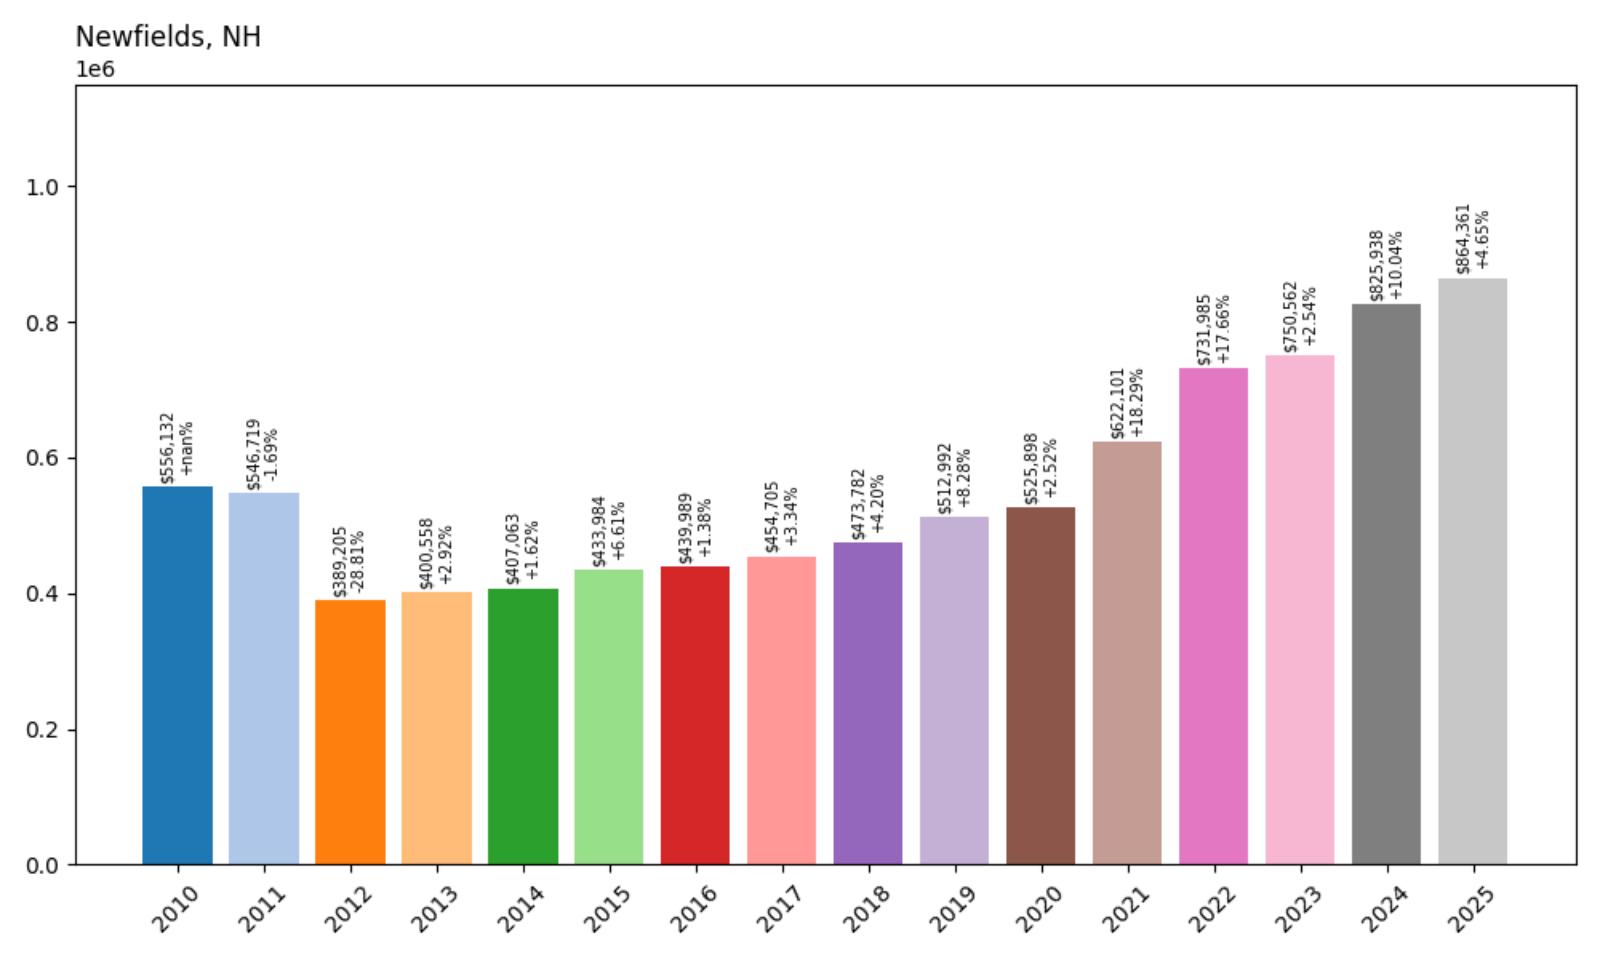
- 2010: $556,132
- 2011: $546,719 (-$9,413, -1.69% from previous year)
- 2012: $389,205 (-$157,514, -28.81% from previous year)
- 2013: $400,558 (+$11,353, +2.92% from previous year)
- 2014: $407,063 (+$6,505, +1.62% from previous year)
- 2015: $433,984 (+$26,922, +6.61% from previous year)
- 2016: $439,989 (+$6,005, +1.38% from previous year)
- 2017: $454,705 (+$14,716, +3.34% from previous year)
- 2018: $473,782 (+$19,077, +4.20% from previous year)
- 2019: $512,992 (+$39,209, +8.28% from previous year)
- 2020: $525,898 (+$12,906, +2.52% from previous year)
- 2021: $622,101 (+$96,203, +18.29% from previous year)
- 2022: $731,985 (+$109,883, +17.66% from previous year)
- 2023: $750,562 (+$18,577, +2.54% from previous year)
- 2024: $825,938 (+$75,376, +10.04% from previous year)
- 2025: $864,361 (+$38,423, +4.65% from previous year)
Newfields experienced one of the most dramatic market corrections in the dataset, with home values plummeting nearly 29% in 2012 from an already high baseline. The recovery was gradual through the late 2010s before accelerating dramatically during 2021-2022, when values increased by over 35% in two years. Despite the modest 55% total appreciation since 2010, the current median price above $864,000 positions Newfields among New Hampshire’s most exclusive communities.
Newfields – Exclusive Seacoast Enclave
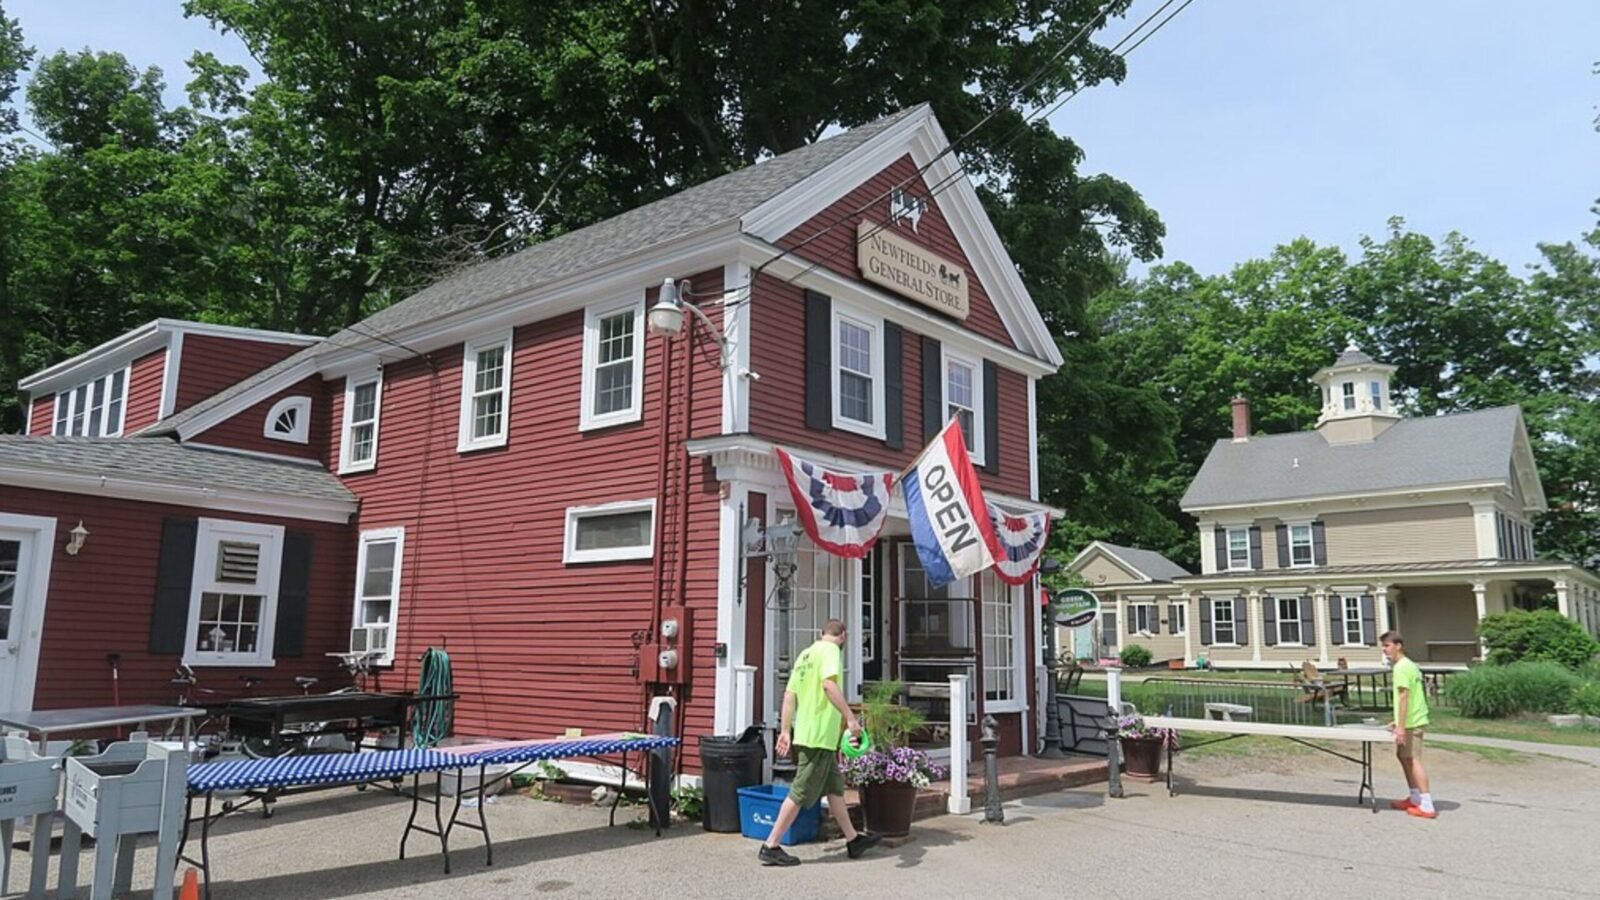
Newfields, located in Rockingham County with approximately 1,700 residents, represents one of New Hampshire’s most exclusive small communities where rural estates and historic properties command premium prices due to their scarcity and desirability. The town’s location in the heart of the Seacoast region provides access to employment and cultural opportunities while maintaining the privacy and natural amenities that appeal to affluent buyers seeking distinctive residential environments. Newfields’s small size and commitment to preserving rural character create an intimate community atmosphere that supports premium property values.
The town’s real estate market capitalizes on its combination of exclusivity, natural beauty, and regional access that appeals to high-income professionals and executives seeking alternatives to suburban development patterns. Newfields offers large estates, historic properties, and luxury homes on substantial parcels that provide privacy and natural amenities while maintaining reasonable access to Portsmouth, Exeter, and other regional centers. The community’s agricultural heritage and conservation efforts help preserve the rural landscapes that drive premium real estate demand.
6. Hampton Falls – 172% Home Price Increase Since 2010
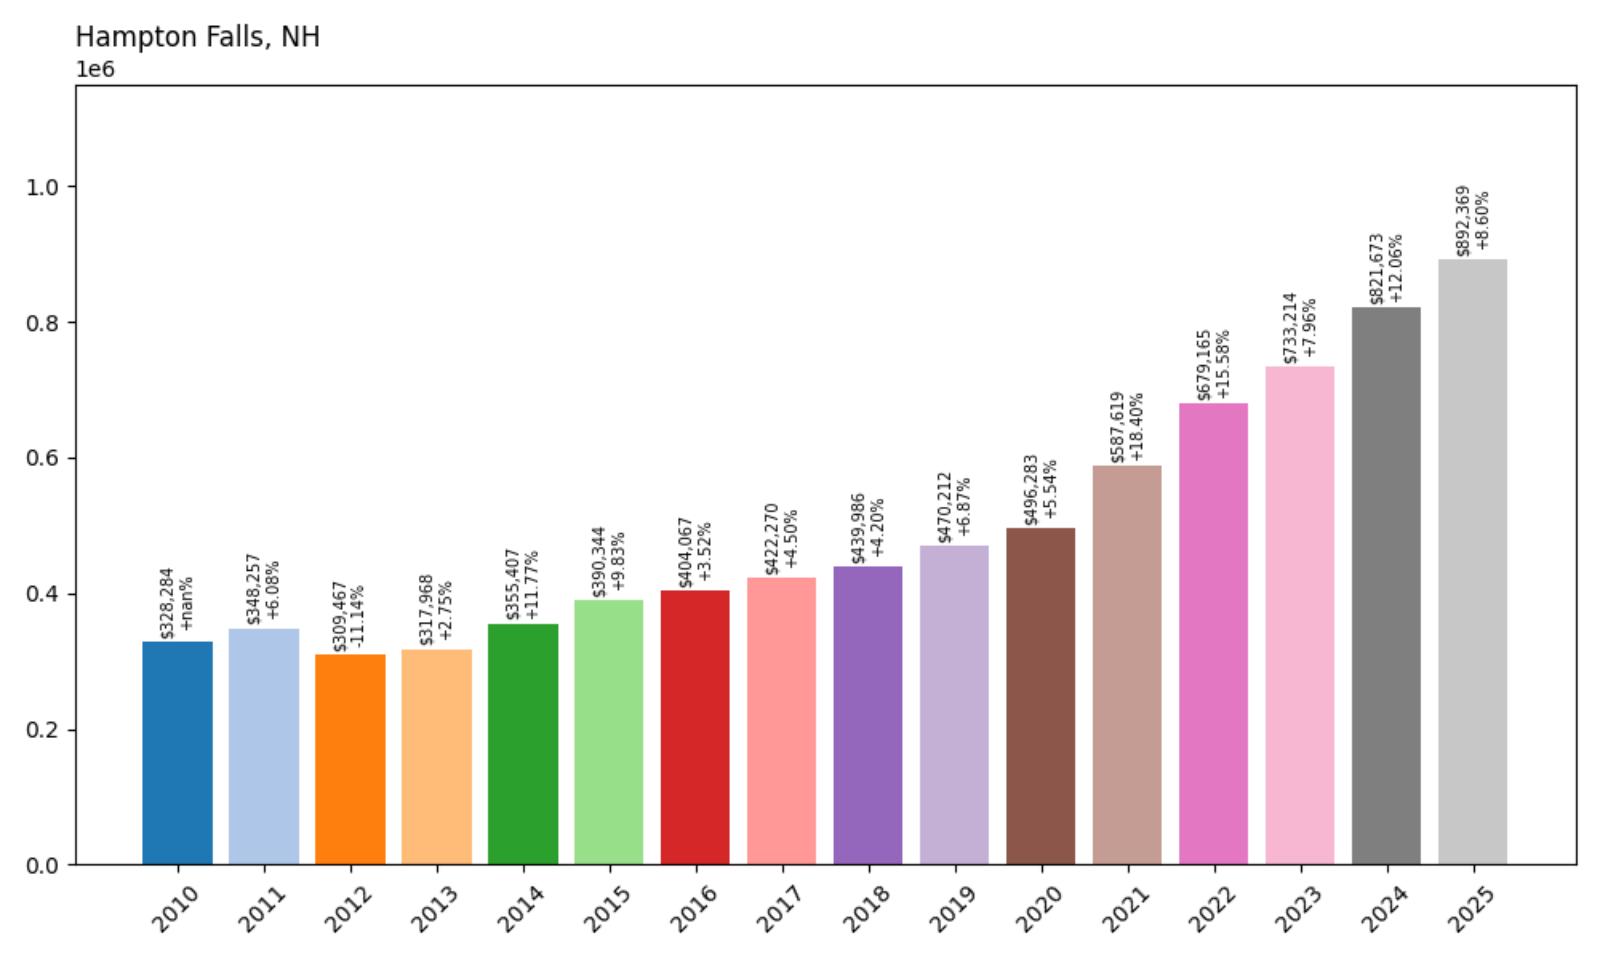
- 2010: $328,284
- 2011: $348,257 (+$19,972, +6.08% from previous year)
- 2012: $309,467 (-$38,790, -11.14% from previous year)
- 2013: $317,968 (+$8,501, +2.75% from previous year)
- 2014: $355,407 (+$37,439, +11.77% from previous year)
- 2015: $390,344 (+$34,938, +9.83% from previous year)
- 2016: $404,067 (+$13,723, +3.52% from previous year)
- 2017: $422,270 (+$18,203, +4.50% from previous year)
- 2018: $439,986 (+$17,716, +4.20% from previous year)
- 2019: $470,212 (+$30,227, +6.87% from previous year)
- 2020: $496,283 (+$26,070, +5.54% from previous year)
- 2021: $587,619 (+$91,337, +18.40% from previous year)
- 2022: $679,165 (+$91,546, +15.58% from previous year)
- 2023: $733,214 (+$54,048, +7.96% from previous year)
- 2024: $821,673 (+$88,459, +12.06% from previous year)
- 2025: $892,369 (+$70,697, +8.60% from previous year)
Hampton Falls recovered from early 2010s weakness to demonstrate exceptional consistency through the mid-2010s before experiencing remarkable acceleration that continues through 2025. The most significant transformation occurred during 2021-2022, when values increased by over 33% in two years, followed by continued robust growth. The 172% total appreciation since 2010 represents one of the strongest performance records among New Hampshire communities, with exceptional growth continuing through 2025.
Hampton Falls – Seacoast Sophistication
Hampton Falls, located in Rockingham County with approximately 2,400 residents, combines Seacoast location with rural sophistication to create one of New Hampshire’s most desirable residential destinations. The community’s proximity to Hampton Beach and the Atlantic Ocean, combined with its rural character and upscale residential development, appeals to affluent buyers seeking coastal access without the density of beachfront communities. Hampton Falls has emerged as a premier destination for executives and professionals seeking luxury homes with natural amenities and recreational access.
The town’s real estate market capitalizes on its unique combination of coastal proximity, rural character, and upscale residential development that creates exceptional appeal for affluent buyers. Hampton Falls offers diverse luxury housing options, from estate properties on large parcels to modern developments that provide contemporary amenities while preserving natural settings. The community’s location provides easy access to beaches, recreational facilities, and cultural attractions while maintaining the privacy and exclusivity that justify premium pricing.
5. North Hampton – 155% Home Price Increase Since 2010

- 2010: $365,789
- 2011: $364,916 (-$872, -0.24% from previous year)
- 2012: $371,988 (+$7,072, +1.94% from previous year)
- 2013: $396,811 (+$24,823, +6.67% from previous year)
- 2014: $431,036 (+$34,225, +8.63% from previous year)
- 2015: $439,051 (+$8,015, +1.86% from previous year)
- 2016: $459,793 (+$20,742, +4.72% from previous year)
- 2017: $492,343 (+$32,549, +7.08% from previous year)
- 2018: $513,624 (+$21,281, +4.32% from previous year)
- 2019: $525,667 (+$12,043, +2.34% from previous year)
- 2020: $562,827 (+$37,160, +7.07% from previous year)
- 2021: $674,967 (+$112,140, +19.92% from previous year)
- 2022: $787,918 (+$112,951, +16.73% from previous year)
- 2023: $807,152 (+$19,234, +2.44% from previous year)
- 2024: $900,563 (+$93,411, +11.57% from previous year)
- 2025: $931,635 (+$31,072, +3.45% from previous year)
North Hampton demonstrated remarkable consistency throughout the 2010s, with steady annual appreciation that accelerated dramatically during the pandemic period. The most exceptional growth occurred during 2021-2022, when home values increased by over 36% in two years, followed by continued strong performance through 2025. The 155% total appreciation since 2010 reflects North Hampton’s evolution into one of New Hampshire’s premier coastal communities, with the median price approaching $932,000.
North Hampton – Coastal Excellence
North Hampton, located in Rockingham County with approximately 4,500 residents, represents the pinnacle of New Hampshire coastal living where oceanfront access combines with upscale residential character to create exceptional real estate demand. The community’s Atlantic coastline, combined with its proximity to Portsmouth and excellent municipal services, has made it one of the state’s most sought-after residential destinations. North Hampton’s careful balance of coastal development and environmental protection has preserved the natural qualities that drive premium property values.
The town’s real estate market capitalizes on its oceanfront location and upscale residential character that appeals to affluent buyers seeking coastal lifestyle benefits with small-town charm. North Hampton offers diverse luxury housing options, from oceanfront estates to inland properties that still provide coastal access and community amenities. The area’s beaches, conservation areas, and recreational facilities enhance property values while the community’s commitment to quality development ensures that growth maintains rather than compromises the coastal character that attracts residents.
4. Hanover – 125% Home Price Increase Since 2010
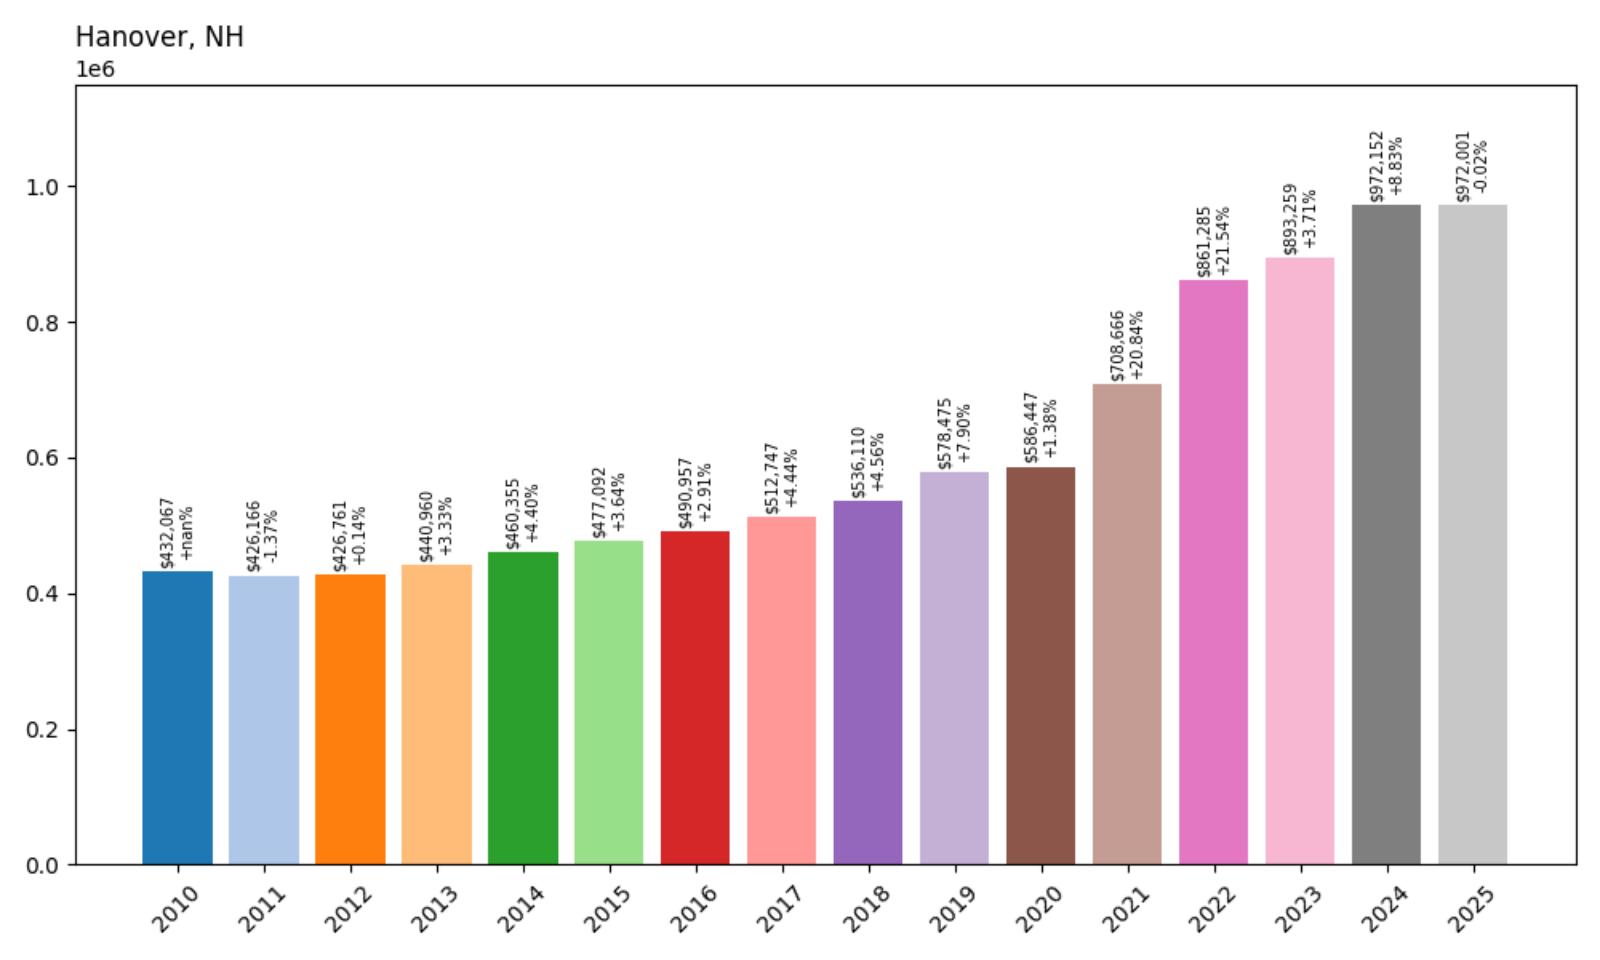
- 2010: $432,067
- 2011: $426,166 (-$5,901, -1.37% from previous year)
- 2012: $426,761 (+$595, +0.14% from previous year)
- 2013: $440,960 (+$14,199, +3.33% from previous year)
- 2014: $460,355 (+$19,395, +4.40% from previous year)
- 2015: $477,092 (+$16,737, +3.64% from previous year)
- 2016: $490,957 (+$13,865, +2.91% from previous year)
- 2017: $512,747 (+$21,789, +4.44% from previous year)
- 2018: $536,110 (+$23,364, +4.56% from previous year)
- 2019: $578,475 (+$42,365, +7.90% from previous year)
- 2020: $586,447 (+$7,972, +1.38% from previous year)
- 2021: $708,666 (+$122,219, +20.84% from previous year)
- 2022: $861,285 (+$152,619, +21.54% from previous year)
- 2023: $893,259 (+$31,974, +3.71% from previous year)
- 2024: $972,152 (+$78,893, +8.83% from previous year)
- 2025: $972,001 (-$151, -0.02% from previous year)
Hanover demonstrated exceptional stability through most of the 2010s, with consistent but modest growth that reflected the institutional stability provided by Dartmouth College. The transformation during 2021-2022 was extraordinary, with home values increasing by over 42% in two years, pushing the median price above $972,000. The 125% total appreciation since 2010 reflects Hanover’s unique position as both a prestigious college town and an increasingly exclusive residential destination.
Hanover – Ivy League Prestige Meets Real Estate Premium

Hanover, home to Dartmouth College and approximately 11,700 residents, represents one of New England’s most prestigious residential markets where educational excellence combines with cultural sophistication to create exceptional real estate demand. Located in Grafton County along the Connecticut River, the community offers the intellectual and cultural resources of a major university while maintaining the charm and natural beauty that define the Upper Valley region. Hanover’s association with one of America’s most prestigious institutions creates sustained appeal for affluent buyers seeking sophisticated residential environments.
The town’s real estate market capitalizes on its unique combination of educational prestige, cultural amenities, and natural beauty that appeals to faculty, administrators, alumni, and affluent professionals seeking intellectually stimulating residential environments. Hanover offers diverse housing options, from historic homes near the campus to modern developments that provide contemporary amenities while respecting traditional architectural styles. The community’s cultural resources, including museums, theaters, and lecture series, create amenities typically associated with major metropolitan areas while maintaining small-town character.
3. Newington – 137% Home Price Increase Since 2010
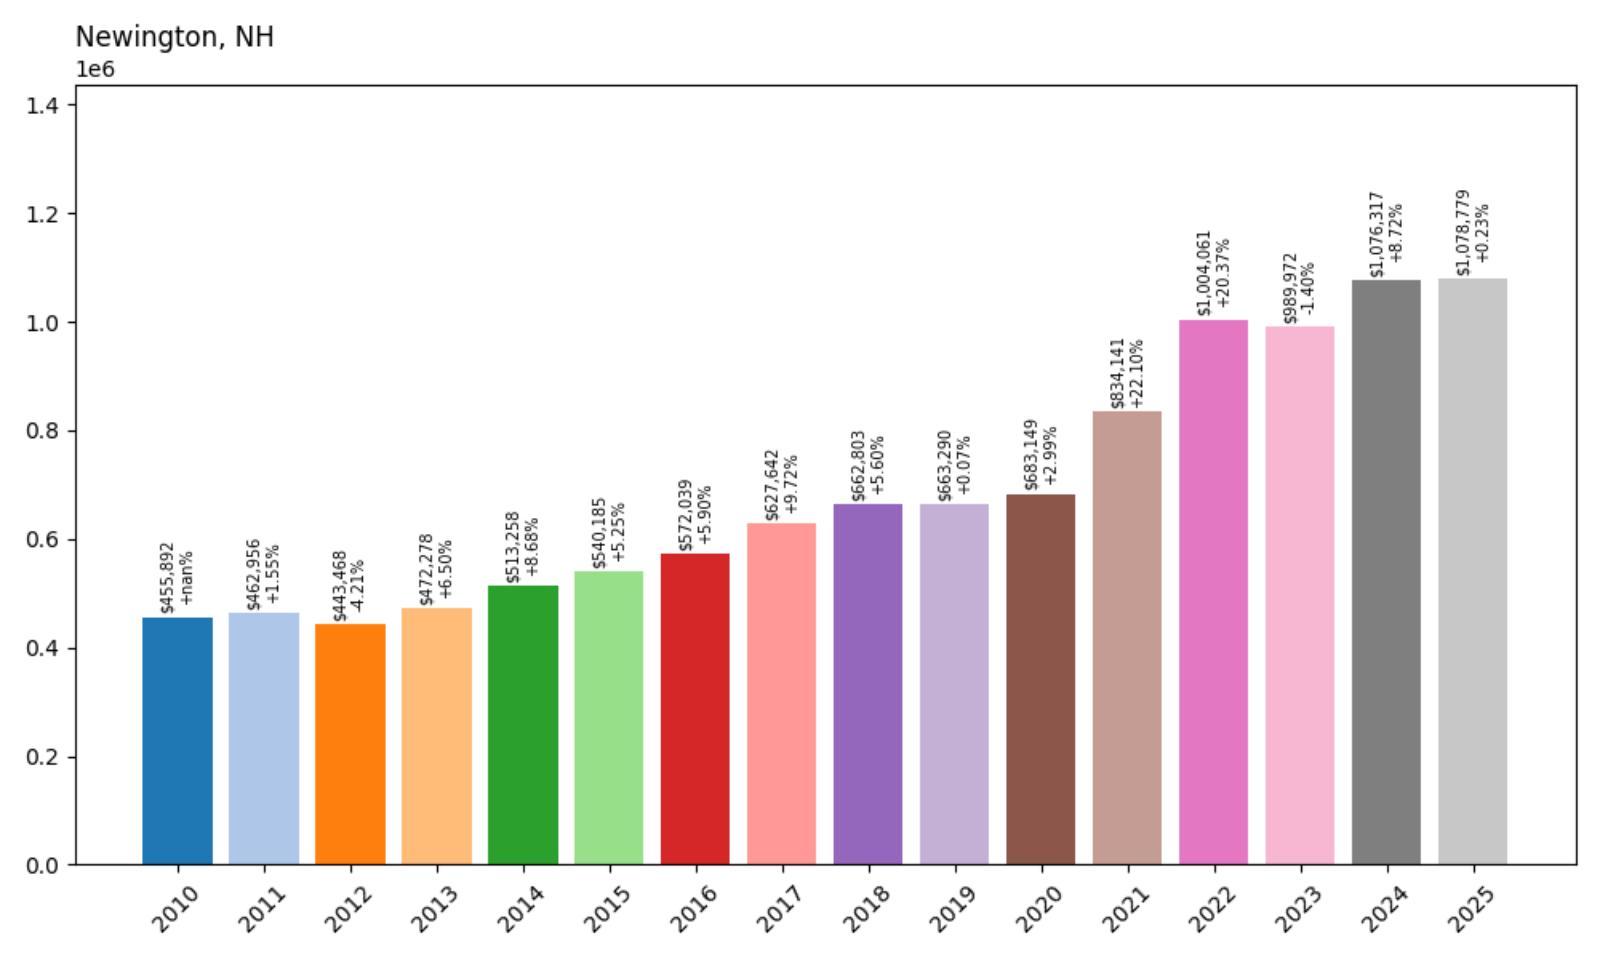
- 2010: $455,892
- 2011: $462,956 (+$7,064, +1.55% from previous year)
- 2012: $443,468 (-$19,488, -4.21% from previous year)
- 2013: $472,278 (+$28,810, +6.50% from previous year)
- 2014: $513,258 (+$40,980, +8.68% from previous year)
- 2015: $540,185 (+$26,927, +5.25% from previous year)
- 2016: $572,039 (+$31,855, +5.90% from previous year)
- 2017: $627,642 (+$55,603, +9.72% from previous year)
- 2018: $662,803 (+$35,162, +5.60% from previous year)
- 2019: $663,290 (+$487, +0.07% from previous year)
- 2020: $683,149 (+$19,859, +2.99% from previous year)
- 2021: $834,141 (+$150,992, +22.10% from previous year)
- 2022: $1,004,061 (+$169,920, +20.37% from previous year)
- 2023: $989,972 (-$14,089, -1.40% from previous year)
- 2024: $1,076,317 (+$86,346, +8.72% from previous year)
- 2025: $1,078,779 (+$2,462, +0.23% from previous year)
Newington showed consistent appreciation through most of the 2010s, with particularly strong performance from 2014 through 2018. The pandemic period brought exceptional acceleration, with home values increasing by over 42% during 2021-2022 alone, pushing the median price above $1.07 million. The 137% total appreciation since 2010 reflects Newington’s strategic Seacoast location and appeal as an exclusive residential community with both waterfront access and regional connectivity.
Newington – Seacoast Exclusivity at Its Peak

Newington, located in Rockingham County with approximately 750 residents, represents one of New Hampshire’s most exclusive coastal communities where waterfront location combines with small-town character to create extraordinary real estate demand. The town’s position on Great Bay and the Piscataqua River provides exceptional waterfront opportunities while its small size ensures intimacy and exclusivity that justifies million-dollar median home prices. Newington’s commitment to preserving its coastal character while accommodating selective high-end development has created sustained appeal for the most affluent buyers.
The town’s real estate market capitalizes on its rare combination of waterfront access, exclusivity, and proximity to major employment centers that creates exceptional appeal for affluent professionals and executives. Newington offers some of New Hampshire’s most prestigious waterfront properties, with many homes providing spectacular views of Great Bay and access to boating and other water recreation activities. The community’s small size and waterfront location create natural scarcity that supports premium pricing while its proximity to Portsmouth and other regional centers provides convenient access to employment and cultural opportunities.
2. Rye – 155% Home Price Increase Since 2010
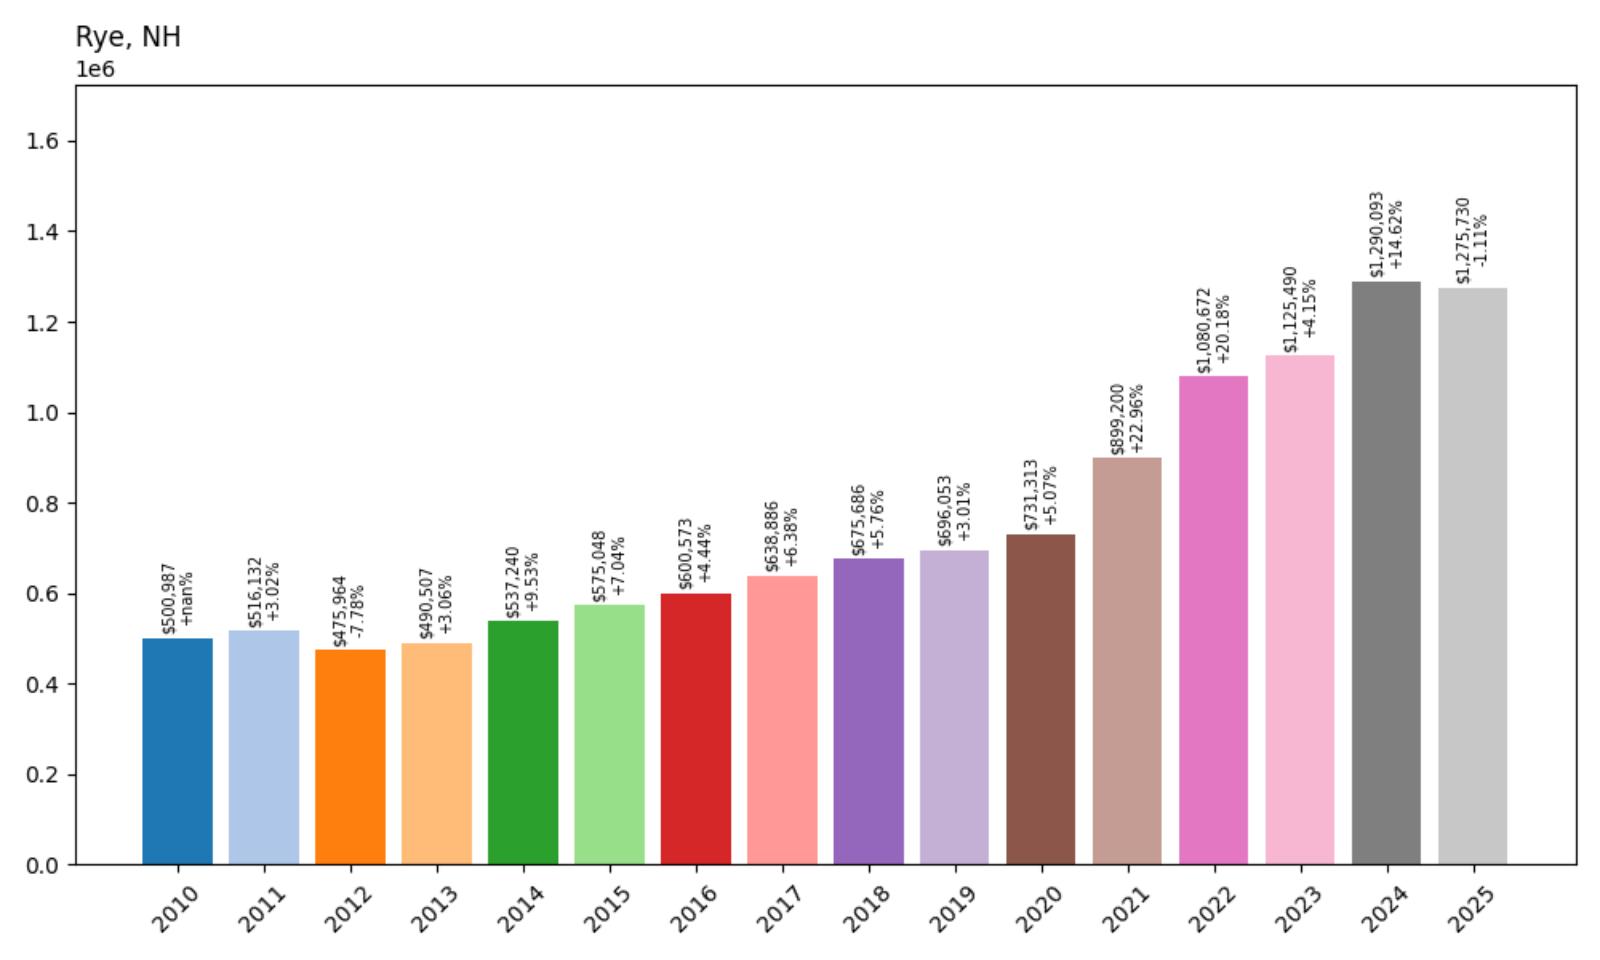
- 2010: $500,987
- 2011: $516,132 (+$15,144, +3.02% from previous year)
- 2012: $475,964 (-$40,168, -7.78% from previous year)
- 2013: $490,507 (+$14,543, +3.06% from previous year)
- 2014: $537,240 (+$46,733, +9.53% from previous year)
- 2015: $575,048 (+$37,808, +7.04% from previous year)
- 2016: $600,573 (+$25,524, +4.44% from previous year)
- 2017: $638,886 (+$38,313, +6.38% from previous year)
- 2018: $675,686 (+$36,800, +5.76% from previous year)
- 2019: $696,053 (+$20,367, +3.01% from previous year)
- 2020: $731,313 (+$35,260, +5.07% from previous year)
- 2021: $899,200 (+$167,887, +22.96% from previous year)
- 2022: $1,080,672 (+$181,471, +20.18% from previous year)
- 2023: $1,125,490 (+$44,818, +4.15% from previous year)
- 2024: $1,290,093 (+$164,603, +14.62% from previous year)
- 2025: $1,275,730 (-$14,363, -1.11% from previous year)
Rye recovered from early 2010s weakness to demonstrate exceptional consistency through the mid-to-late 2010s, with steady annual appreciation averaging around 5-6% per year. The pandemic period brought extraordinary acceleration, with home values increasing by over 43% during 2021-2022, followed by continued strong growth through 2024. The 155% total appreciation since 2010 reflects Rye’s status as New Hampshire’s premier oceanfront community, with the median price approaching $1.28 million.
Rye – New Hampshire’s Premier Oceanfront Destination
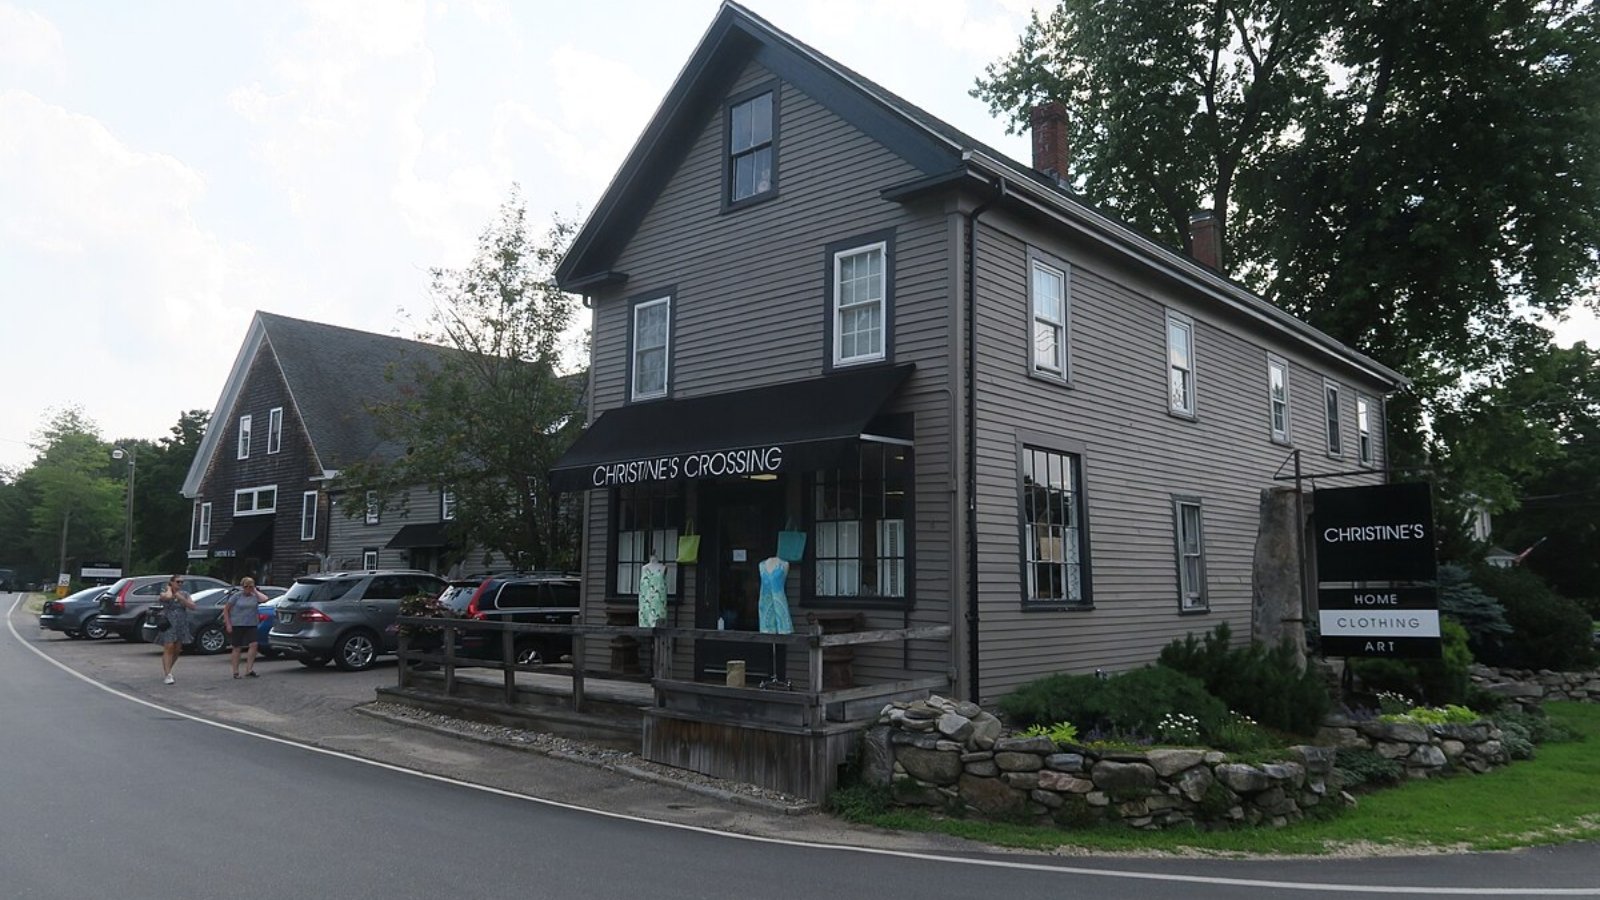
Rye, located in Rockingham County with approximately 5,500 residents, stands as New Hampshire’s most prestigious oceanfront community where Atlantic coastline combines with upscale residential character to create exceptional real estate demand. The town’s 18 miles of rocky coastline, combined with its proximity to Portsmouth and excellent municipal services, has made it one of New England’s most sought-after coastal destinations. Rye’s careful balance of oceanfront development and environmental protection has preserved the natural qualities that justify median home prices approaching $1.3 million.
The town’s real estate market capitalizes on its extensive oceanfront location and exclusive residential character that appeals to the region’s most affluent buyers seeking coastal lifestyle benefits. Rye offers New Hampshire’s most prestigious oceanfront properties, from historic seaside estates to modern luxury homes that provide spectacular Atlantic views and direct beach access. The community’s beaches, conservation areas, and recreational facilities enhance property values while its commitment to preserving coastal character ensures that development maintains the environmental qualities that attract discriminating buyers.
1. New Castle – 151% Home Price Increase Since 2010
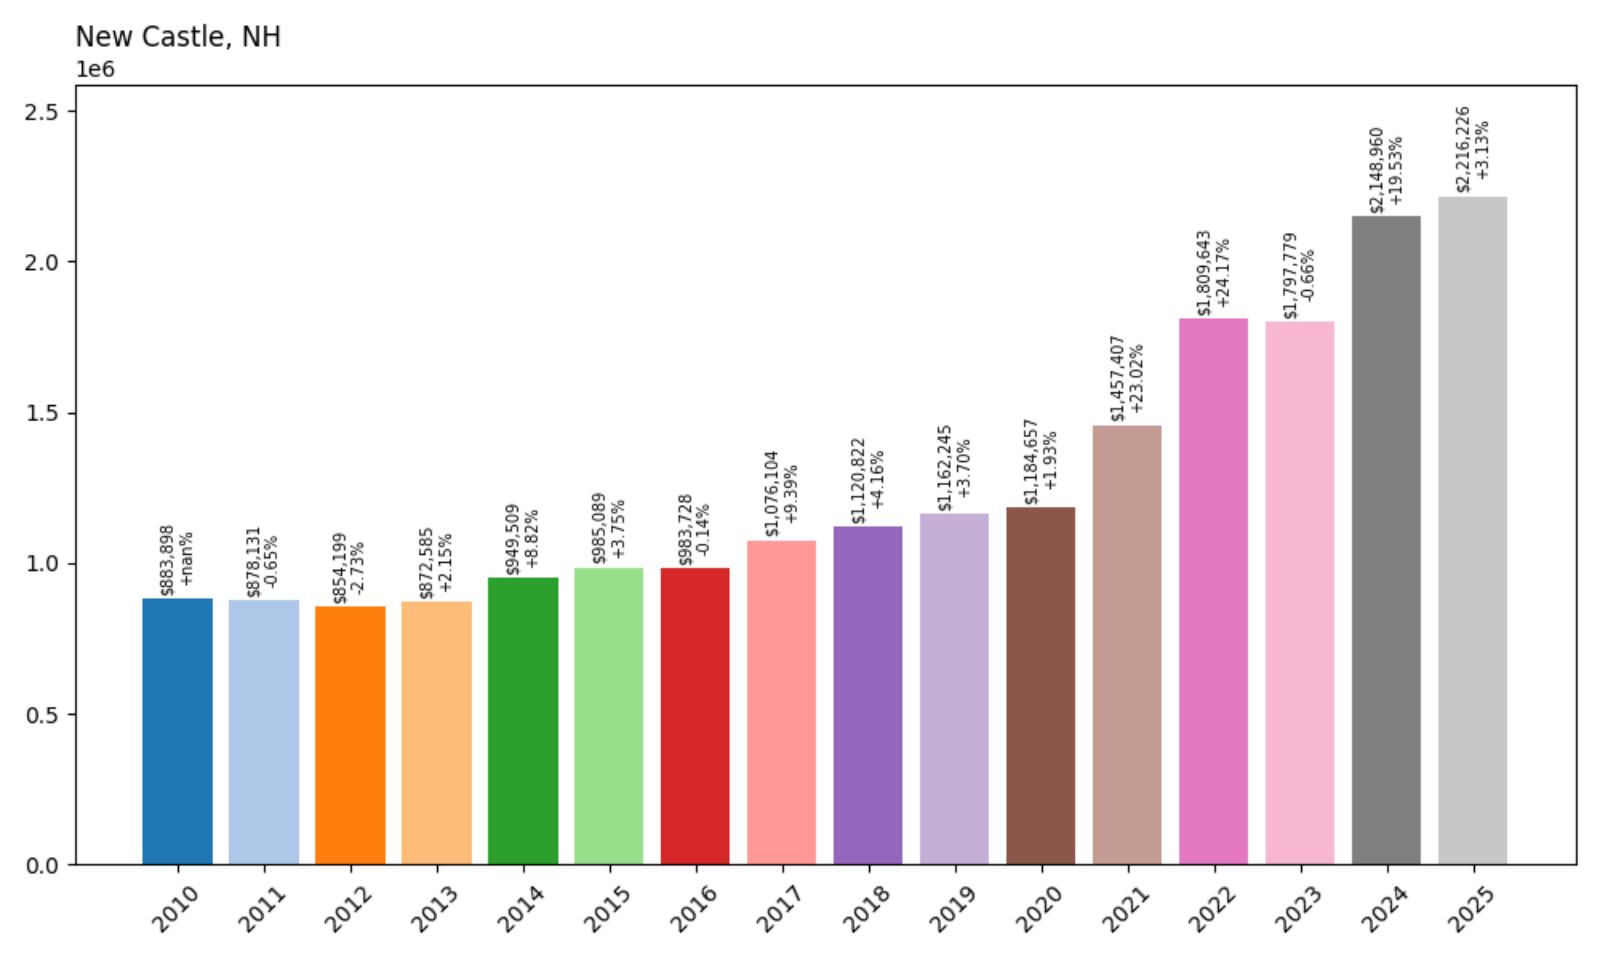
- 2010: $883,898
- 2011: $878,131 (-$5,766, -0.65% from previous year)
- 2012: $854,199 (-$23,933, -2.73% from previous year)
- 2013: $872,585 (+$18,386, +2.15% from previous year)
- 2014: $949,509 (+$76,924, +8.82% from previous year)
- 2015: $985,089 (+$35,580, +3.75% from previous year)
- 2016: $983,728 (-$1,361, -0.14% from previous year)
- 2017: $1,076,104 (+$92,376, +9.39% from previous year)
- 2018: $1,120,822 (+$44,718, +4.16% from previous year)
- 2019: $1,162,245 (+$41,423, +3.70% from previous year)
- 2020: $1,184,657 (+$22,412, +1.93% from previous year)
- 2021: $1,457,407 (+$272,750, +23.02% from previous year)
- 2022: $1,809,643 (+$352,236, +24.17% from previous year)
- 2023: $1,797,779 (-$11,863, -0.66% from previous year)
- 2024: $2,148,960 (+$351,180, +19.53% from previous year)
- 2025: $2,216,226 (+$67,266, +3.13% from previous year)
New Castle experienced minor early-decade weakness before beginning steady recovery that accelerated dramatically during the pandemic years. The most extraordinary growth occurred during 2021-2022, when home values increased by over 47% in two years, followed by exceptional continued growth through 2024. The 151% total appreciation since 2010 reflects New Castle’s position as New Hampshire’s most exclusive residential destination, with the median price exceeding $2.2 million.
New Castle – New Hampshire’s Most Exclusive Address

New Castle, located on a historic island in Rockingham County with approximately 1,000 residents, represents the absolute pinnacle of New Hampshire residential real estate where oceanfront exclusivity combines with historic charm to create the state’s most expensive housing market. Connected to the mainland by a single causeway, this unique island community offers complete oceanfront living with spectacular Atlantic views, historic architecture, and an intimacy that cannot be replicated elsewhere in the state. New Castle’s combination of geographic exclusivity, oceanfront location, and historic significance creates unprecedented demand among the most affluent buyers.
The town’s real estate market capitalizes on its unique island location and complete oceanfront character that creates exceptional scarcity and appeal for the region’s wealthiest buyers. New Castle offers some of New England’s most prestigious oceanfront properties, with virtually every home providing ocean views and many featuring direct waterfront access. The community’s historic Fort Constitution, rocky coastline, and preserved colonial architecture enhance the exclusive atmosphere that justifies median home prices exceeding $2.2 million.