
Home prices across North Dakota reflect a complex story of oil boom cycles, agricultural prosperity, and suburban development around major cities. According to data from the Zillow Home Value Index, the state’s most expensive communities span from oil-rich western regions to thriving suburban enclaves near Fargo and Bismarck. These premium markets showcase how natural resource extraction, proximity to urban centers, and quality of life factors drive housing values in the Peace Garden State.
The data reveals dramatic price swings in many communities, particularly those tied to the Bakken oil boom that transformed western North Dakota over the past decade. While some towns experienced explosive growth followed by corrections, others have maintained steady appreciation driven by agriculture, government employment, or their role as bedroom communities for larger cities. Understanding these price patterns offers valuable insights for potential homebuyers, investors, and anyone curious about real estate dynamics in America’s fourth-largest oil-producing state.
30. Casselton – 42% Home Price Increase Since 2010
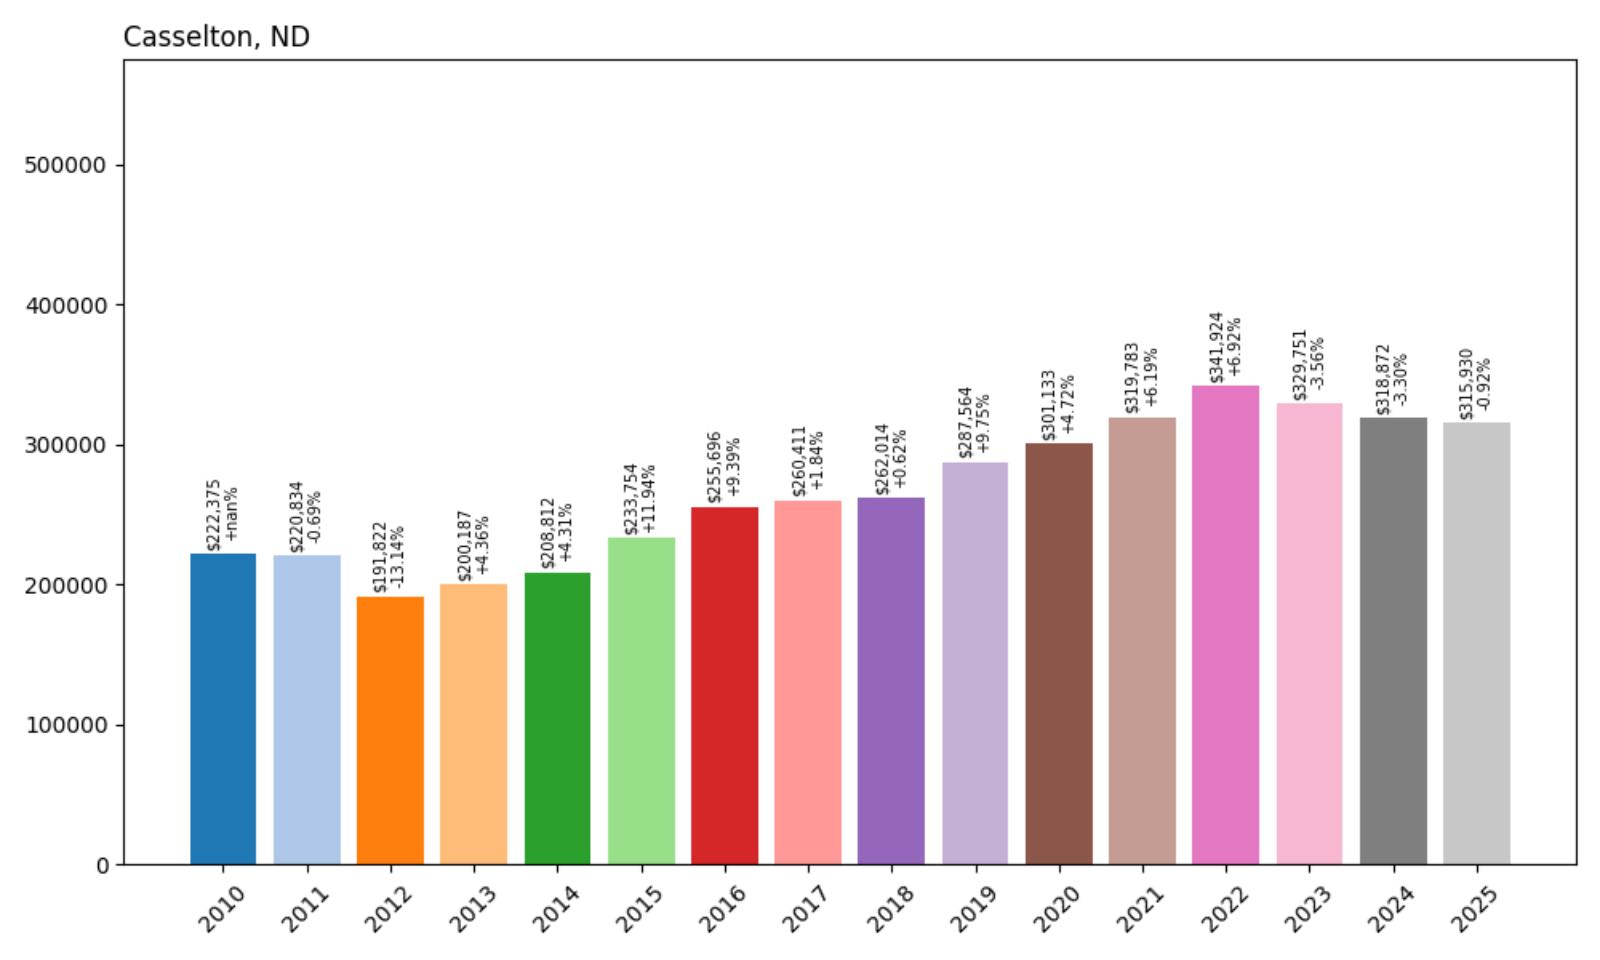
- 2010: $222,375
- 2011: $220,834 (−$1,540, −0.69% from previous year)
- 2012: $191,822 (−$29,012, −13.14% from previous year)
- 2013: $200,187 (+$8,365, +4.36% from previous year)
- 2014: $208,812 (+$8,625, +4.31% from previous year)
- 2015: $233,754 (+$24,942, +11.94% from previous year)
- 2016: $255,696 (+$21,942, +9.39% from previous year)
- 2017: $260,411 (+$4,714, +1.84% from previous year)
- 2018: $262,014 (+$1,603, +0.62% from previous year)
- 2019: $287,564 (+$25,551, +9.75% from previous year)
- 2020: $301,133 (+$13,568, +4.72% from previous year)
- 2021: $319,783 (+$18,651, +6.19% from previous year)
- 2022: $341,924 (+$22,141, +6.92% from previous year)
- 2023: $329,751 (−$12,173, −3.56% from previous year)
- 2024: $318,872 (−$10,879, −3.30% from previous year)
- 2025: $315,930 (−$2,942, −0.92% from previous year)
Casselton’s housing market demonstrates the volatility that characterized many North Dakota communities during the past 15 years. The current median home price of $315,930 represents a 42% increase from 2010 levels, though this growth came with significant fluctuations including a sharp 13% drop in 2012. The market reached its peak in 2022 at nearly $342,000 before experiencing a modest correction over the past three years.
Casselton – Agricultural Hub With Growing Commuter Appeal
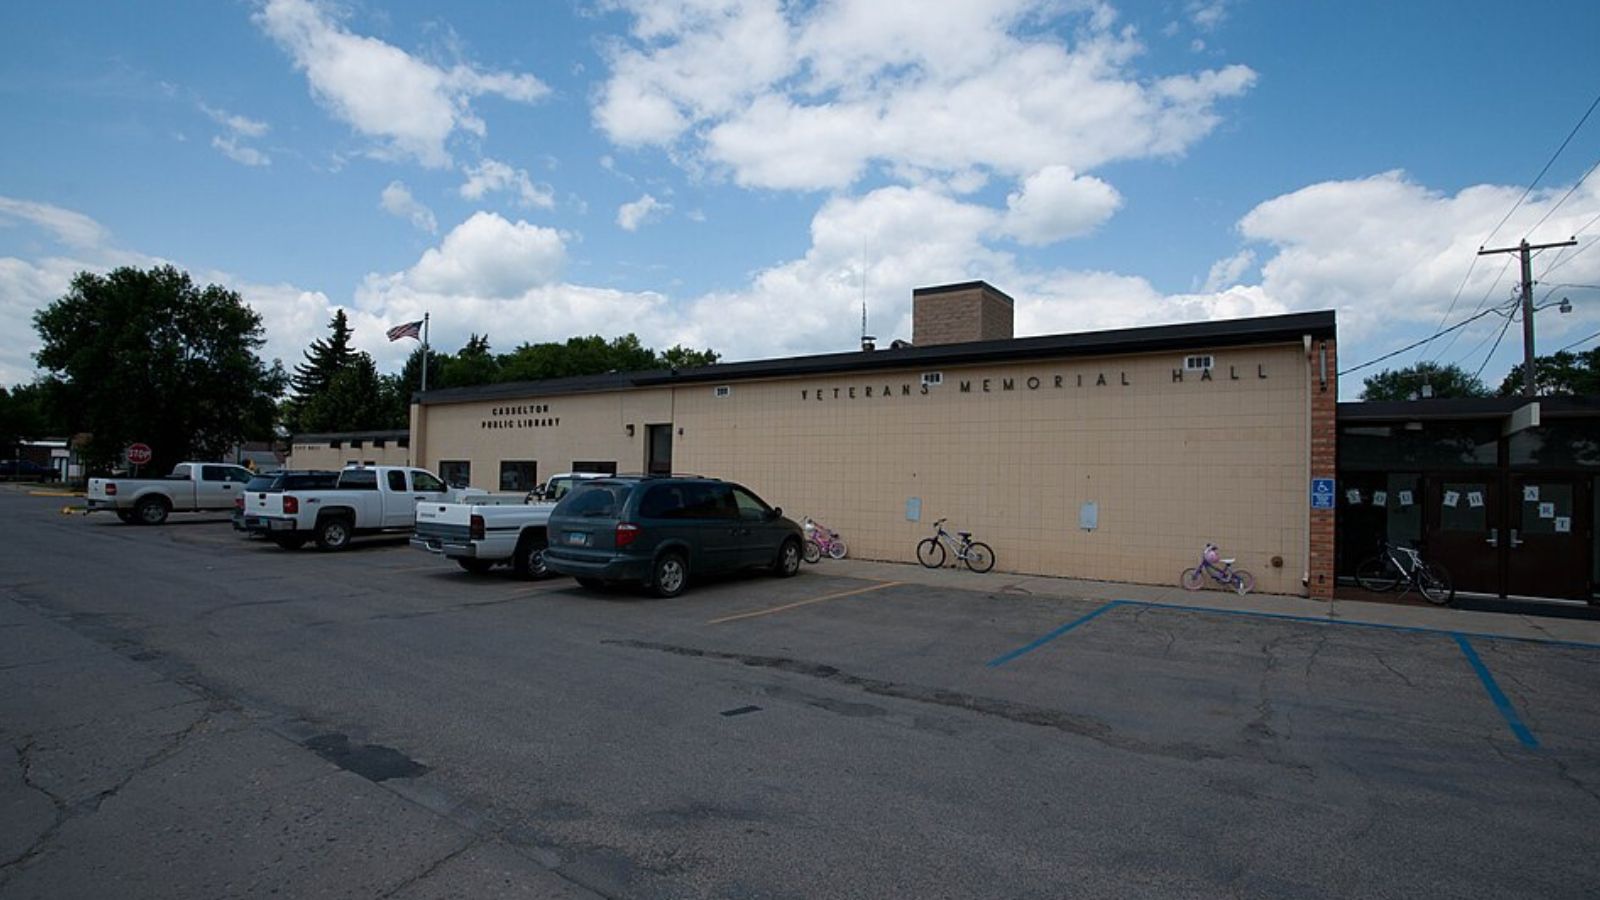
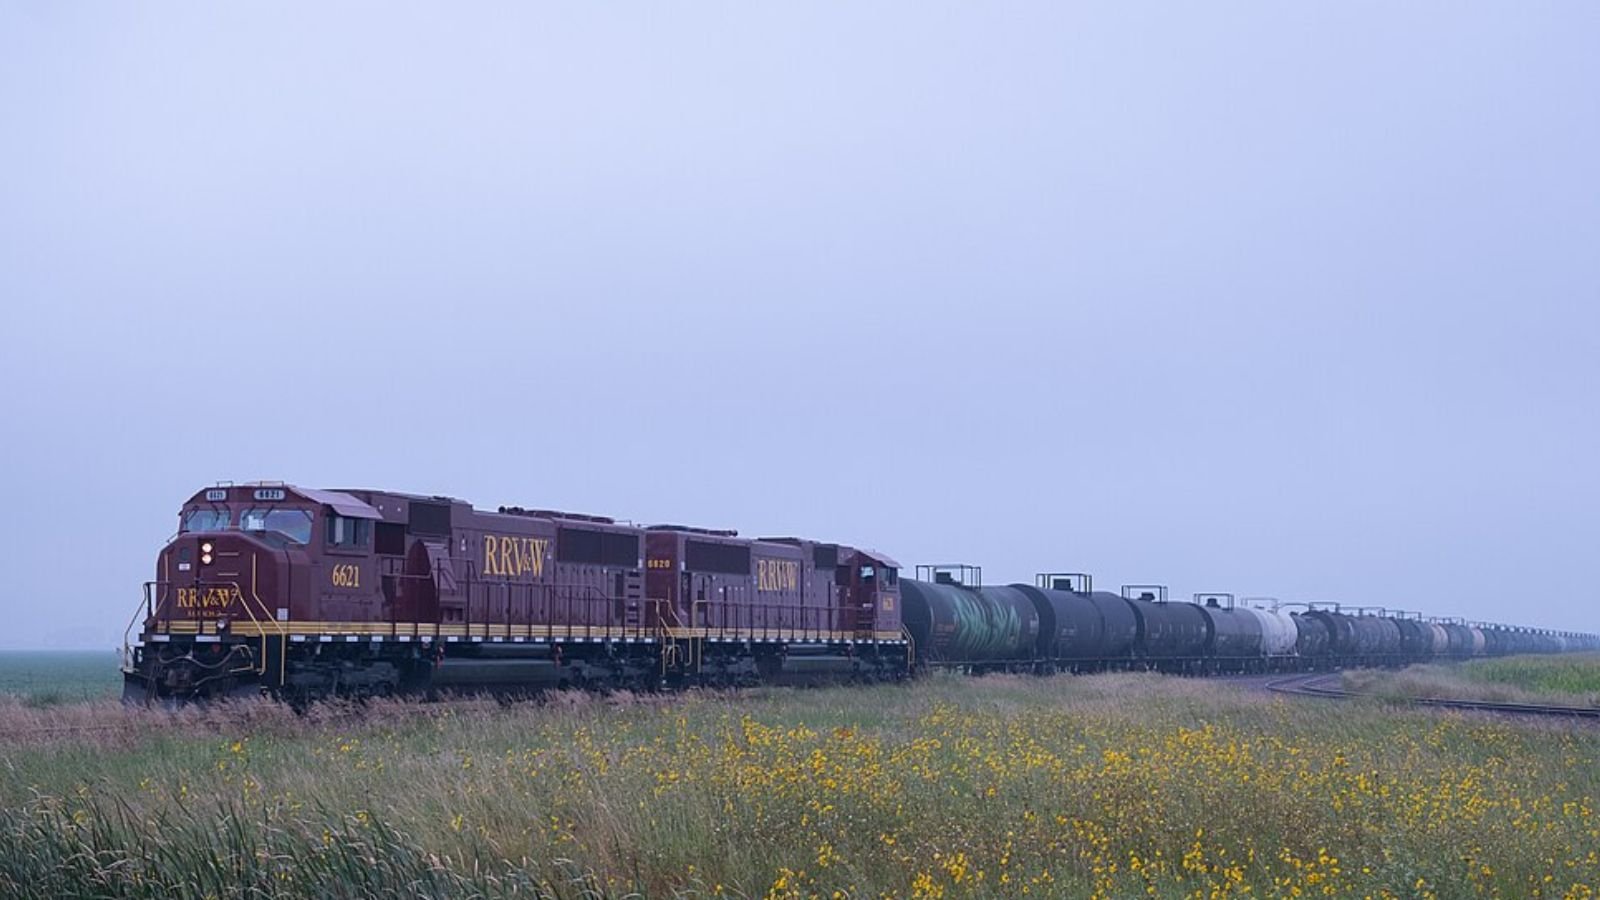
Located just 20 miles west of Fargo in Cass County, Casselton serves as both an agricultural center and an increasingly popular bedroom community for commuters working in the metro area. The city of approximately 2,500 residents sits along the Burlington Northern Santa Fe Railway line, which has historically supported its role as a grain shipping hub for the surrounding farmland. This strategic location provides easy access to Fargo while maintaining the charm and affordability of small-town living.
Price fluctuations during the 2010s reflected broader economic uncertainties in North Dakota, including commodity price swings and oil market volatility that affected the entire state. However, Casselton’s diversified economic base and proximity to Fargo’s stable job market have provided more consistent demand for housing compared to communities more directly tied to energy sector employment.
29. South Heart – 126% Home Price Increase Since 2010
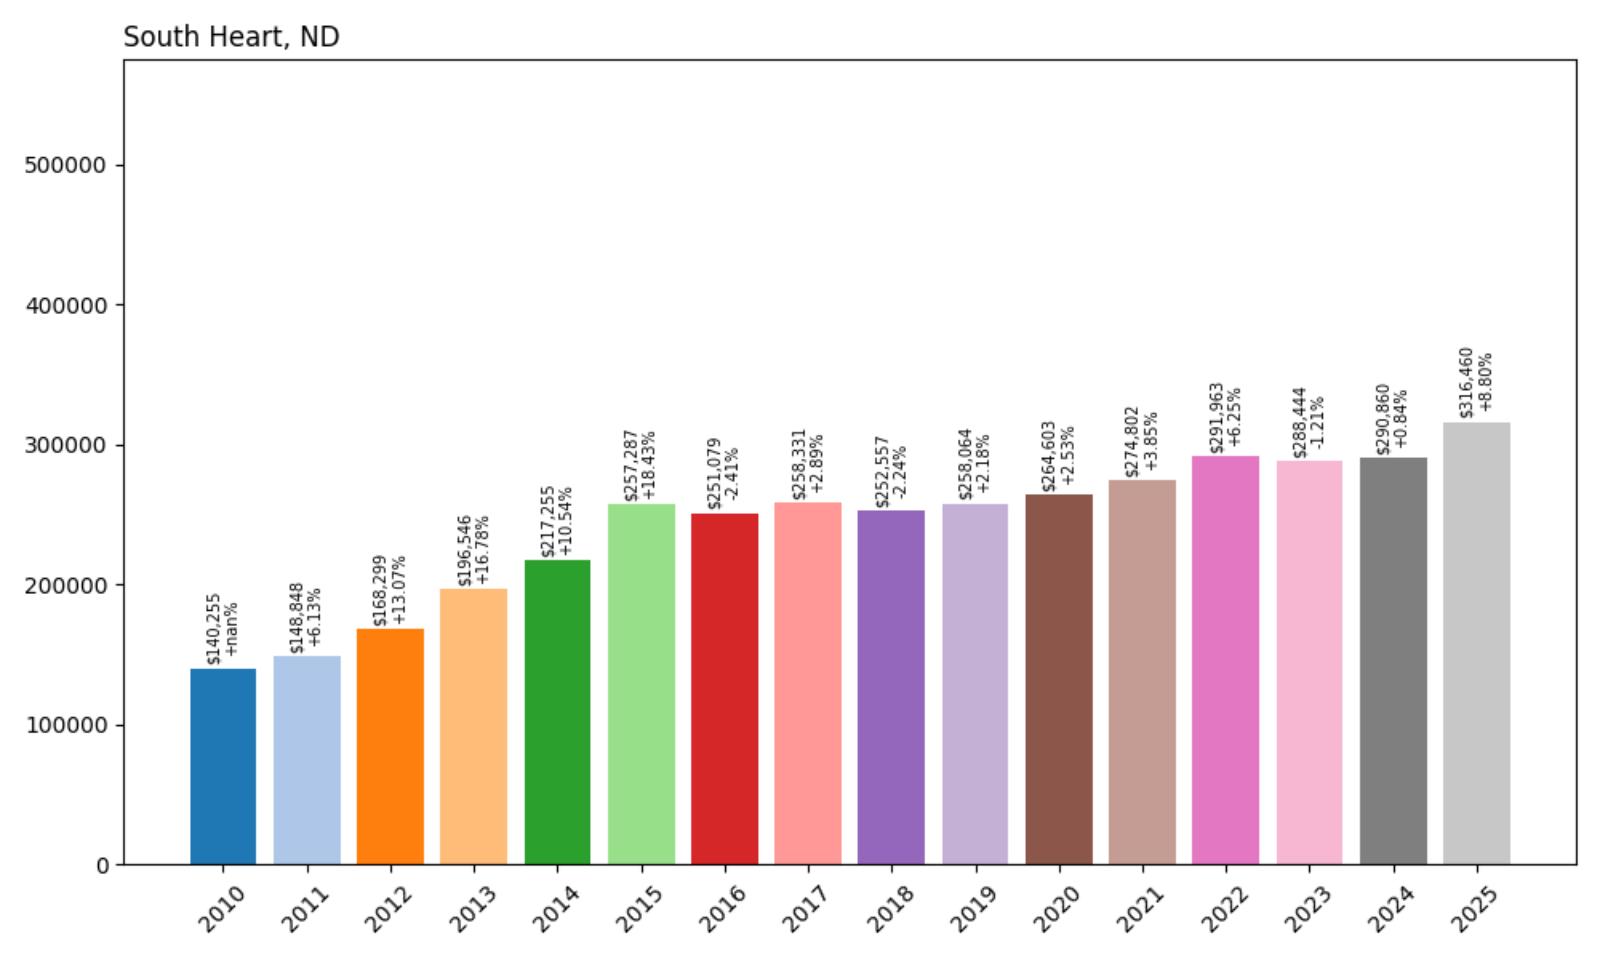
- 2010: $140,255
- 2011: $148,848 (+$8,593, +6.13% from previous year)
- 2012: $168,299 (+$19,451, +13.07% from previous year)
- 2013: $196,546 (+$28,248, +16.78% from previous year)
- 2014: $217,255 (+$20,709, +10.54% from previous year)
- 2015: $257,287 (+$40,031, +18.43% from previous year)
- 2016: $251,079 (−$6,208, −2.41% from previous year)
- 2017: $258,331 (+$7,253, +2.89% from previous year)
- 2018: $252,557 (−$5,775, −2.24% from previous year)
- 2019: $258,064 (+$5,507, +2.18% from previous year)
- 2020: $264,603 (+$6,539, +2.53% from previous year)
- 2021: $274,802 (+$10,198, +3.85% from previous year)
- 2022: $291,963 (+$17,162, +6.25% from previous year)
- 2023: $288,444 (−$3,519, −1.21% from previous year)
- 2024: $290,860 (+$2,416, +0.84% from previous year)
- 2025: $316,460 (+$25,600, +8.80% from previous year)
South Heart experienced one of the most dramatic housing market transformations in western North Dakota, with median home prices more than doubling from $140,255 in 2010 to $316,460 in 2025. The most explosive growth occurred between 2012 and 2015, when prices jumped by over 52% as the Bakken oil boom reached its peak intensity. After some moderation in the late 2010s, the market has shown renewed strength with an 8.8% surge in 2025.
South Heart – Oil Boom Epicenter With Rural Character
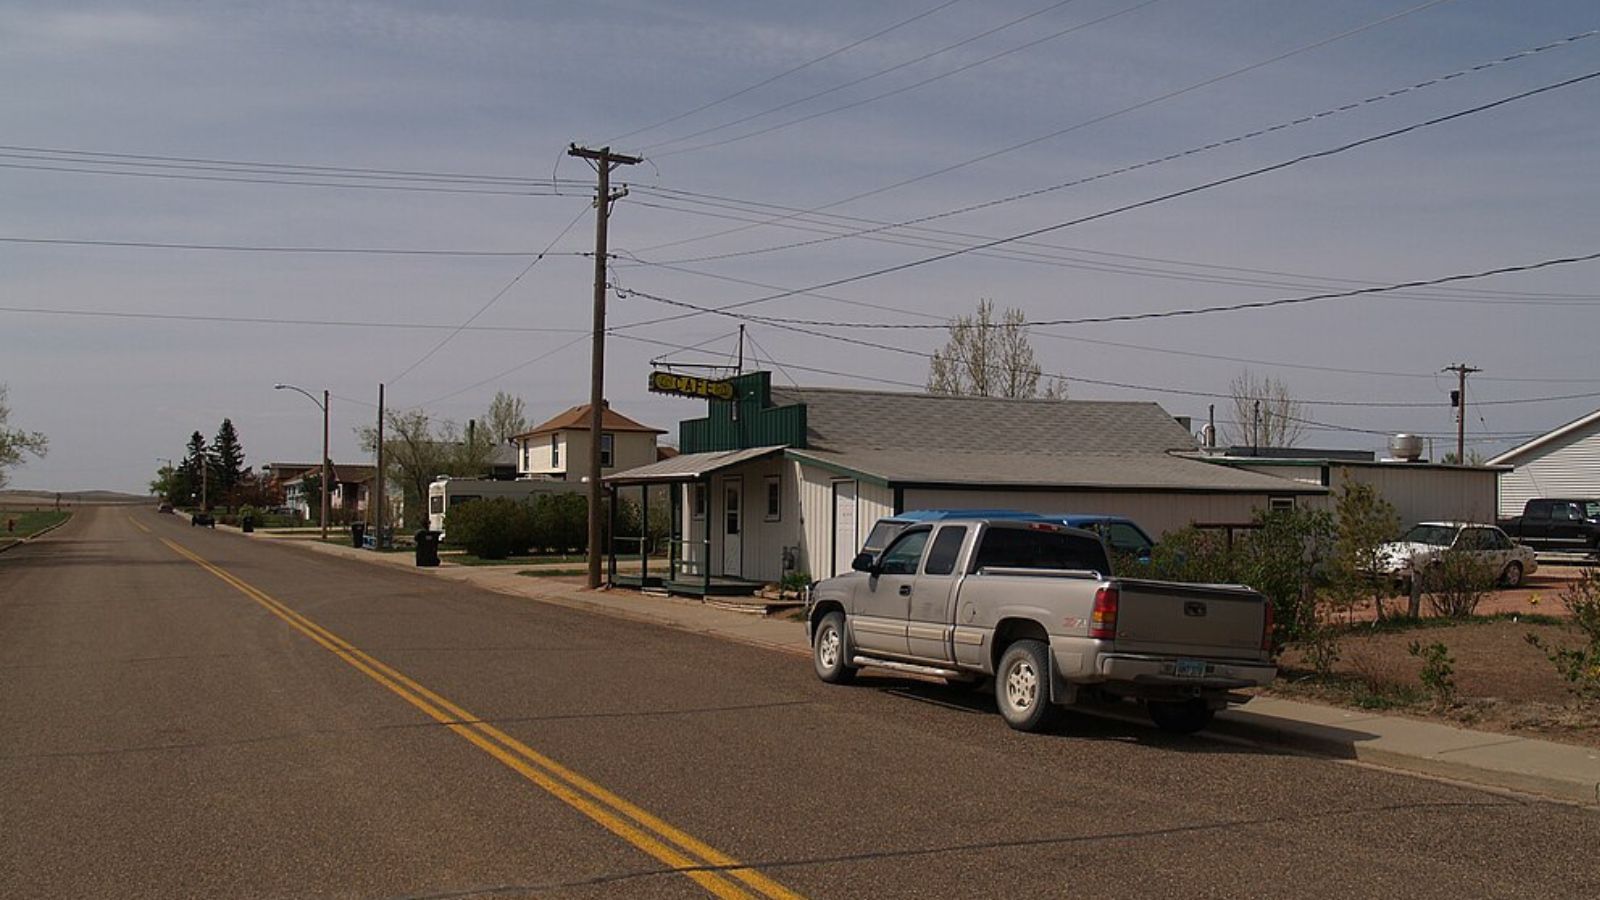
Situated in Hettinger County near the Montana border, South Heart found itself at the center of North Dakota’s oil extraction revolution during the 2010s. This small community of fewer than 400 residents became a crucial service hub for nearby drilling operations, driving unprecedented demand for housing among oil field workers and their families. The town’s location along Highway 10 provided convenient access to major drilling sites while offering more affordable living options compared to larger oil patch cities like Williston.
Today’s market reflects both the maturation of the oil industry and South Heart’s evolution into a more stable community. While oil remains important to the local economy, improved infrastructure and housing development have created a more balanced market. The recent 8.8% price increase suggests continued confidence in the area’s long-term prospects, supported by ongoing energy production and the community’s appeal to those seeking rural living with modern conveniences.
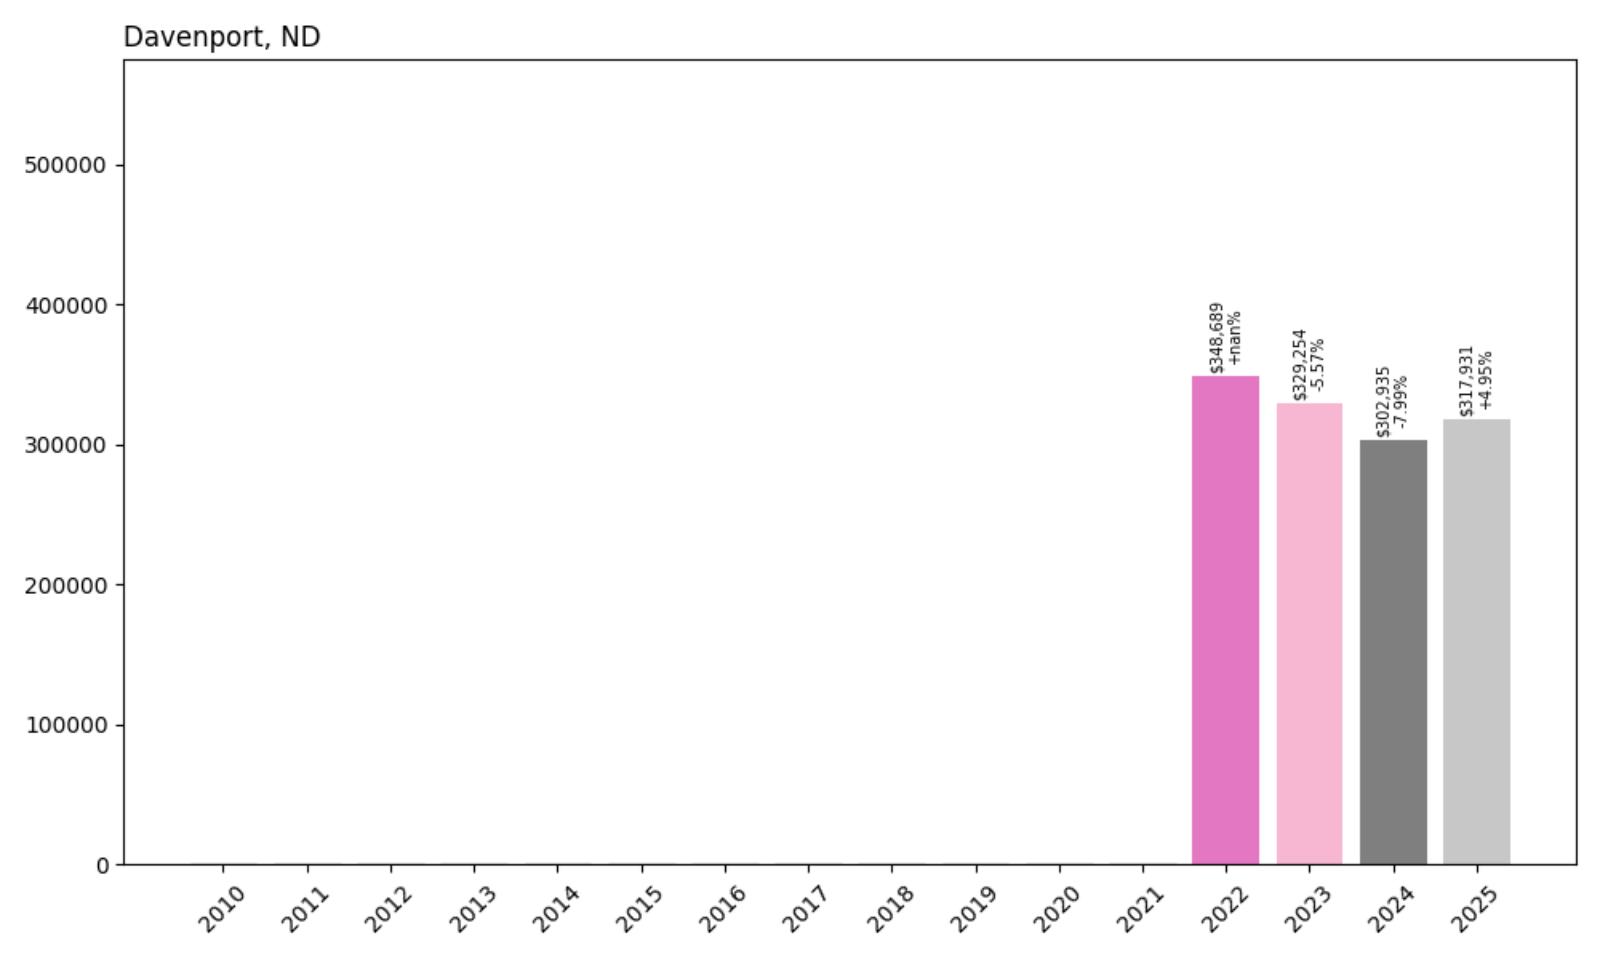
28. Davenport – Price Volatility in Oil Country
- 2010: N/A
- 2011: N/A
- 2012: N/A
- 2013: N/A
- 2014: N/A
- 2015: N/A
- 2016: N/A
- 2017: N/A
- 2018: N/A
- 2019: N/A
- 2020: N/A
- 2021: N/A
- 2022: $348,689
- 2023: $329,254 (−$19,435, −5.57% from previous year)
- 2024: $302,935 (−$26,319, −7.99% from previous year)
- 2025: $317,931 (+$14,996, +4.95% from previous year)
Davenport’s limited housing market data begins in 2022, but the available information reveals significant price volatility over just three years. From a peak of nearly $349,000 in 2022, median home prices dropped by more than 13% over the next two years before recovering with a 5% increase in 2025. This pattern suggests a market still finding its equilibrium after dramatic changes in the local economy.
Davenport – Small Community With Big Market Swings
Located in Cass County in southeastern North Dakota, Davenport represents one of the state’s smallest communities to command premium home prices. With fewer than 200 residents, this tiny agricultural town demonstrates how even rural markets can experience significant price volatility. The lack of historical data prior to 2022 likely reflects limited home sales activity, making recent price movements particularly sensitive to individual transactions and broader regional trends.
Despite its small size, Davenport’s proximity to larger regional centers and its location in productive agricultural lands provide some economic stability. The community’s housing market serves primarily local residents and agricultural workers, making it susceptible to broader trends affecting rural North Dakota. The current median price of nearly $318,000 reflects the general elevation of housing costs throughout the state, even in its smallest communities.
27. Fargo – 69% Home Price Increase Since 2010
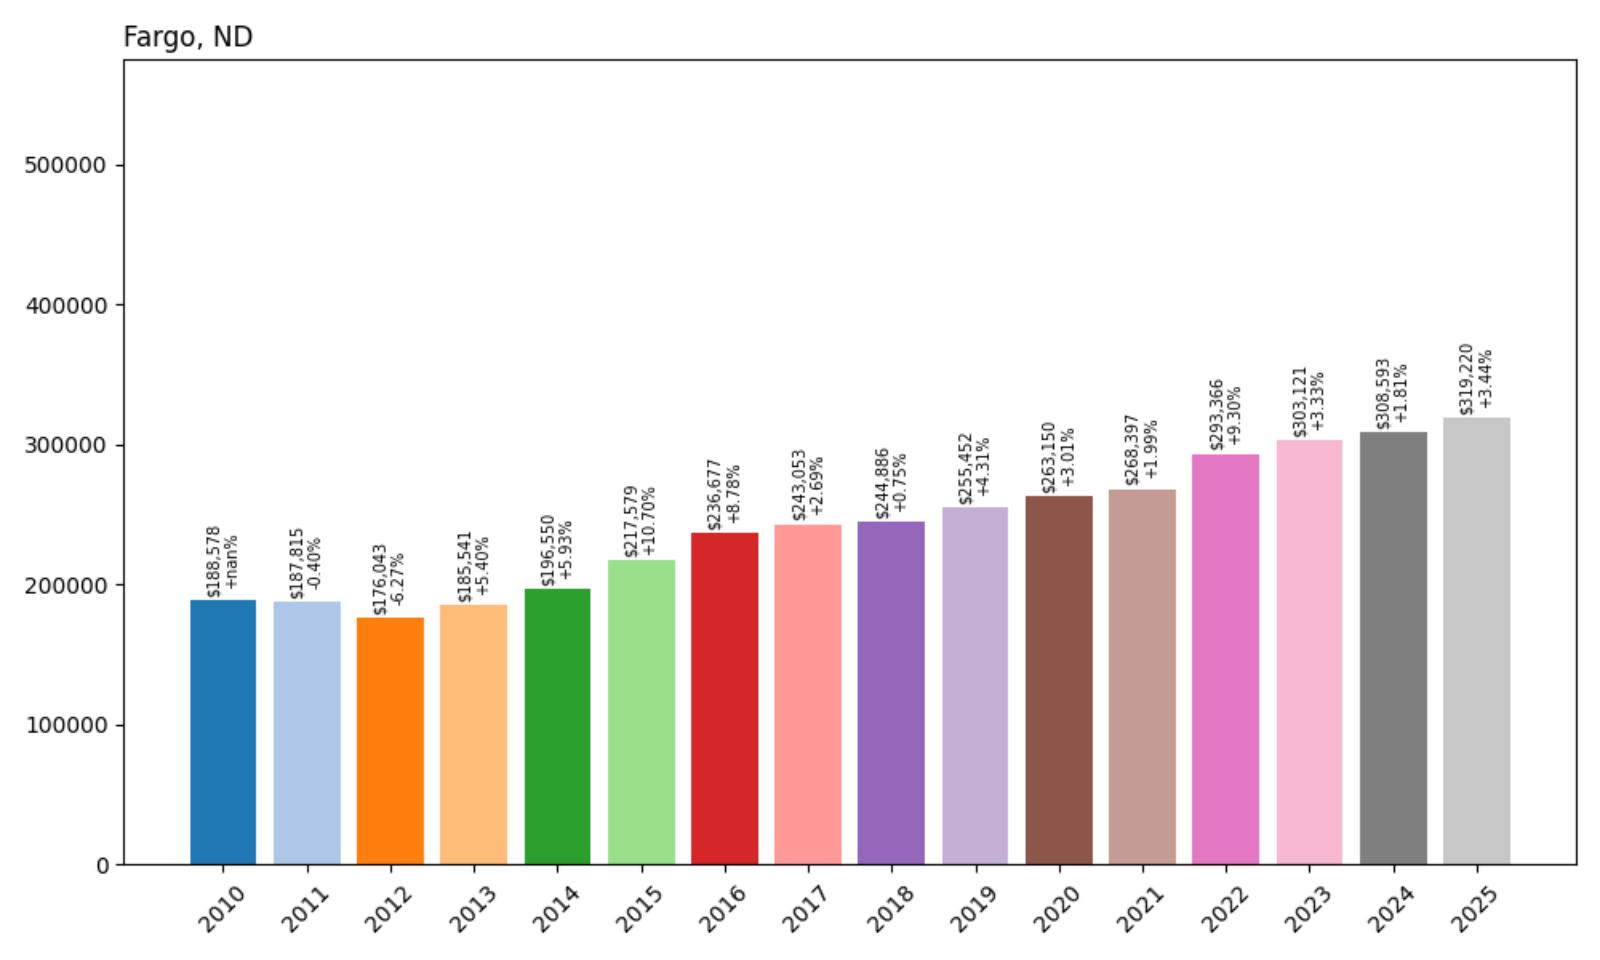
- 2010: $188,578
- 2011: $187,815 (−$763, −0.40% from previous year)
- 2012: $176,043 (−$11,772, −6.27% from previous year)
- 2013: $185,541 (+$9,498, +5.40% from previous year)
- 2014: $196,550 (+$11,010, +5.93% from previous year)
- 2015: $217,579 (+$21,028, +10.70% from previous year)
- 2016: $236,677 (+$19,098, +8.78% from previous year)
- 2017: $243,053 (+$6,376, +2.69% from previous year)
- 2018: $244,886 (+$1,833, +0.75% from previous year)
- 2019: $255,452 (+$10,566, +4.31% from previous year)
- 2020: $263,150 (+$7,698, +3.01% from previous year)
- 2021: $268,397 (+$5,247, +1.99% from previous year)
- 2022: $293,366 (+$24,969, +9.30% from previous year)
- 2023: $303,121 (+$9,755, +3.33% from previous year)
- 2024: $308,593 (+$5,472, +1.81% from previous year)
- 2025: $319,220 (+$10,627, +3.44% from previous year)
As North Dakota’s largest city, Fargo has maintained relatively steady home price appreciation over the past 15 years, with the current median of $319,220 representing a 69% increase since 2010. The market experienced some early volatility, including a 6% decline in 2012, but has shown consistent growth since then. The strongest appreciation occurred during 2015-2016 and again in 2022, with the market continuing to advance at a measured pace through 2025.
Fargo – Economic Powerhouse Driving Steady Housing Demand
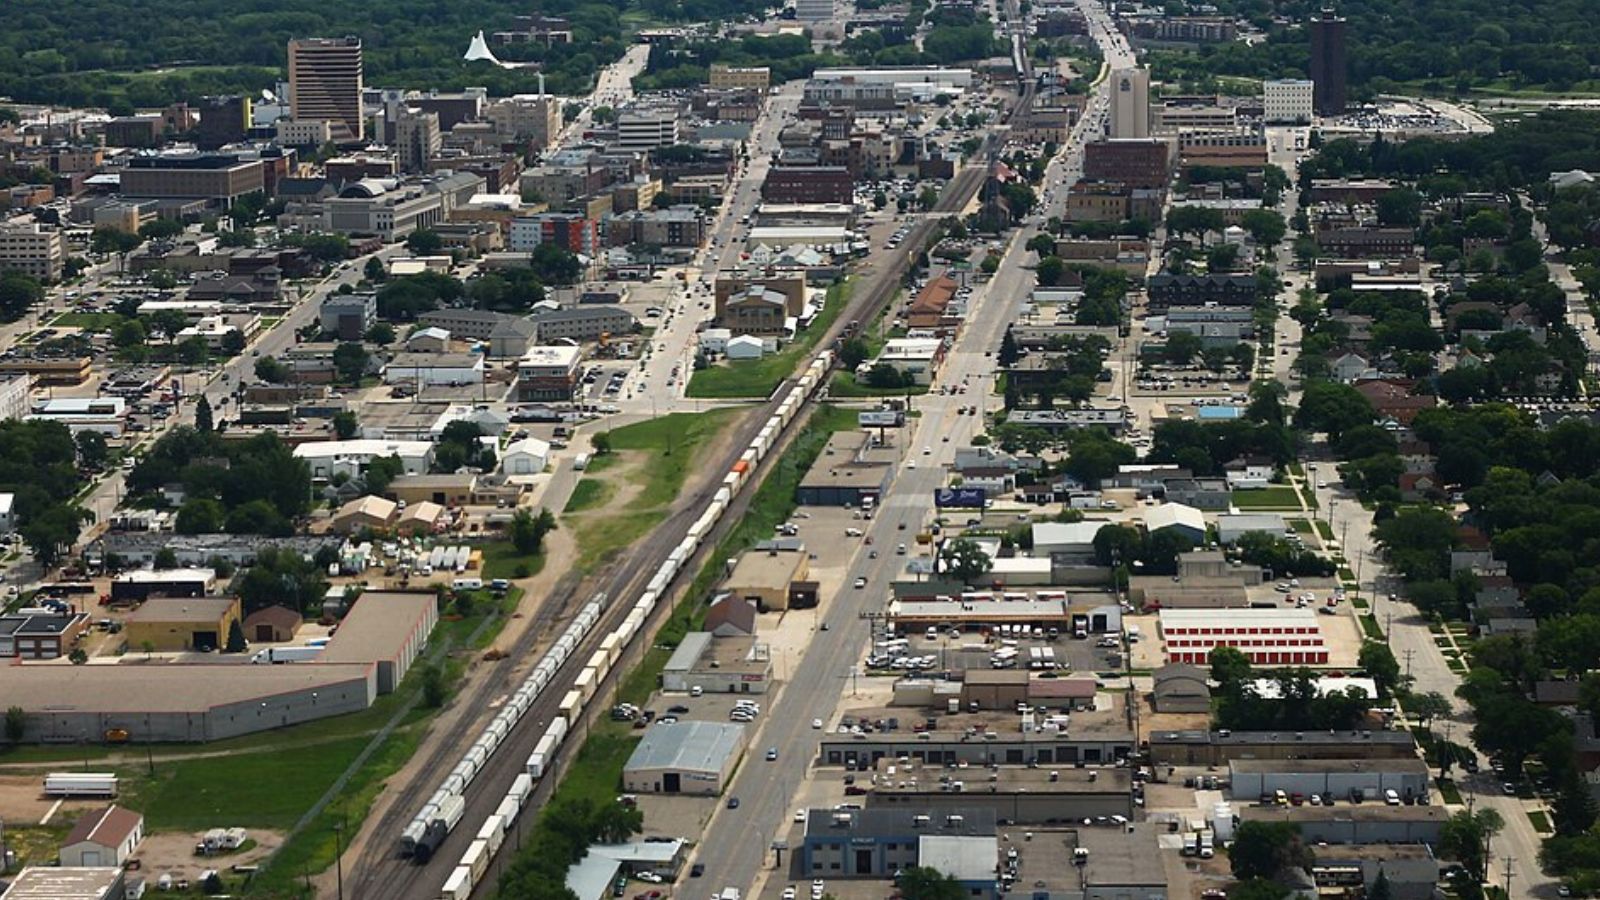
Fargo serves as eastern North Dakota’s economic and cultural center, home to North Dakota State University and a diverse array of industries including healthcare, technology, and agriculture. With a metropolitan population exceeding 240,000, the city benefits from economic stability that many smaller North Dakota communities lack. This diversified economic base has supported consistent housing demand even during periods when oil-dependent regions experienced significant volatility.
Recent price growth has been more moderate compared to oil boom towns, reflecting a mature market with adequate housing supply and steady but not explosive population growth. Fargo’s housing market benefits from new construction activity and planned development that helps accommodate demand without the extreme price spikes seen in supply-constrained communities. The consistent upward trend in home values demonstrates the city’s appeal as both a place to live and a stable real estate investment.
26. Dickinson – 77% Home Price Increase Since 2010
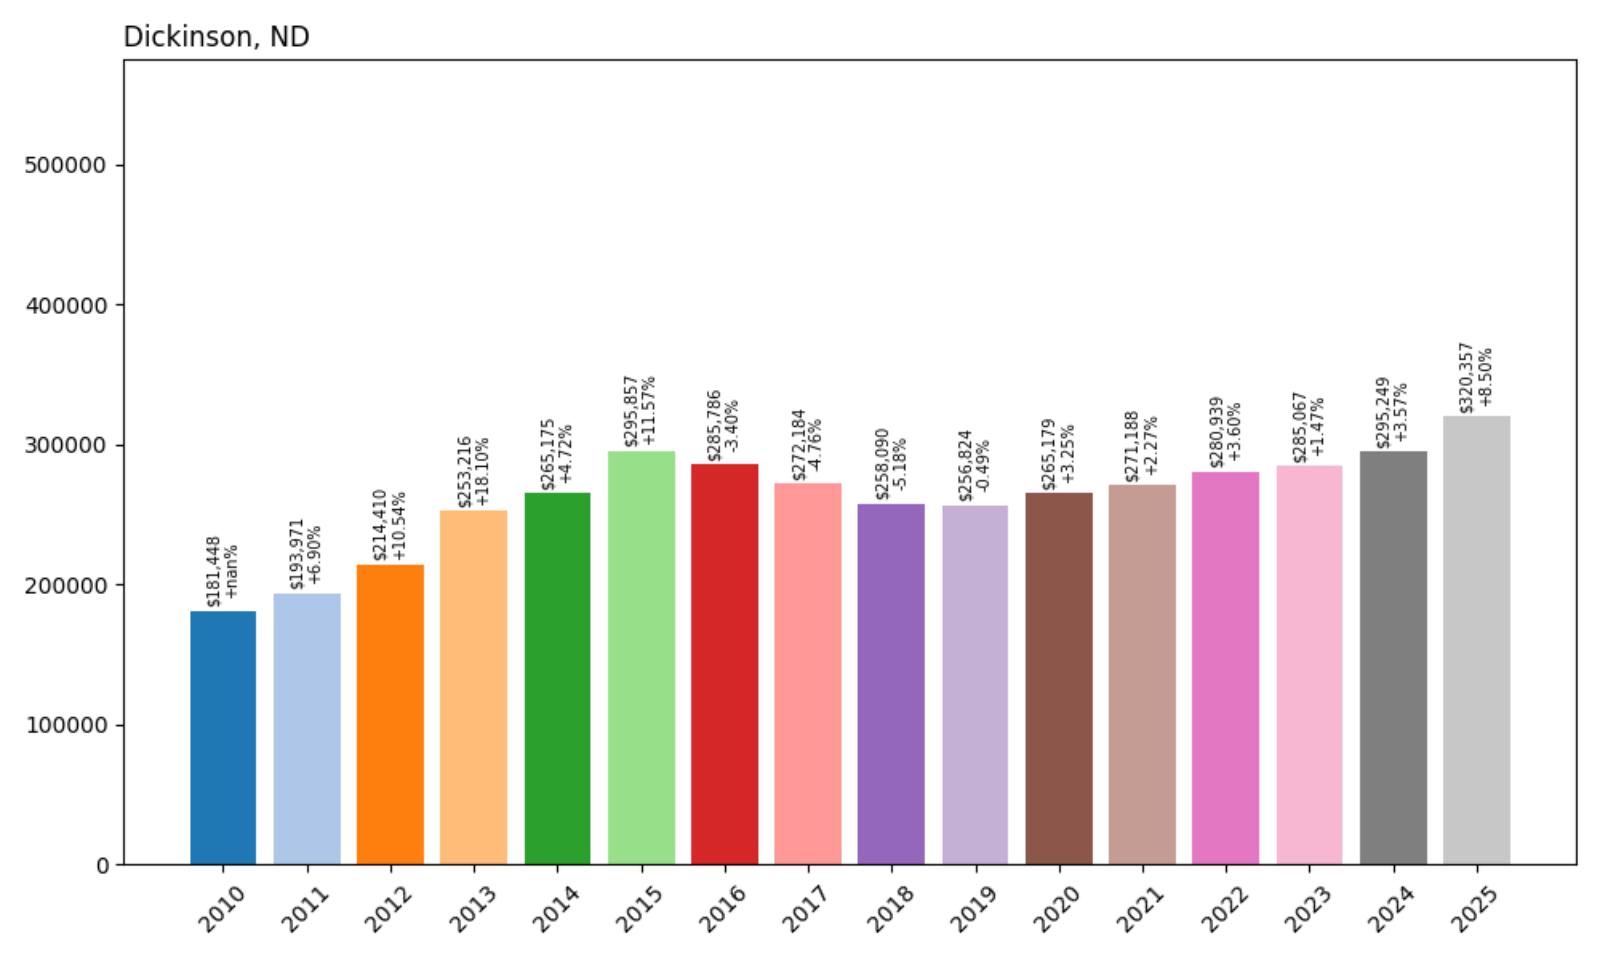
- 2010: $181,448
- 2011: $193,971 (+$12,523, +6.90% from previous year)
- 2012: $214,410 (+$20,438, +10.54% from previous year)
- 2013: $253,216 (+$38,806, +18.10% from previous year)
- 2014: $265,175 (+$11,959, +4.72% from previous year)
- 2015: $295,857 (+$30,682, +11.57% from previous year)
- 2016: $285,786 (−$10,071, −3.40% from previous year)
- 2017: $272,184 (−$13,602, −4.76% from previous year)
- 2018: $258,090 (−$14,093, −5.18% from previous year)
- 2019: $256,824 (−$1,266, −0.49% from previous year)
- 2020: $265,179 (+$8,355, +3.25% from previous year)
- 2021: $271,188 (+$6,009, +2.27% from previous year)
- 2022: $280,939 (+$9,752, +3.60% from previous year)
- 2023: $285,067 (+$4,128, +1.47% from previous year)
- 2024: $295,249 (+$10,182, +3.57% from previous year)
- 2025: $320,357 (+$25,108, +8.50% from previous year)
Dickinson’s housing market tells the classic story of North Dakota’s oil boom and aftermath, with dramatic growth from 2011-2015 followed by a significant correction and recent recovery. The current median price of $320,357 represents a 77% increase from 2010, but this growth included a peak near $296,000 in 2015 and a subsequent decline that lasted through 2019. The strong 8.5% gain in 2025 suggests renewed confidence in this southwestern North Dakota hub.
Dickinson – Oil Hub Experiencing Market Renaissance
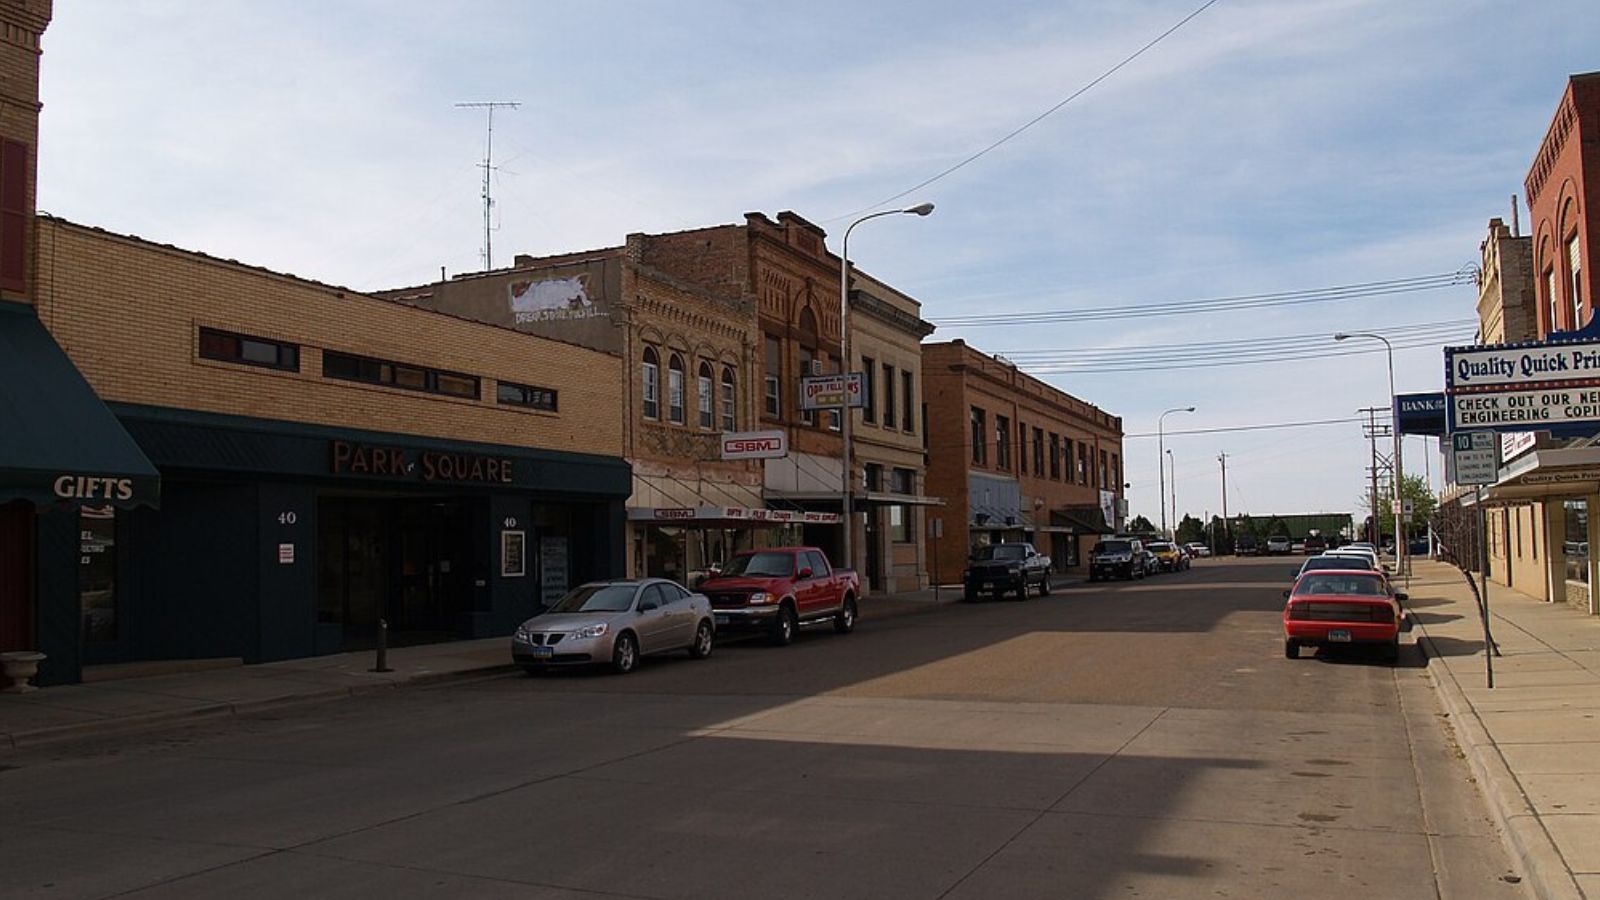
Located in the heart of the Bakken formation, Dickinson became synonymous with North Dakota’s oil boom as drilling activity transformed this traditional agricultural community into a major energy center. The city of approximately 25,000 residents serves as a regional hub for oil field services, transportation, and support industries. Dickinson’s location at the intersection of Interstate 94 and Highway 22 makes it a strategic logistics center for the western oil fields.
The housing market’s rollercoaster ride from 2010-2020 reflected the boom-bust cycle that characterized much of western North Dakota during the oil rush. Explosive growth during the early 2010s, including an 18% spike in 2013, gave way to a prolonged correction as oil prices declined and drilling activity moderated. The market bottomed out in 2019 before beginning a steady recovery that has accelerated recently. The recent 8.5% price increase reflects growing confidence that Dickinson has successfully transitioned from boom town to sustainable community.
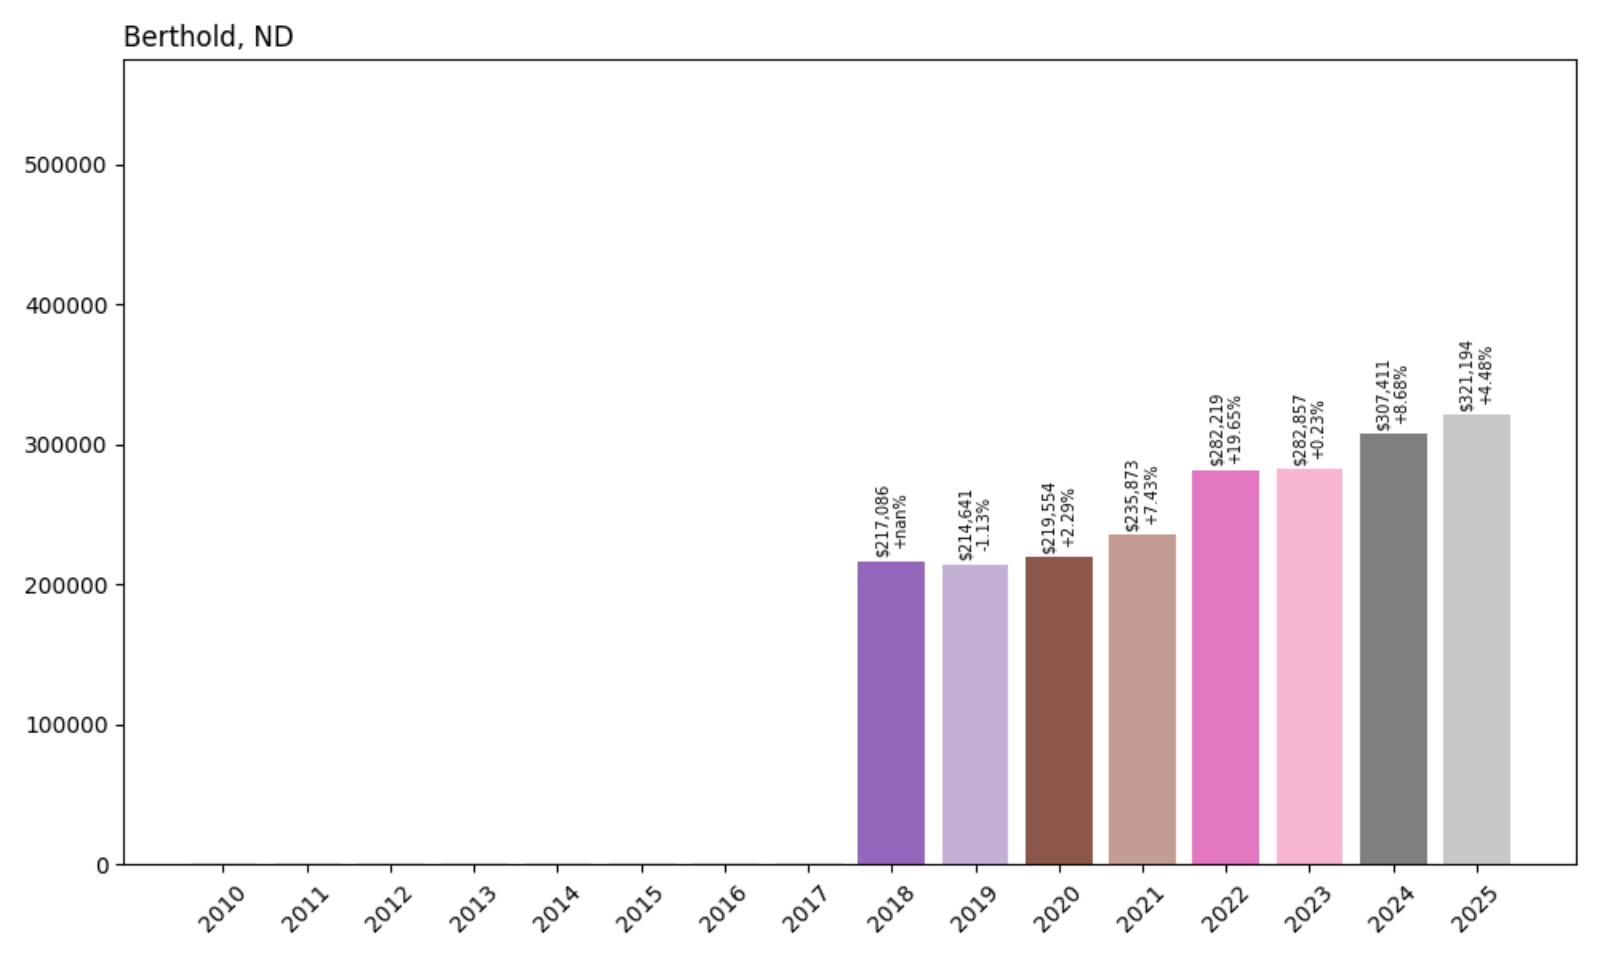
25. Berthold – 48% Home Price Increase Since 2018
- 2010: N/A
- 2011: N/A
- 2012: N/A
- 2013: N/A
- 2014: N/A
- 2015: N/A
- 2016: N/A
- 2017: N/A
- 2018: $217,086
- 2019: $214,641 (−$2,445, −1.13% from previous year)
- 2020: $219,554 (+$4,913, +2.29% from previous year)
- 2021: $235,873 (+$16,320, +7.43% from previous year)
- 2022: $282,219 (+$46,345, +19.65% from previous year)
- 2023: $282,857 (+$639, +0.23% from previous year)
- 2024: $307,411 (+$24,554, +8.68% from previous year)
- 2025: $321,194 (+$13,782, +4.48% from previous year)
Berthold’s housing market shows remarkable growth in recent years, with median home prices climbing 48% since 2018 to reach $321,194 in 2025. The most dramatic increase occurred in 2022 with a stunning 19.65% jump, followed by continued strong appreciation. This small community’s price trajectory reflects the delayed but significant impact of oil industry development in north-central North Dakota.
Berthold – Small Town Benefits From Energy Sector Growth
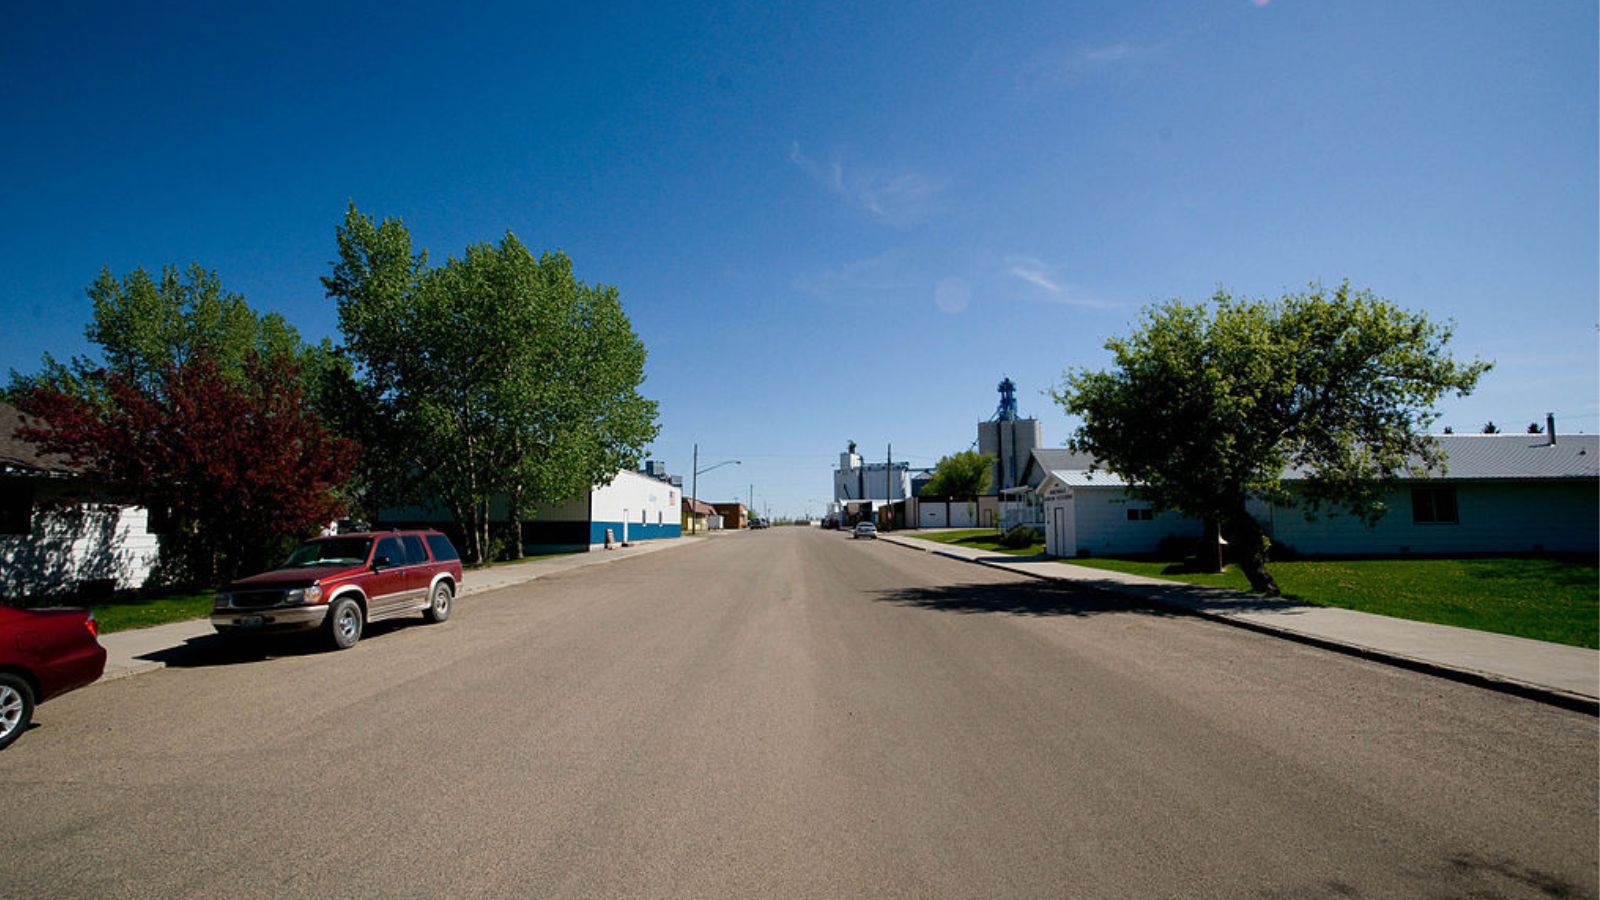
Located in Ward County approximately 35 miles north of Minot, Berthold is a small agricultural community that has experienced significant changes due to its proximity to oil and gas development. With fewer than 500 residents, this rural town provides affordable access to both traditional farming opportunities and energy sector employment. The community sits along Highway 52, offering convenient access to Minot’s services while maintaining a quiet, rural atmosphere.
The housing market’s explosive growth beginning in 2021 coincided with renewed oil field activity and infrastructure development in the region. The 19.65% price spike in 2022 likely reflected both increased demand from energy workers and limited housing supply typical of small rural communities. Berthold’s location makes it attractive to those seeking lower living costs while working in nearby oil fields or Minot’s diverse economy.
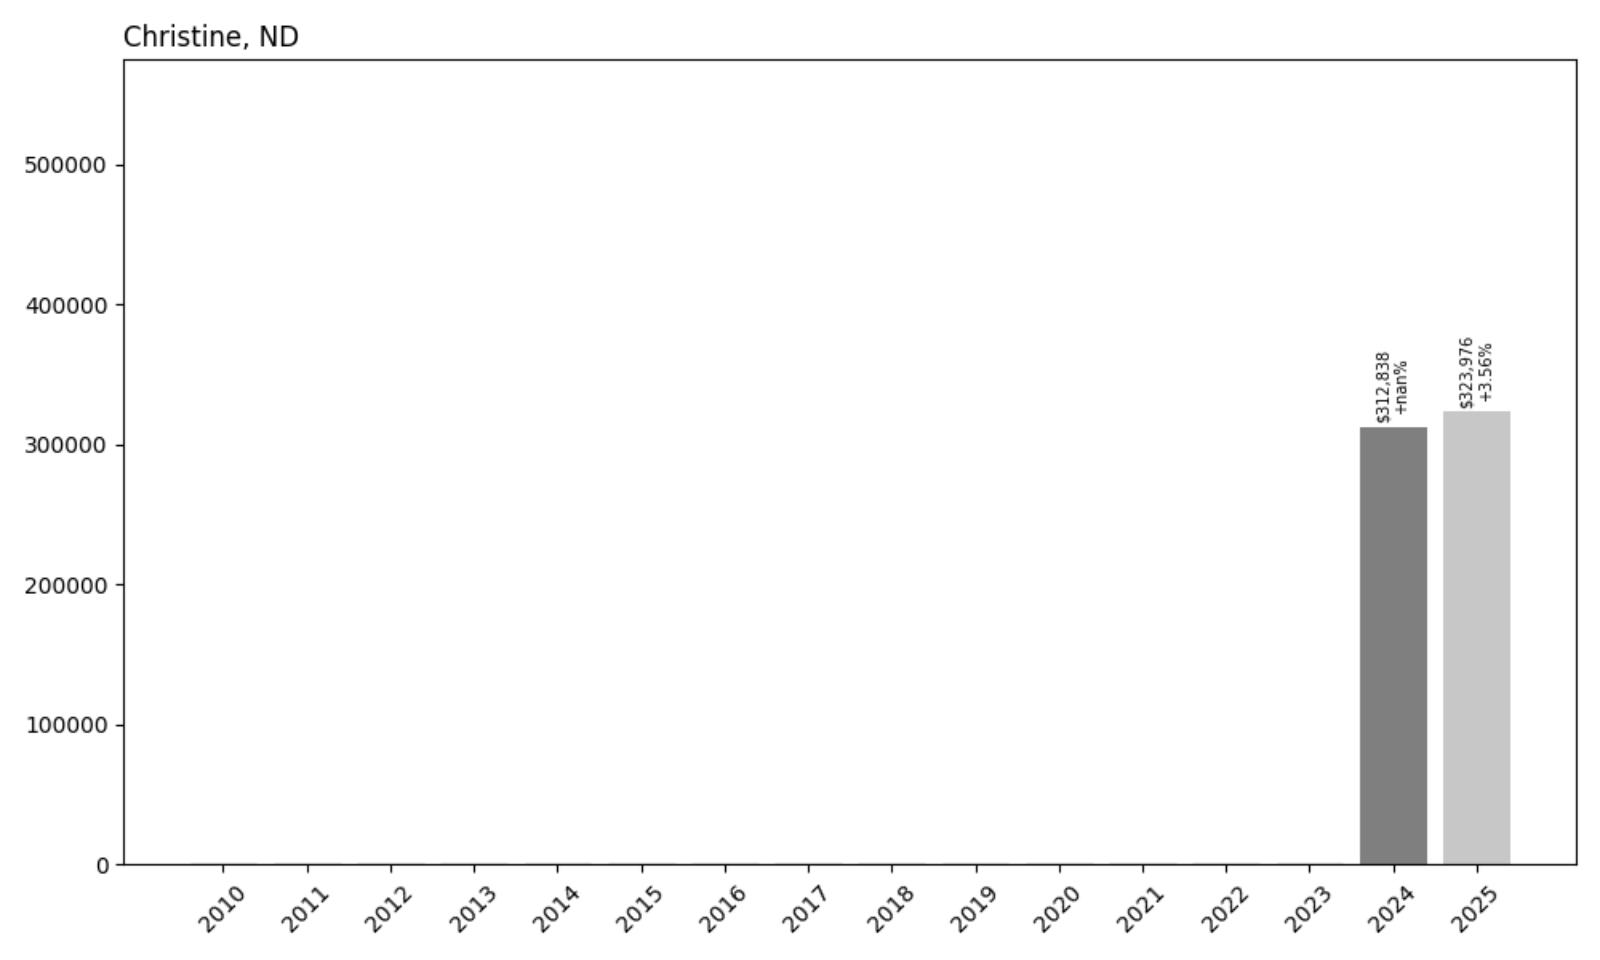
24. Christine – Recent Market Entry
- 2010: N/A
- 2011: N/A
- 2012: N/A
- 2013: N/A
- 2014: N/A
- 2015: N/A
- 2016: N/A
- 2017: N/A
- 2018: N/A
- 2019: N/A
- 2020: N/A
- 2021: N/A
- 2022: N/A
- 2023: N/A
- 2024: $312,838
- 2025: $323,976 (+$11,138, +3.56% from previous year)
Christine’s housing market data begins only in 2024, making it difficult to assess long-term trends. However, the median home price of $323,976 in 2025 represents a solid 3.56% increase from the previous year. This pricing level places the small Richland County community among North Dakota’s more expensive markets despite its rural location.
Christine – Small Community Commands Premium Prices
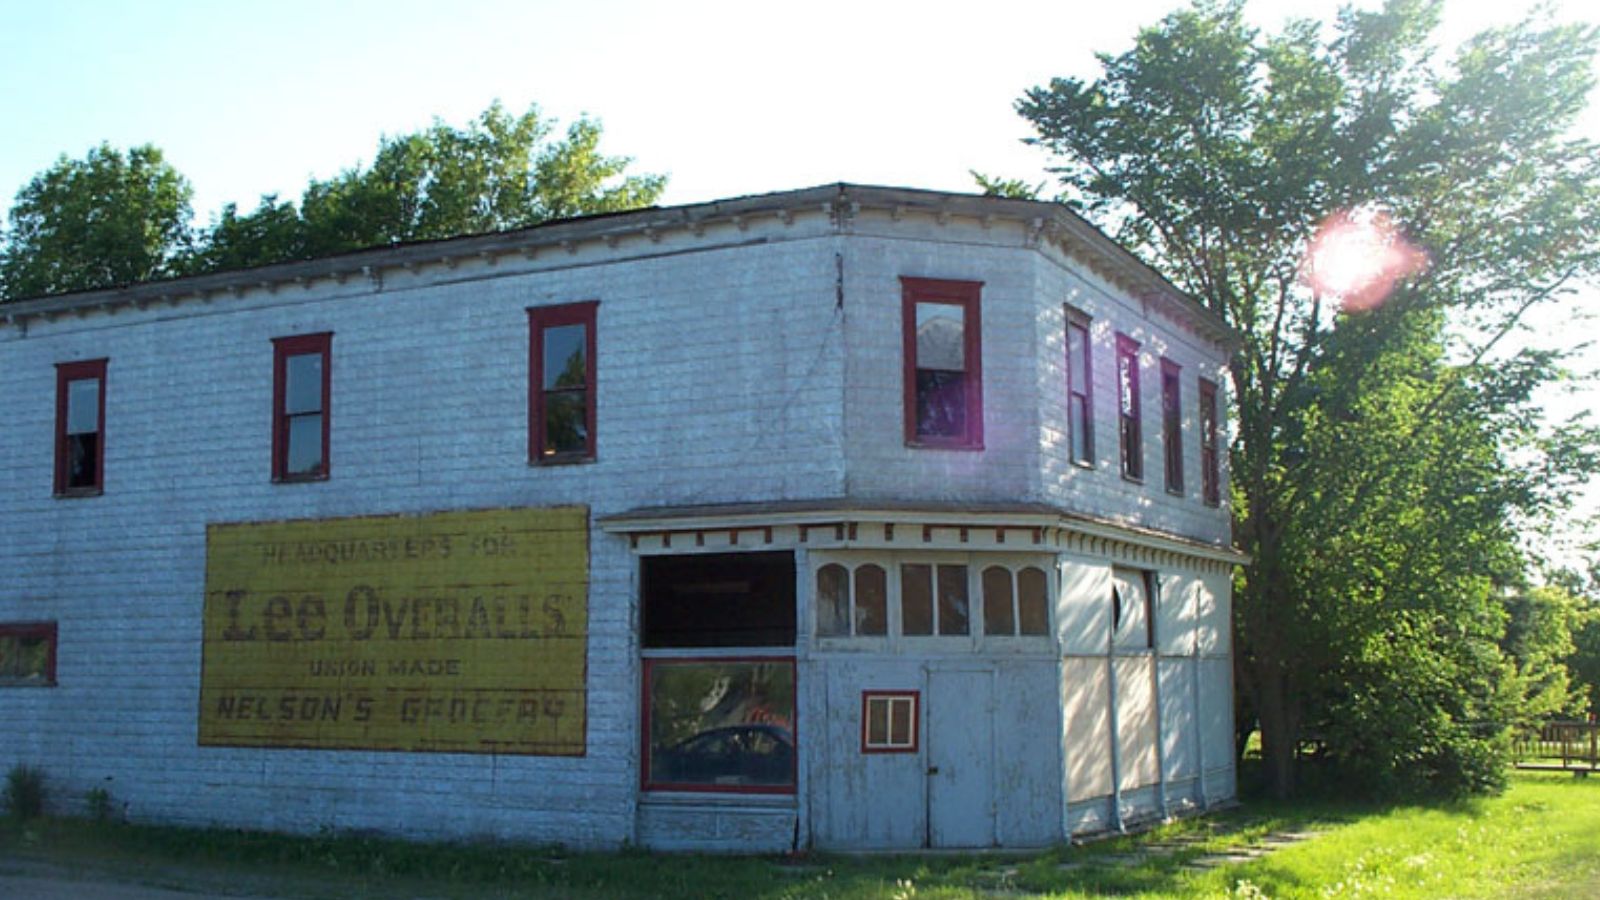
Located in southeastern North Dakota’s Richland County, Christine is a tiny agricultural community with fewer than 150 residents. Despite its small size, the town’s median home price approaching $324,000 reflects broader trends affecting rural North Dakota real estate markets. The community sits in some of the state’s most productive agricultural land, which may contribute to property values and local economic stability.
The lack of historical pricing data suggests limited home sales activity, which is typical for communities of Christine’s size. When sales do occur in such small markets, individual transactions can significantly impact median price calculations. The recent 3.56% price increase indicates some level of demand despite the limited market size, possibly driven by the area’s agricultural prosperity and proximity to larger regional centers.
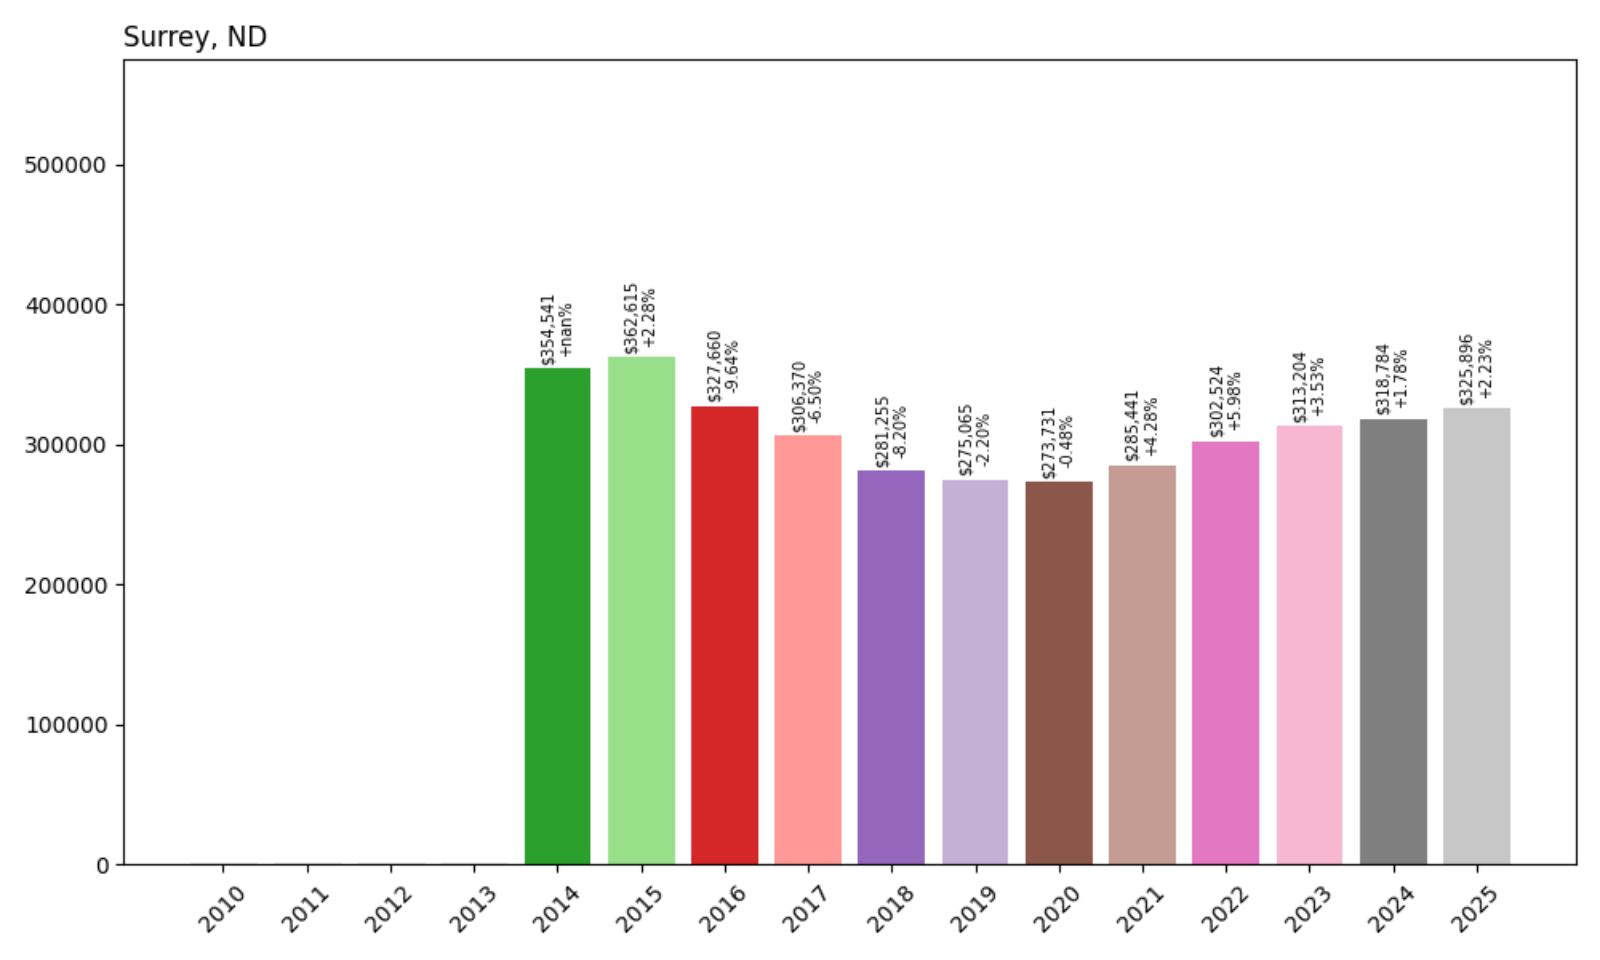
23. Surrey – Oil Boom Recovery Story
- 2010: N/A
- 2011: N/A
- 2012: N/A
- 2013: N/A
- 2014: $354,541
- 2015: $362,615 (+$8,074, +2.28% from previous year)
- 2016: $327,660 (−$34,955, −9.64% from previous year)
- 2017: $306,370 (−$21,290, −6.50% from previous year)
- 2018: $281,255 (−$25,115, −8.20% from previous year)
- 2019: $275,065 (−$6,190, −2.20% from previous year)
- 2020: $273,731 (−$1,334, −0.48% from previous year)
- 2021: $285,441 (+$11,710, +4.28% from previous year)
- 2022: $302,524 (+$17,083, +5.98% from previous year)
- 2023: $313,204 (+$10,679, +3.53% from previous year)
- 2024: $318,784 (+$5,580, +1.78% from previous year)
- 2025: $325,896 (+$7,112, +2.23% from previous year)
Surrey’s housing market demonstrates the boom-bust-recovery cycle that characterized many oil-dependent North Dakota communities. From a peak of $362,615 in 2015, prices declined steadily through 2020, losing nearly 25% of their value. However, the market has recovered strongly since 2021, with the current median of $325,896 approaching the previous peak levels.
Surrey – Energy Hub Finding New Stability
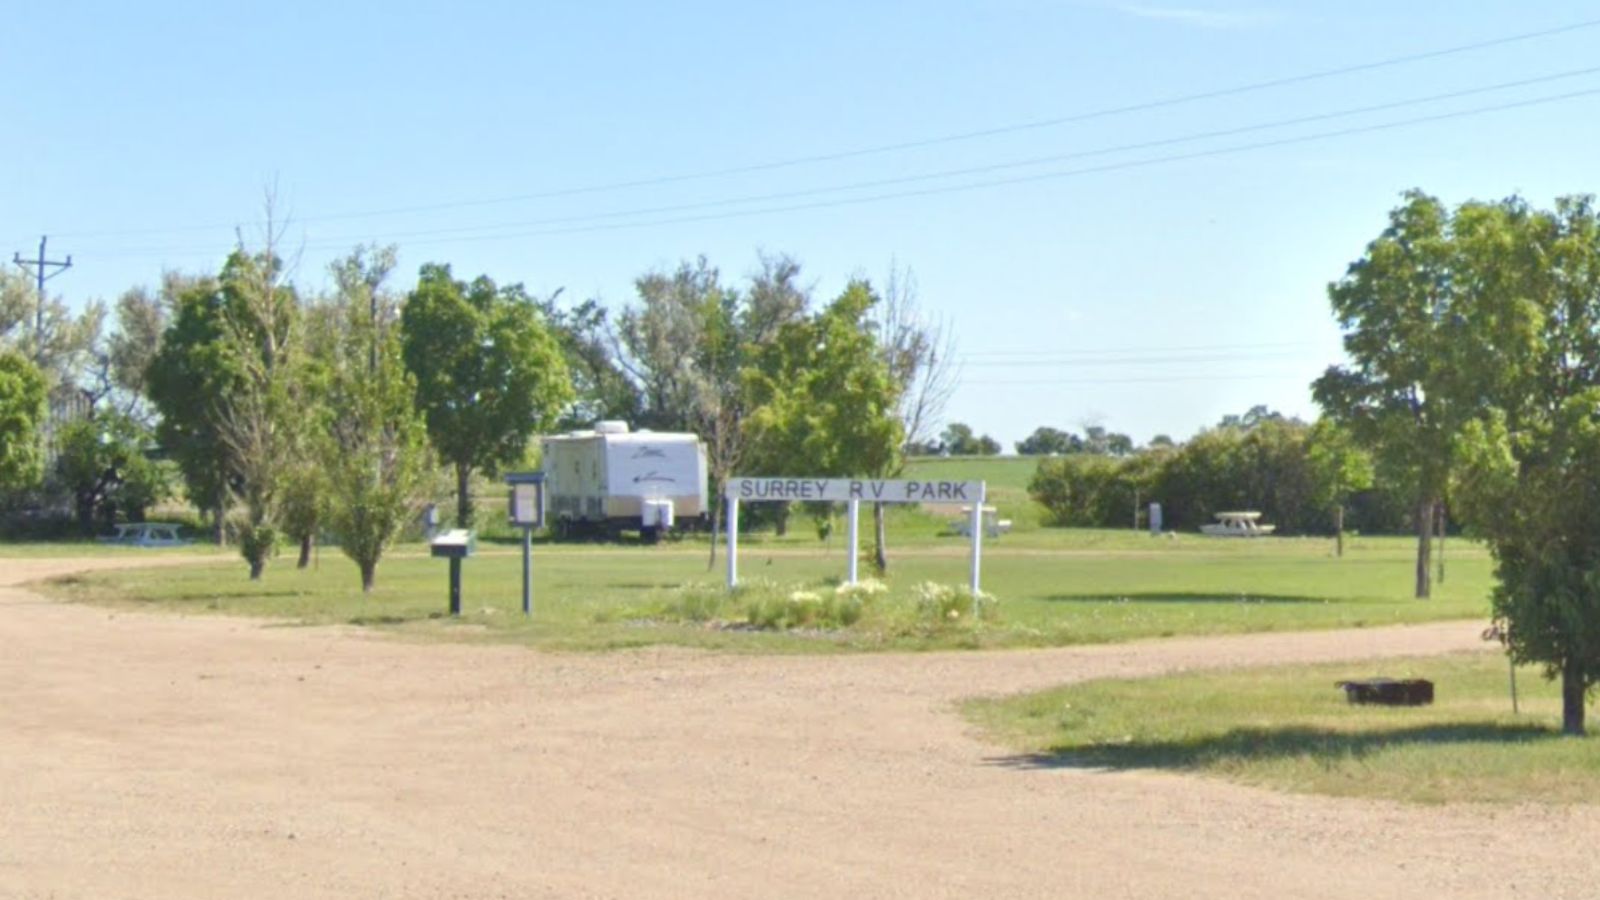
Located in Ward County near the center of North Dakota’s oil-producing region, Surrey experienced dramatic changes during the Bakken boom years. This small community of approximately 1,000 residents found itself strategically positioned near major drilling operations, driving unprecedented demand for housing from oil field workers and support personnel. The town’s location along Highway 2 provided convenient access to drilling sites while offering more affordable living options than larger oil patch cities.
The housing market’s sharp decline from 2016-2020 reflected the broader cooling of oil field activity as commodity prices fell and drilling technology improved efficiency. Many temporary workers left the region, reducing housing demand and putting downward pressure on home prices. Surrey’s nearly 25% price decline during this period was typical of communities that had experienced the most dramatic boom-era appreciation.
22. Gladstone – Strong Recent Growth
- 2010: N/A
- 2011: N/A
- 2012: N/A
- 2013: N/A
- 2014: N/A
- 2015: N/A
- 2016: N/A
- 2017: N/A
- 2018: N/A
- 2019: N/A
- 2020: N/A
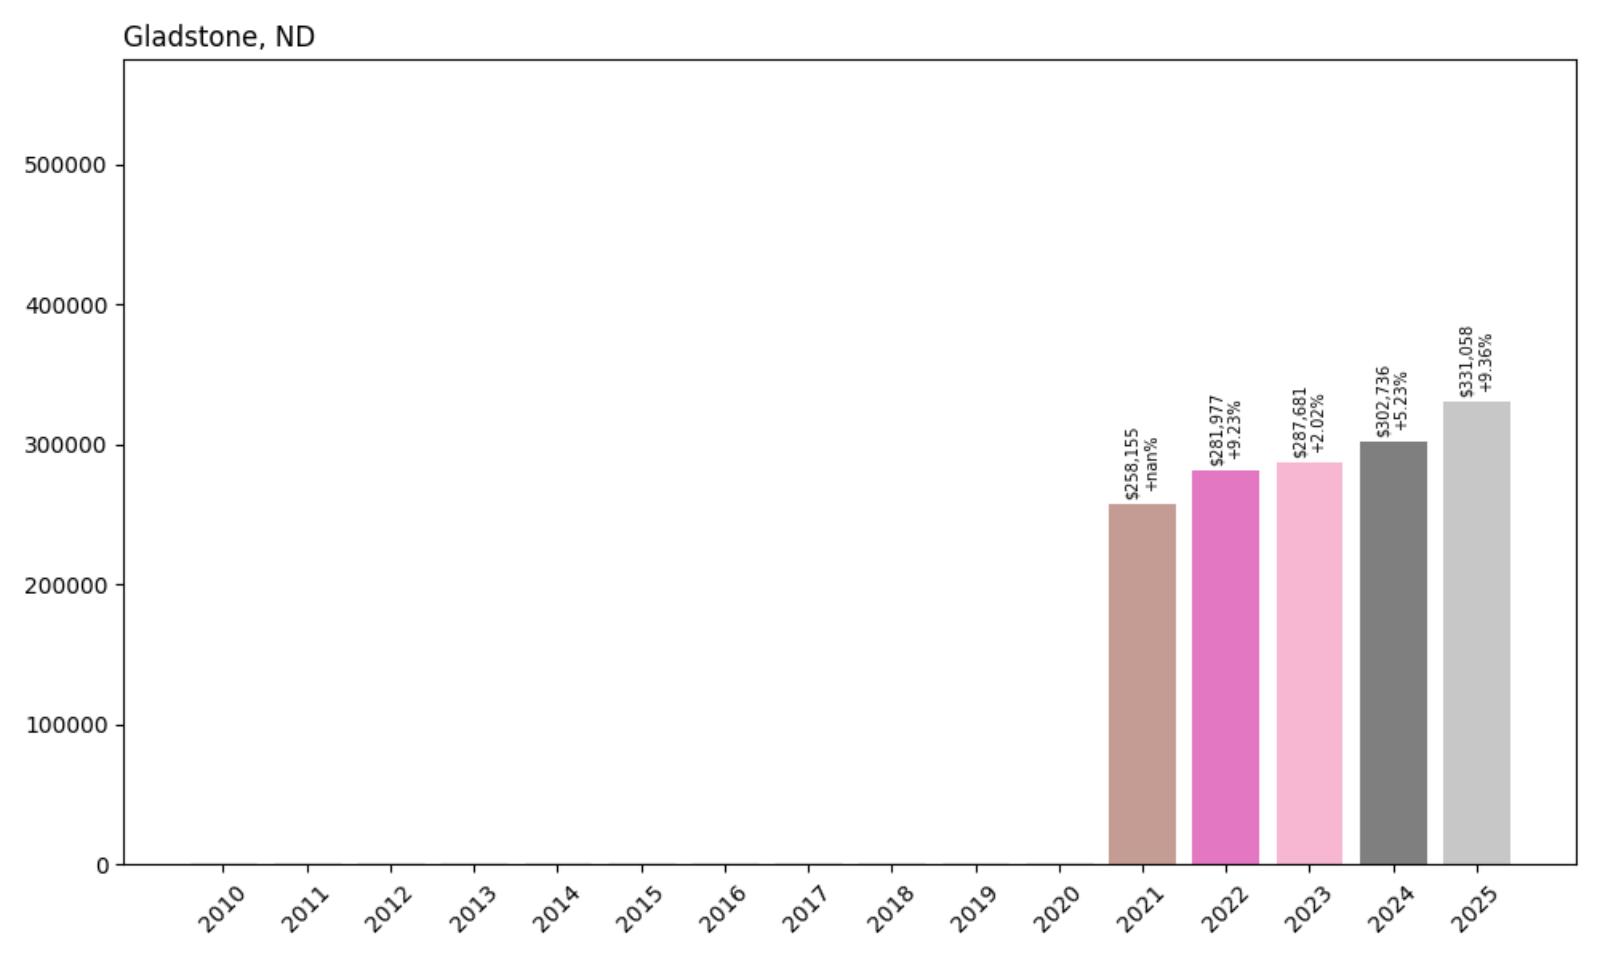
- 2021: $258,155
- 2022: $281,977 (+$23,821, +9.23% from previous year)
- 2023: $287,681 (+$5,704, +2.02% from previous year)
- 2024: $302,736 (+$15,055, +5.23% from previous year)
- 2025: $331,058 (+$28,322, +9.36% from previous year)
Gladstone’s housing market has shown impressive momentum since data became available in 2021, with median home prices climbing 28% to $331,058 over just four years. The market has demonstrated consistent appreciation, including particularly strong gains of 9.23% in 2022 and 9.36% in 2025. This growth trajectory suggests a community experiencing increased demand and economic optimism.
Gladstone – Small Community With Big Appreciation
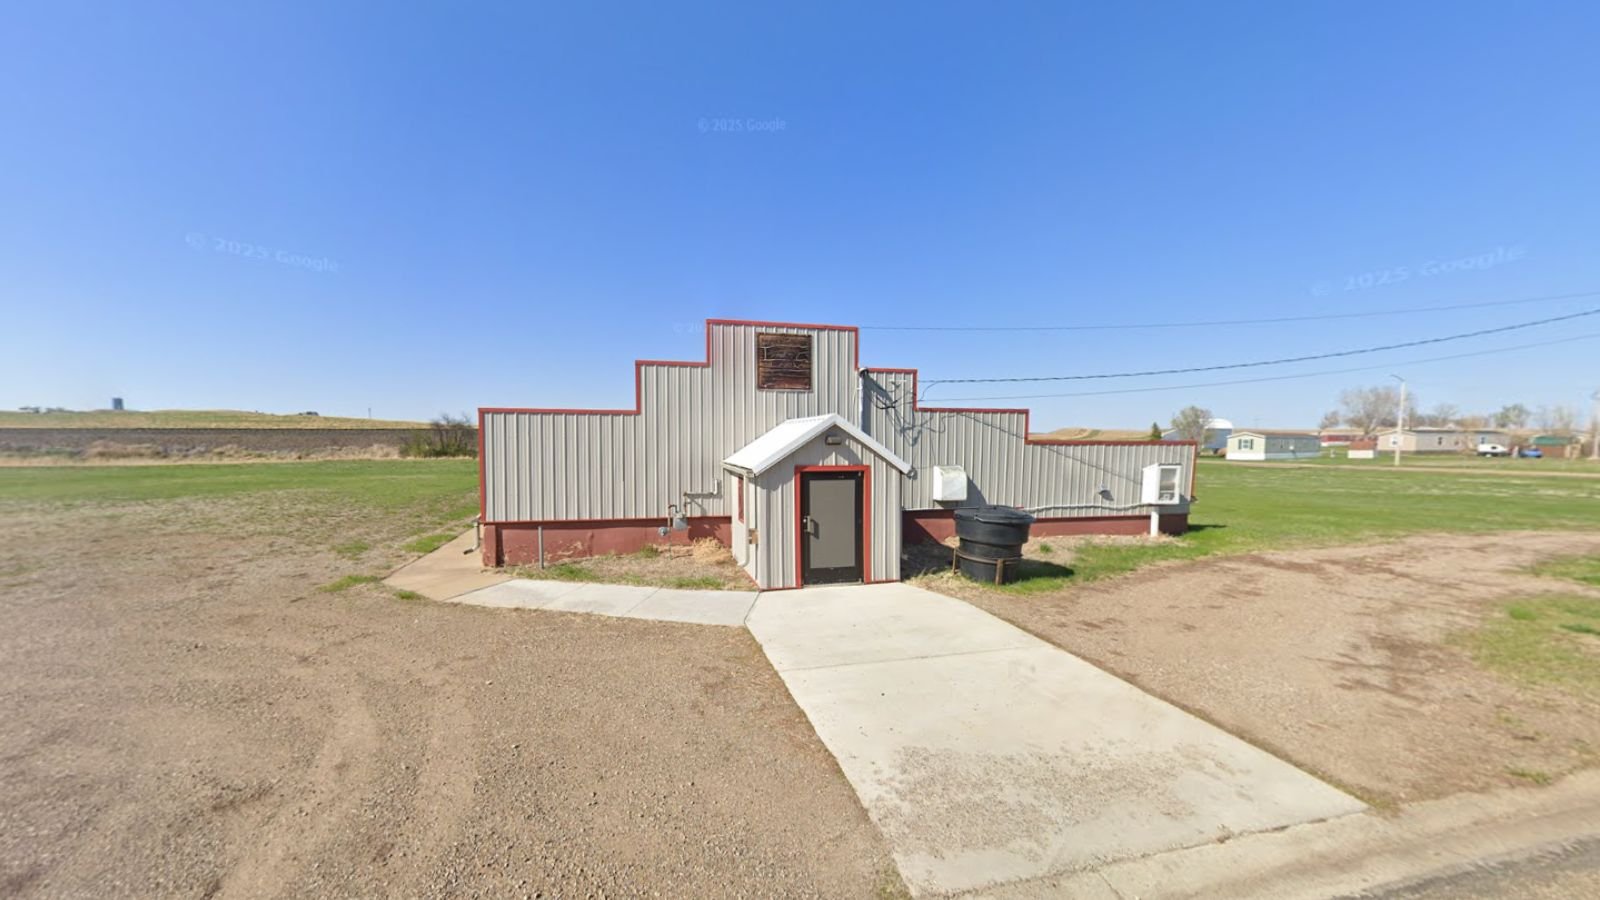
Located in Stark County in southwestern North Dakota, Gladstone is a small agricultural community that has benefited from the region’s energy development and agricultural prosperity. With fewer than 250 residents, this rural town sits in an area that has experienced significant oil and gas activity while maintaining its agricultural roots. The community’s location provides access to both farming opportunities and energy sector employment.
The strong housing price appreciation since 2021 likely reflects a combination of factors including increased economic activity in the region, limited housing supply typical of small communities, and the broader trend of rising real estate values across North Dakota. The particularly strong 9.36% gain in 2025 suggests continued optimism about the area’s economic prospects and quality of life appeal.
21. Coleharbor – 30% Home Price Increase Since 2017
- 2010: N/A
- 2011: N/A
- 2012: N/A
- 2013: N/A
- 2014: N/A
- 2015: N/A
- 2016: N/A
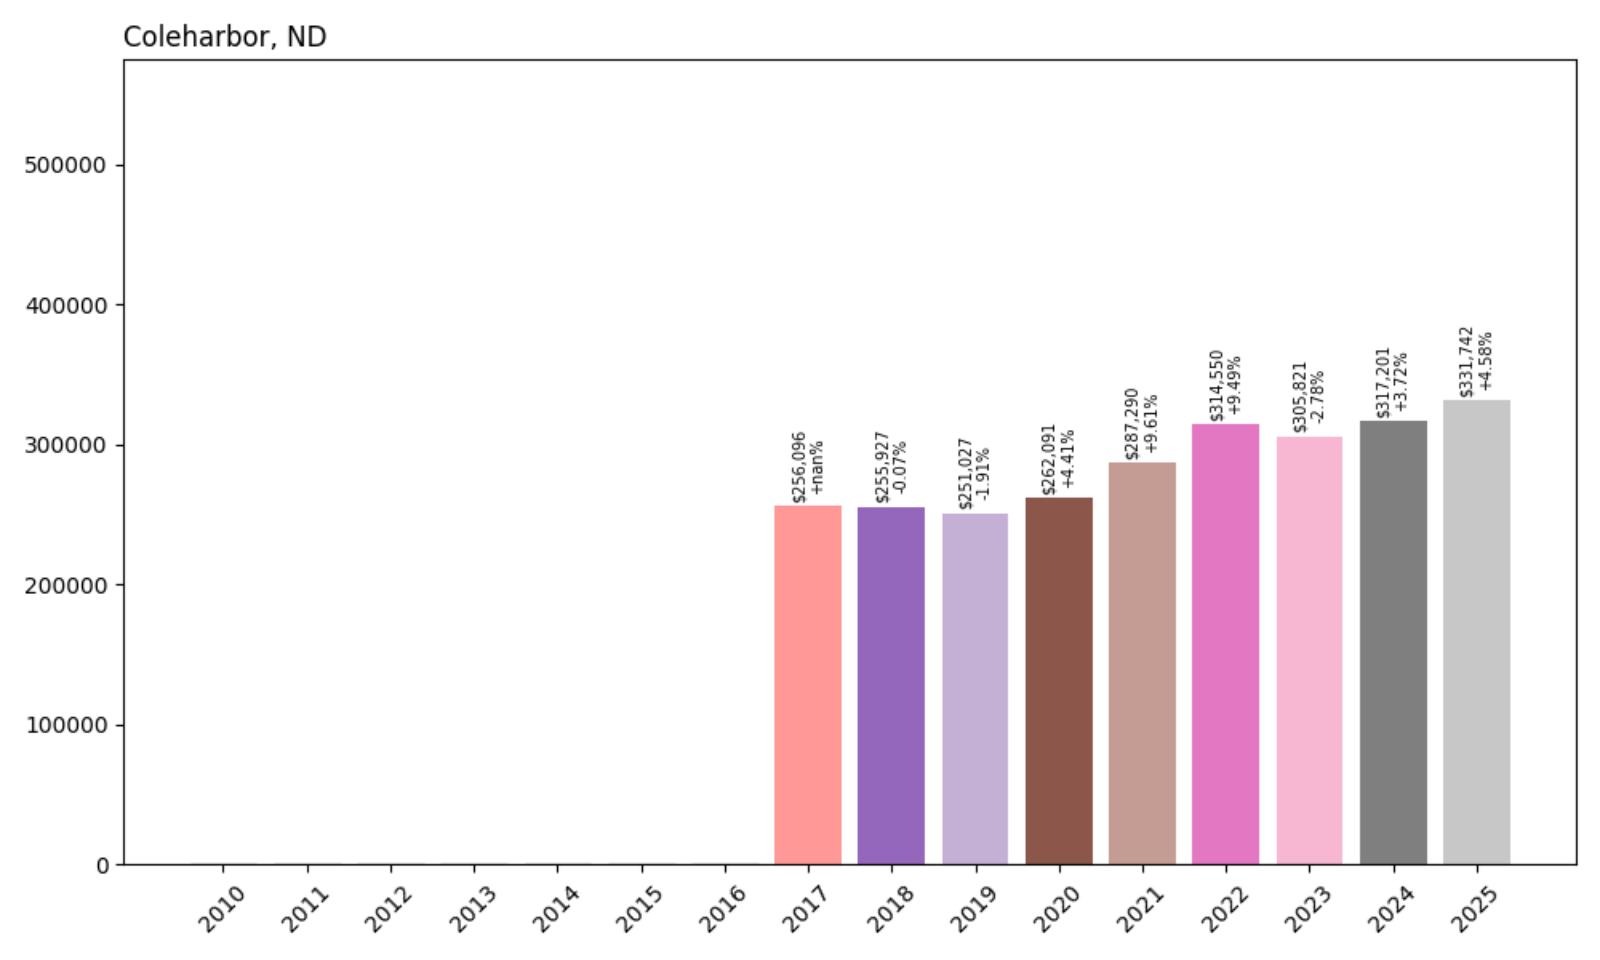
- 2017: $256,096
- 2018: $255,927 (−$169, −0.07% from previous year)
- 2019: $251,027 (−$4,900, −1.91% from previous year)
- 2020: $262,091 (+$11,064, +4.41% from previous year)
- 2021: $287,290 (+$25,199, +9.61% from previous year)
- 2022: $314,550 (+$27,260, +9.49% from previous year)
- 2023: $305,821 (−$8,729, −2.78% from previous year)
- 2024: $317,201 (+$11,381, +3.72% from previous year)
- 2025: $331,742 (+$14,541, +4.58% from previous year)
Coleharbor’s housing market has shown solid appreciation over the past eight years, with median home prices rising 30% since 2017 to reach $331,742 in 2025. The market experienced particularly strong growth during 2021-2022, with back-to-back gains of nearly 10% each year. After a brief correction in 2023, prices have resumed their upward trajectory with healthy gains in recent years.
Coleharbor – Lakeside Community With Recreational Appeal
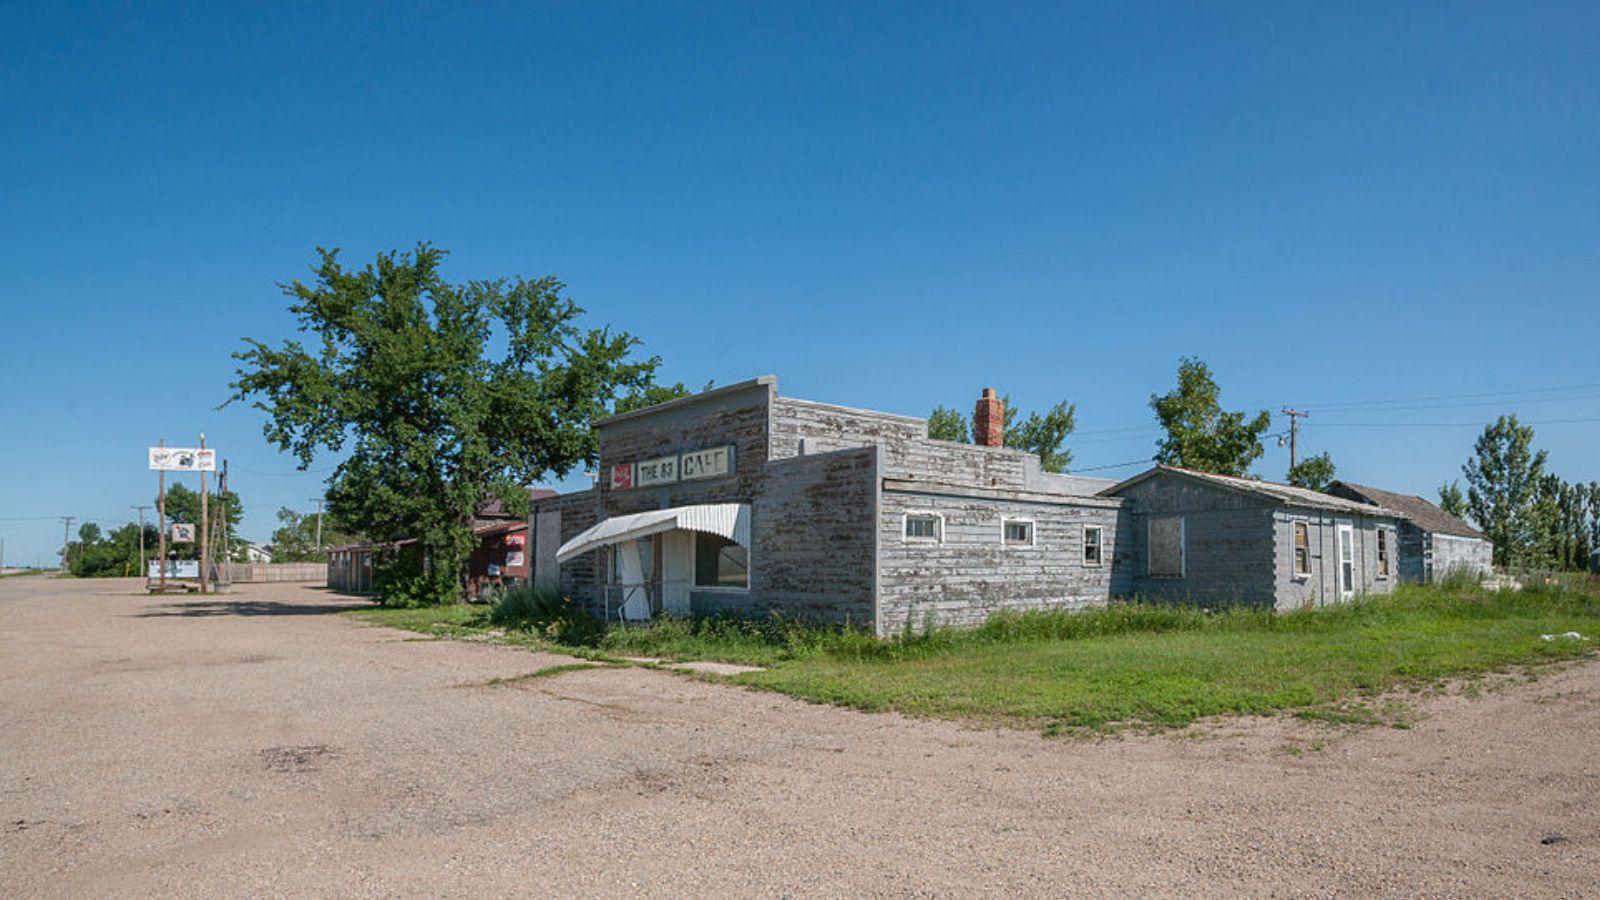
Located on the shores of Lake Sakakawea in McLean County, Coleharbor occupies a unique position in North Dakota’s housing market as one of the state’s premier lakeside communities. With approximately 80 residents, this small town benefits from its scenic location along the state’s largest body of water, which was created by the Garrison Dam on the Missouri River. The community serves as a recreational hub for fishing, boating, and outdoor enthusiasts from across the region.
Price appreciation has been supported by limited housing supply and the unique appeal of lakefront and lake-adjacent properties. The market’s resilience during economic downturns reflects the enduring value of recreational real estate and the community’s appeal to buyers from both within North Dakota and neighboring states. Recent price gains suggest continued demand for properties in this scenic location, driven by both local buyers and those seeking recreational opportunities.
20. Mapleton – 62% Home Price Increase Since 2010
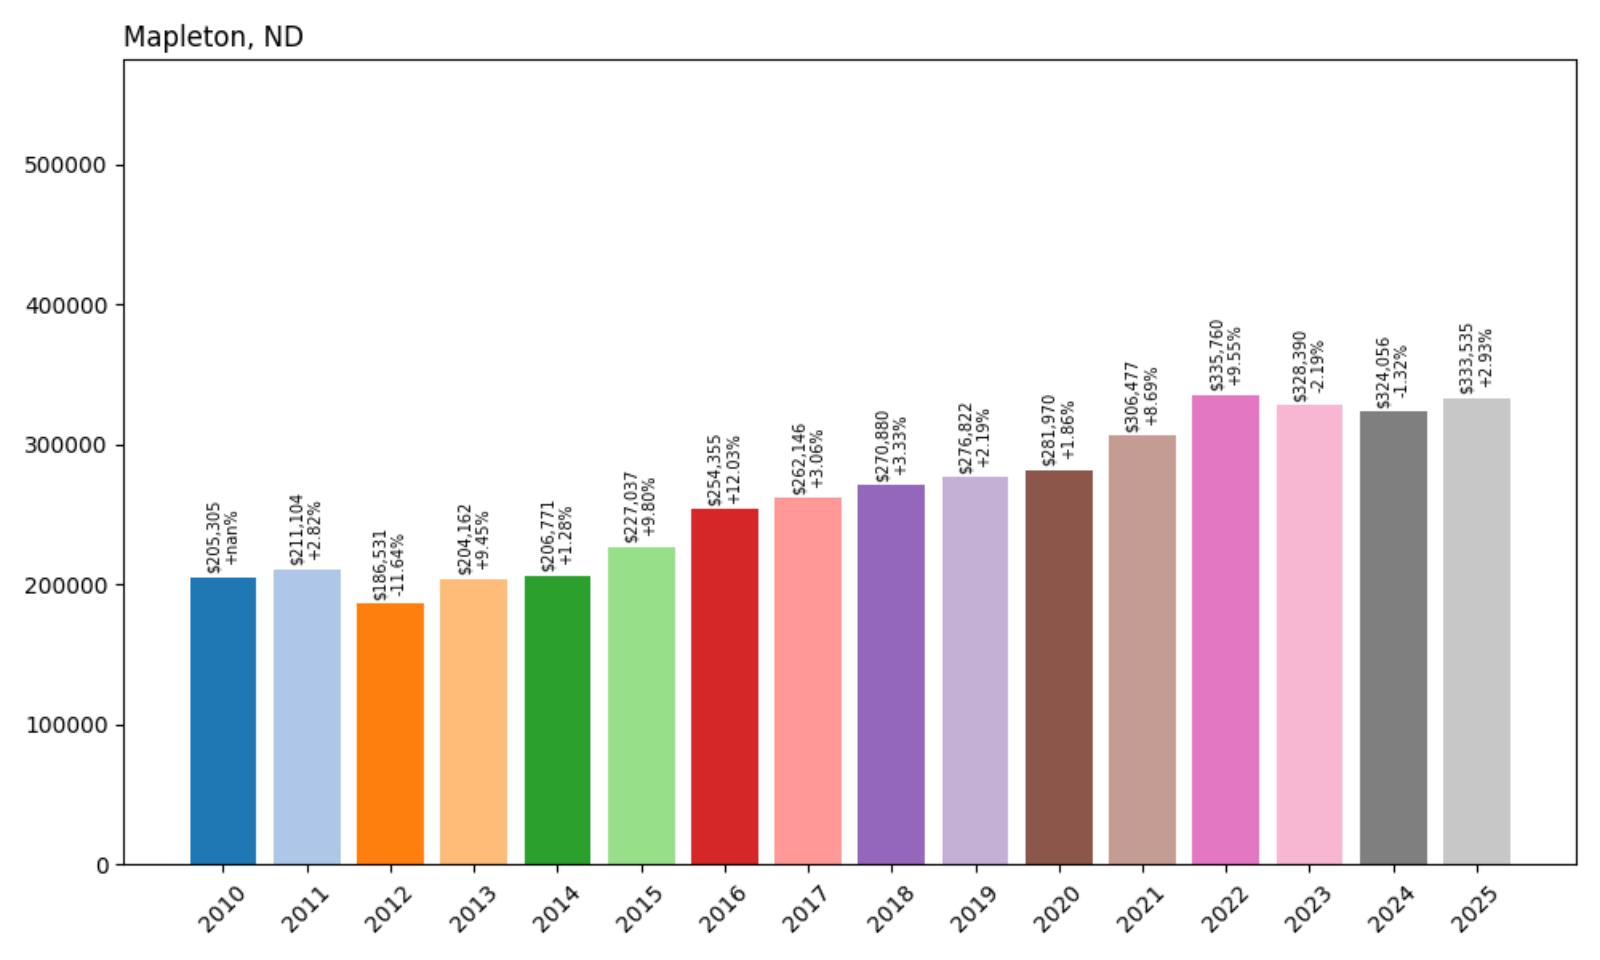
- 2010: $205,305
- 2011: $211,104 (+$5,799, +2.82% from previous year)
- 2012: $186,531 (−$24,573, −11.64% from previous year)
- 2013: $204,162 (+$17,630, +9.45% from previous year)
- 2014: $206,771 (+$2,610, +1.28% from previous year)
- 2015: $227,037 (+$20,266, +9.80% from previous year)
- 2016: $254,355 (+$27,318, +12.03% from previous year)
- 2017: $262,146 (+$7,790, +3.06% from previous year)
- 2018: $270,880 (+$8,735, +3.33% from previous year)
- 2019: $276,822 (+$5,942, +2.19% from previous year)
- 2020: $281,970 (+$5,148, +1.86% from previous year)
- 2021: $306,477 (+$24,508, +8.69% from previous year)
- 2022: $335,760 (+$29,282, +9.55% from previous year)
- 2023: $328,390 (−$7,370, −2.19% from previous year)
- 2024: $324,056 (−$4,334, −1.32% from previous year)
- 2025: $333,535 (+$9,479, +2.93% from previous year)
Mapleton’s housing market has delivered solid long-term returns with a 62% increase in median home prices since 2010, reaching $333,535 in 2025. The market showed strong momentum through most of the 2010s, peaked in 2022 near $336,000, and has recently stabilized after a modest correction. The recovery in 2025 suggests renewed confidence in this Cass County community’s residential appeal.
Mapleton – Agricultural Hub With Suburban Appeal
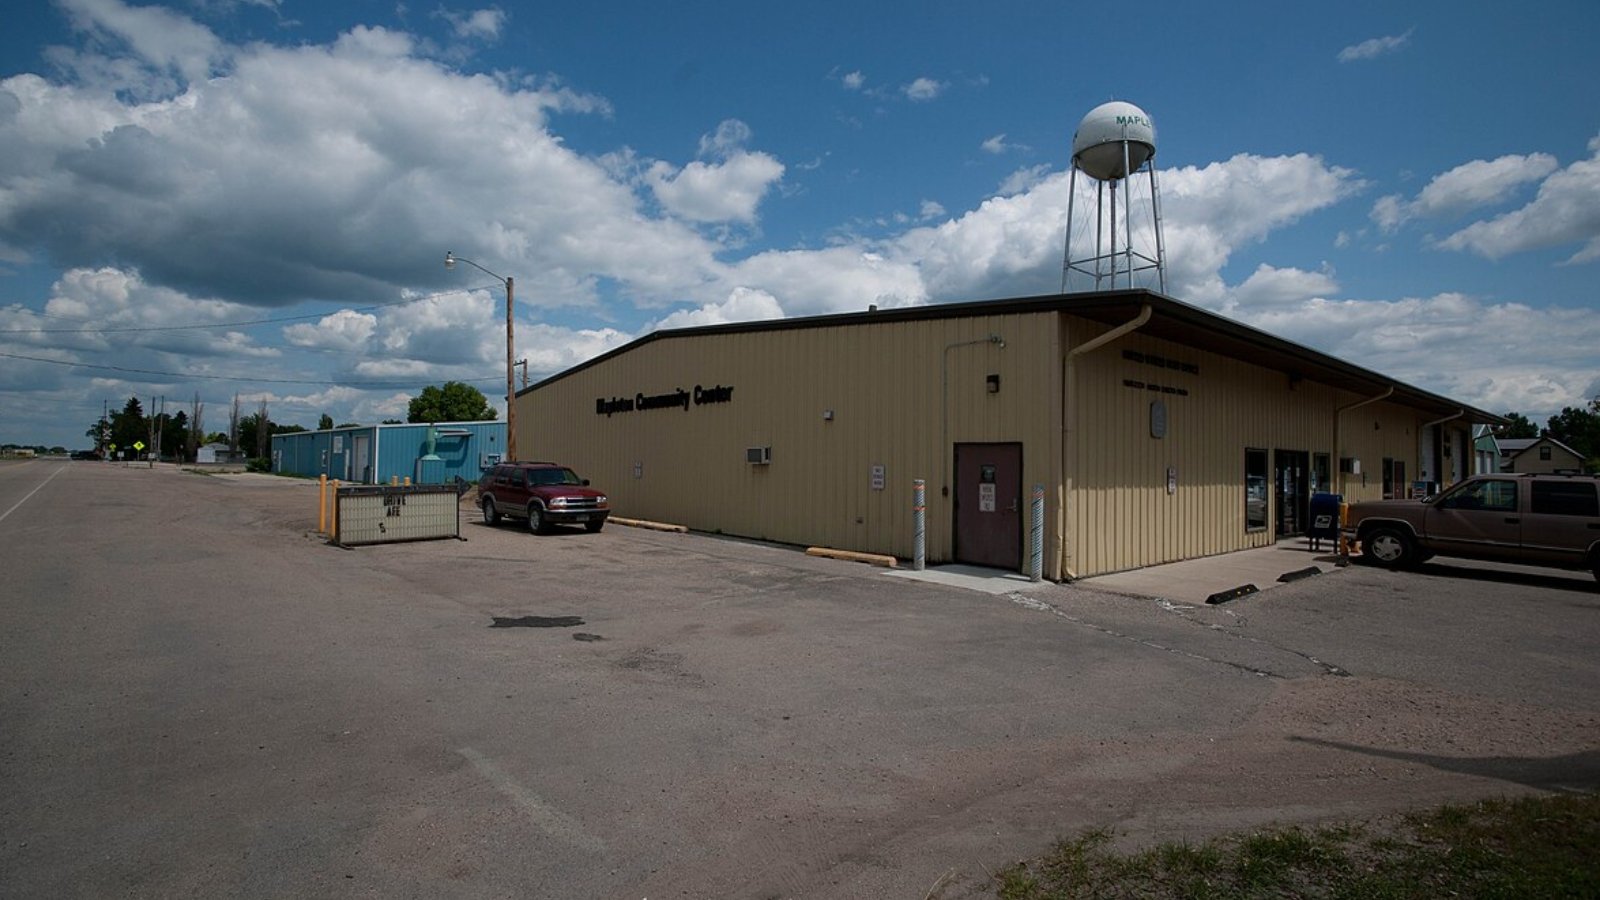
Located in Cass County approximately 20 miles west of Fargo, Mapleton combines small-town charm with convenient access to the state’s largest metropolitan area. This community of roughly 1,000 residents sits in the heart of the Red River Valley’s fertile agricultural lands while serving as an increasingly popular choice for commuters working in Fargo. The town’s location along Interstate 94 provides excellent connectivity to regional employment centers.
The housing market’s steady appreciation reflects Mapleton’s dual appeal as both an agricultural center and a bedroom community for Fargo area workers. Strong growth during 2015-2016 and again in 2021-2022 coincided with periods of regional economic expansion and increased interest in suburban and rural living options. The community offers newer housing developments alongside traditional agricultural properties, providing options for various lifestyle preferences.
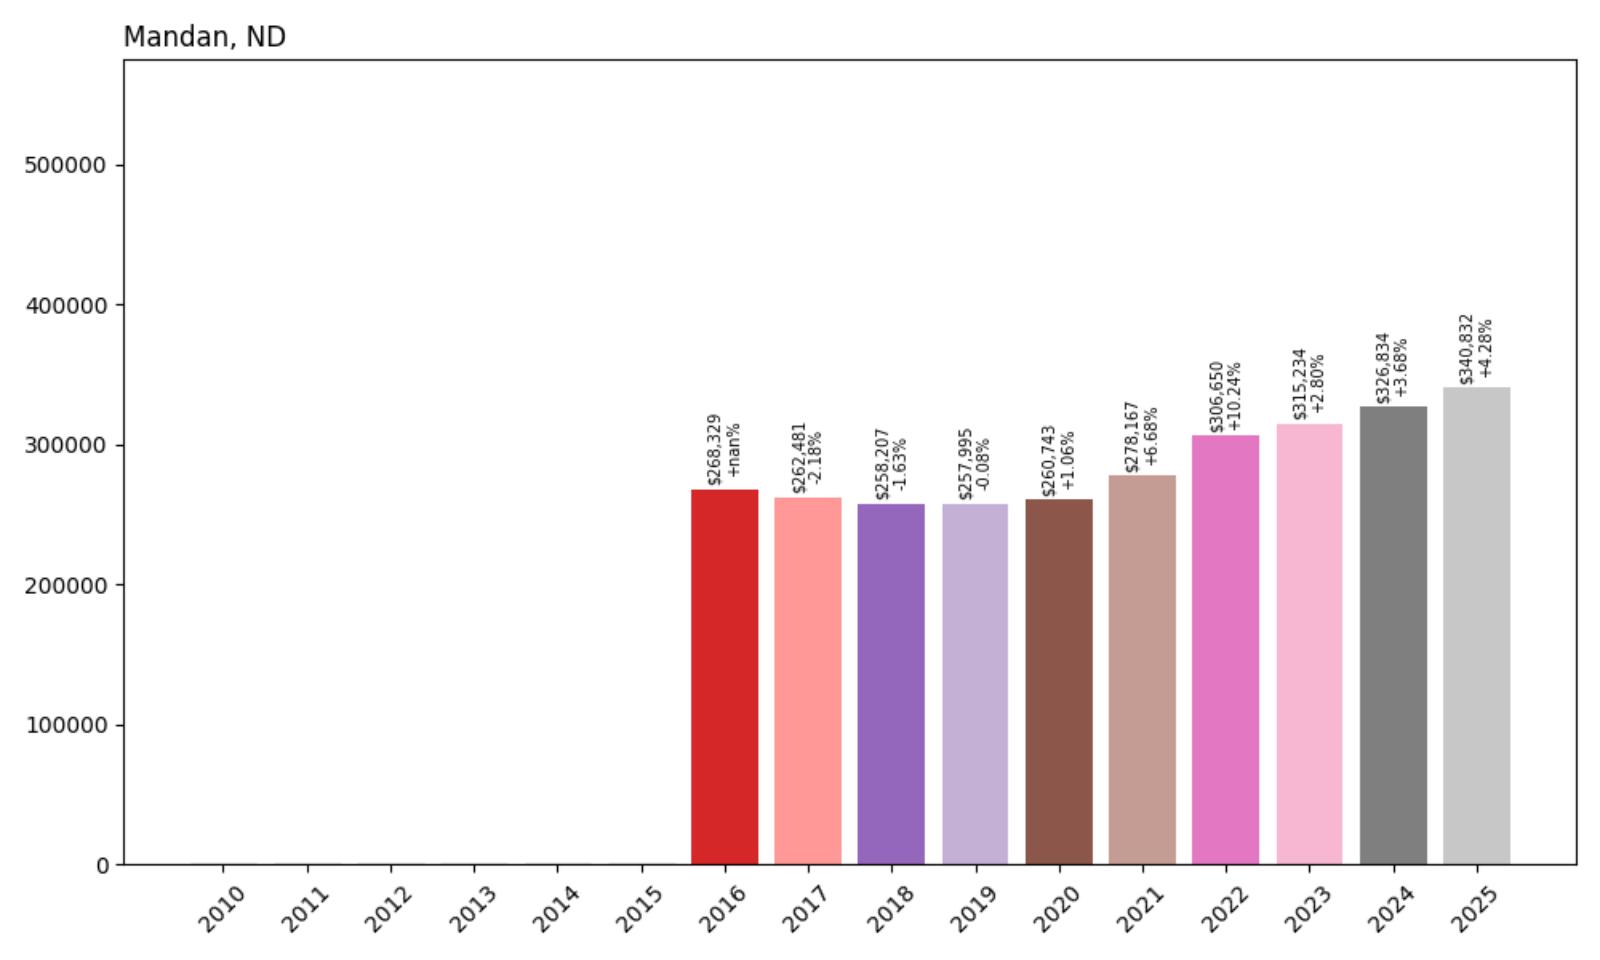
19. Mandan – 27% Home Price Increase Since 2016
- 2010: N/A
- 2011: N/A
- 2012: N/A
- 2013: N/A
- 2014: N/A
- 2015: N/A
- 2016: $268,329
- 2017: $262,481 (−$5,848, −2.18% from previous year)
- 2018: $258,207 (−$4,274, −1.63% from previous year)
- 2019: $257,995 (−$212, −0.08% from previous year)
- 2020: $260,743 (+$2,747, +1.06% from previous year)
- 2021: $278,167 (+$17,424, +6.68% from previous year)
- 2022: $306,650 (+$28,483, +10.24% from previous year)
- 2023: $315,234 (+$8,585, +2.80% from previous year)
- 2024: $326,834 (+$11,600, +3.68% from previous year)
- 2025: $340,832 (+$13,998, +4.28% from previous year)
Mandan’s housing market has shown remarkable resilience and growth, with median home prices climbing 27% since 2016 to reach $340,832 in 2025. After a sluggish period from 2017-2020, the market accelerated dramatically starting in 2021 with four consecutive years of strong appreciation. The consistent upward trajectory in recent years reflects growing demand for this Missouri River community.
Mandan – Historic City With Modern Growth
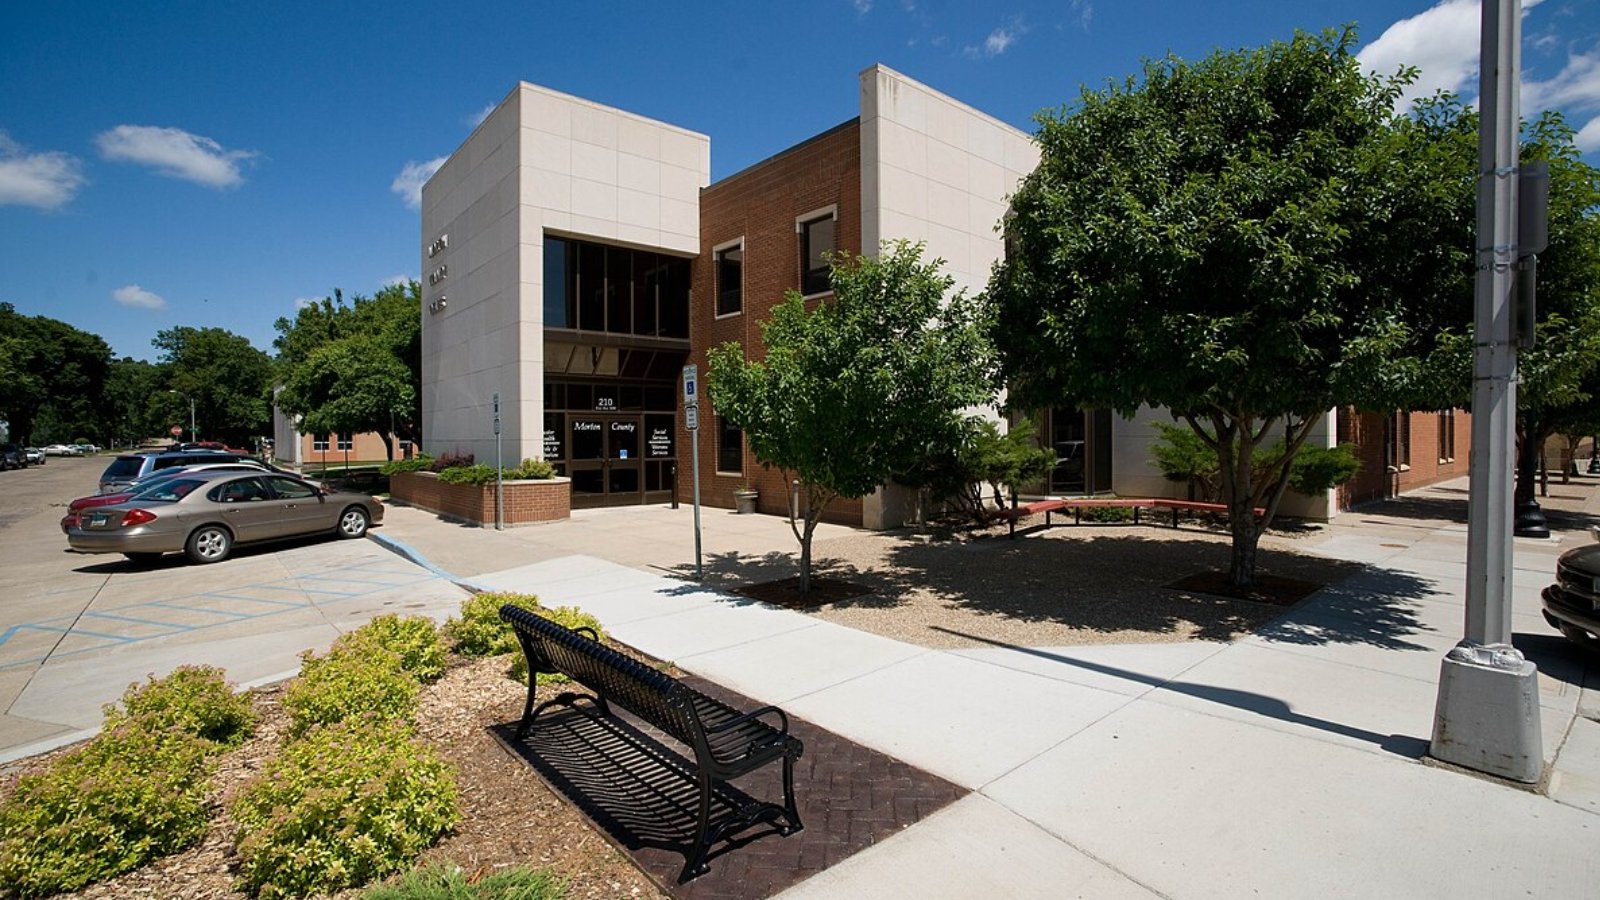
Located directly across the Missouri River from Bismarck, Mandan serves as the western anchor of central North Dakota’s primary metropolitan area. With approximately 22,000 residents, this historic community combines its role as the state capital region’s second-largest city with a rich railroad heritage and growing suburban appeal. Mandan’s location provides direct access to state government employment, healthcare systems, and educational opportunities while maintaining its distinct community identity.
Recent price appreciation has been driven by both local demand and spillover effects from Bismarck’s housing market, where prices and competition have pushed some buyers to consider Mandan’s offerings. The city’s ongoing development projects, including new residential areas and commercial centers, demonstrate confidence in long-term growth prospects. The consistent 4-10% annual price gains since 2021 reflect a healthy market supported by job growth, population increase, and limited housing inventory relative to demand.
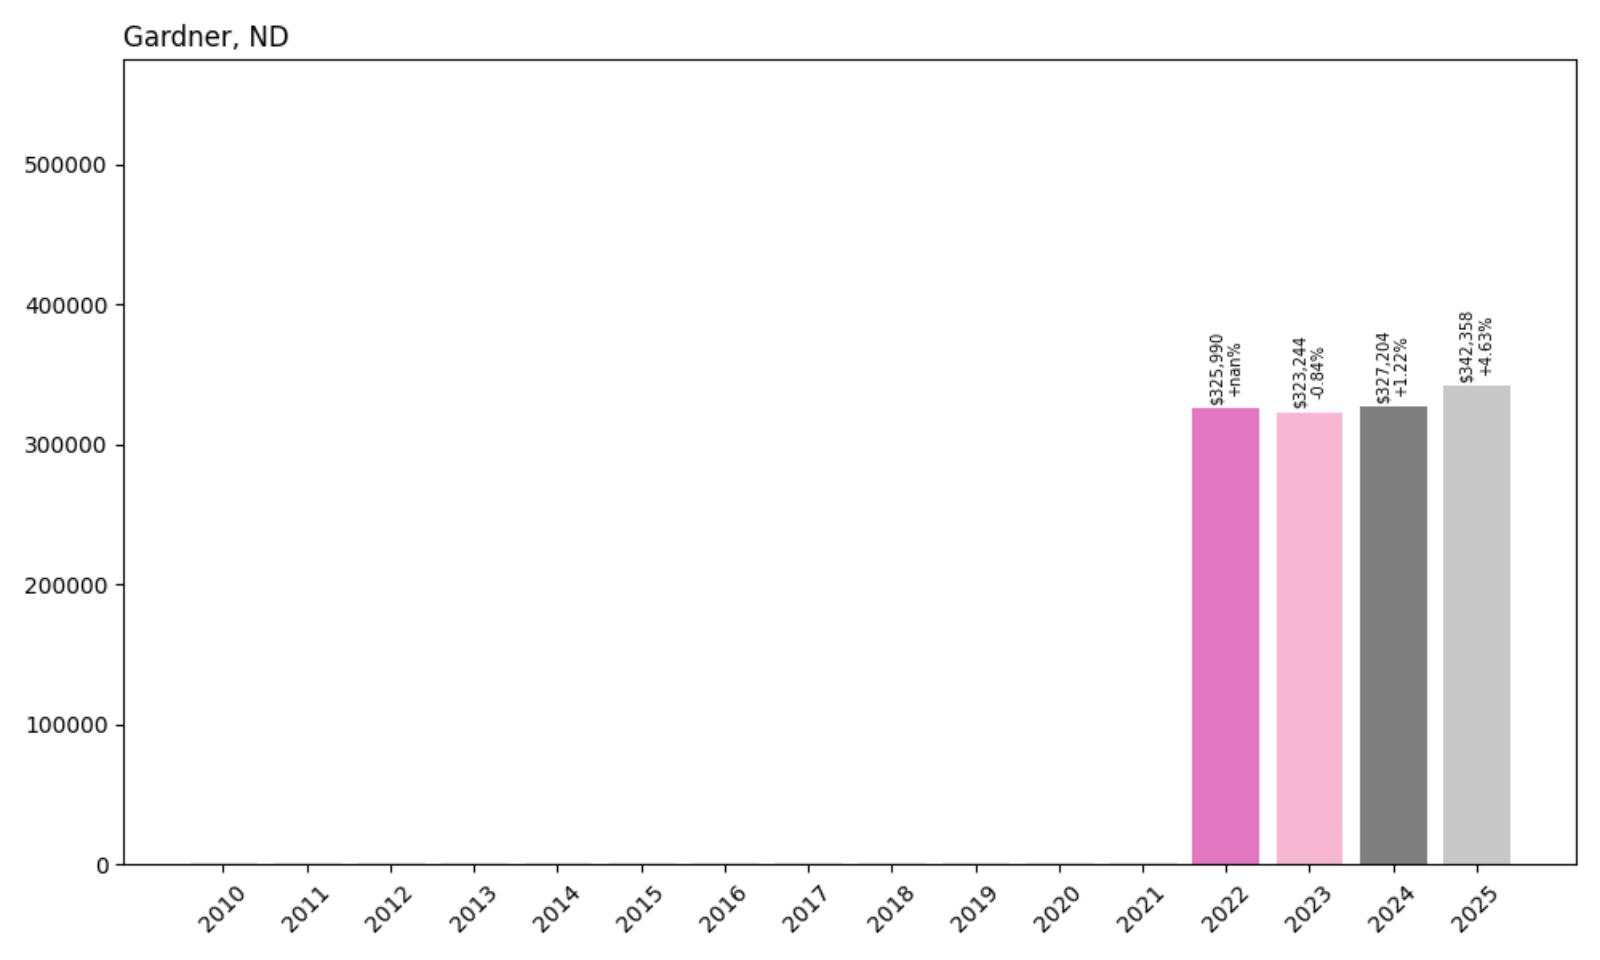
18. Gardner – Small Town Stability
- 2010: N/A
- 2011: N/A
- 2012: N/A
- 2013: N/A
- 2014: N/A
- 2015: N/A
- 2016: N/A
- 2017: N/A
- 2018: N/A
- 2019: N/A
- 2020: N/A
- 2021: N/A
- 2022: $325,990
- 2023: $323,244 (−$2,746, −0.84% from previous year)
- 2024: $327,204 (+$3,960, +1.22% from previous year)
- 2025: $342,358 (+$15,154, +4.63% from previous year)
Gardner’s limited housing market data shows relative stability with modest appreciation over the past three years. The current median home price of $342,358 represents a 5% increase since 2022, with the strongest growth occurring in 2025. This small Cass County community demonstrates how even tiny markets can command significant home values in North Dakota’s elevated real estate environment.
Gardner – Rural Charm With Premium Pricing
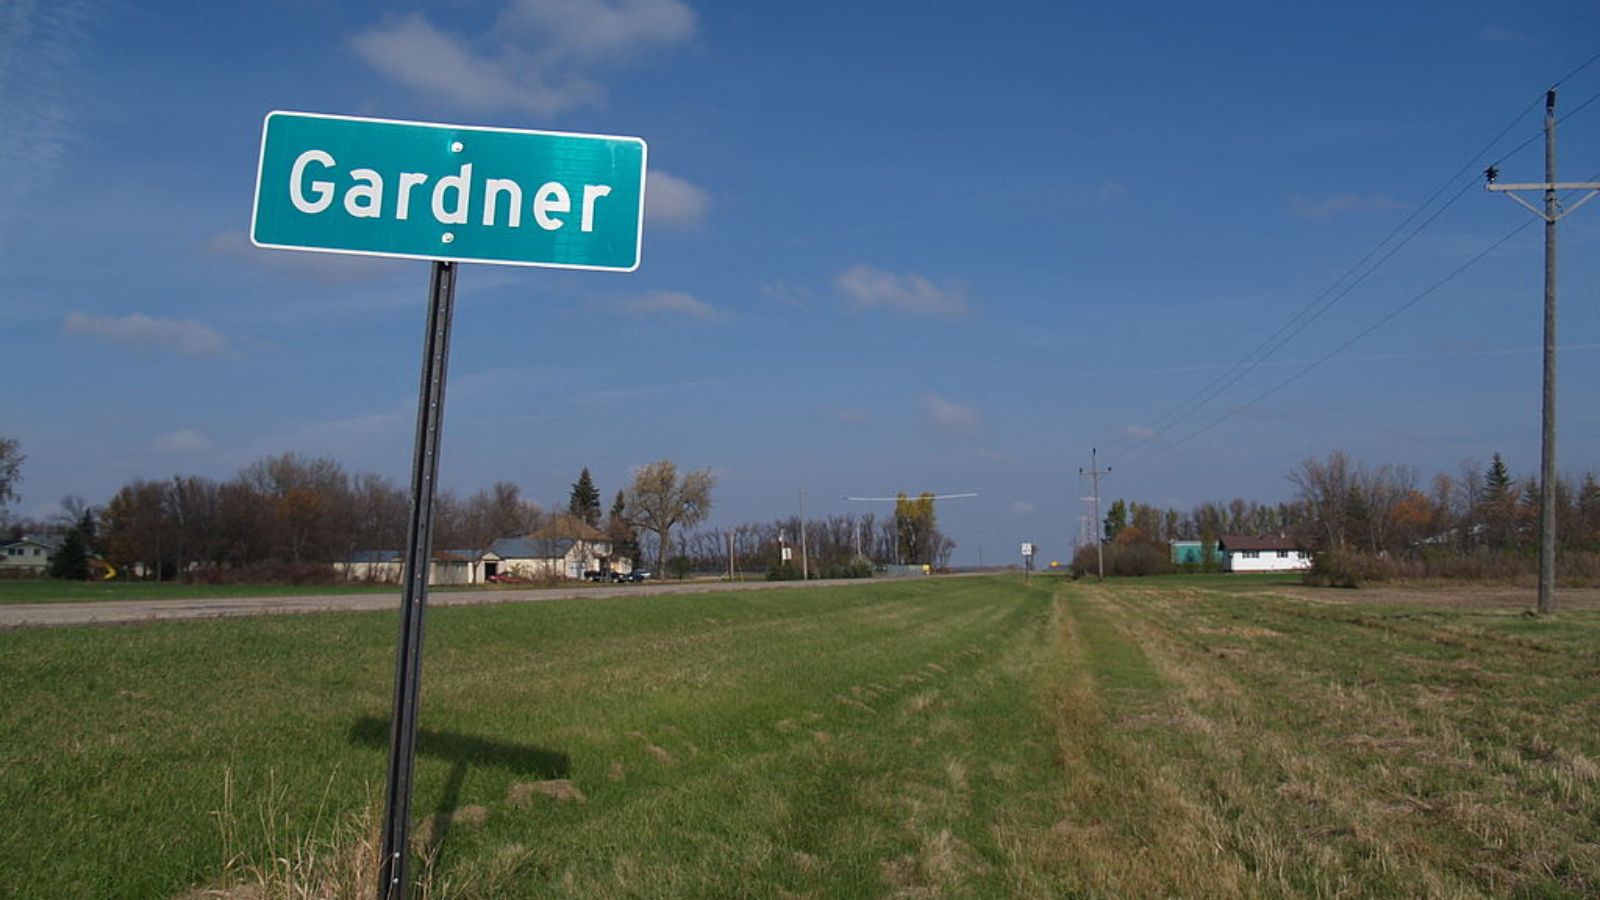
Located in Cass County in southeastern North Dakota, Gardner is a small agricultural community with fewer than 100 residents that has nonetheless achieved premium home pricing levels. The town sits in some of the state’s most productive farmland, contributing to local economic stability and property values. Despite its tiny size, Gardner’s location in the prosperous Red River Valley helps support higher housing costs than might be expected for such a small community.
Gardner’s ability to command home prices exceeding $340,000 demonstrates the broader elevation of real estate values across North Dakota, even in its smallest communities. The town’s agricultural economy provides a stable foundation, while its location offers access to employment opportunities in nearby cities. This combination of rural living with regional connectivity appeals to buyers seeking alternatives to urban markets while maintaining economic opportunities.
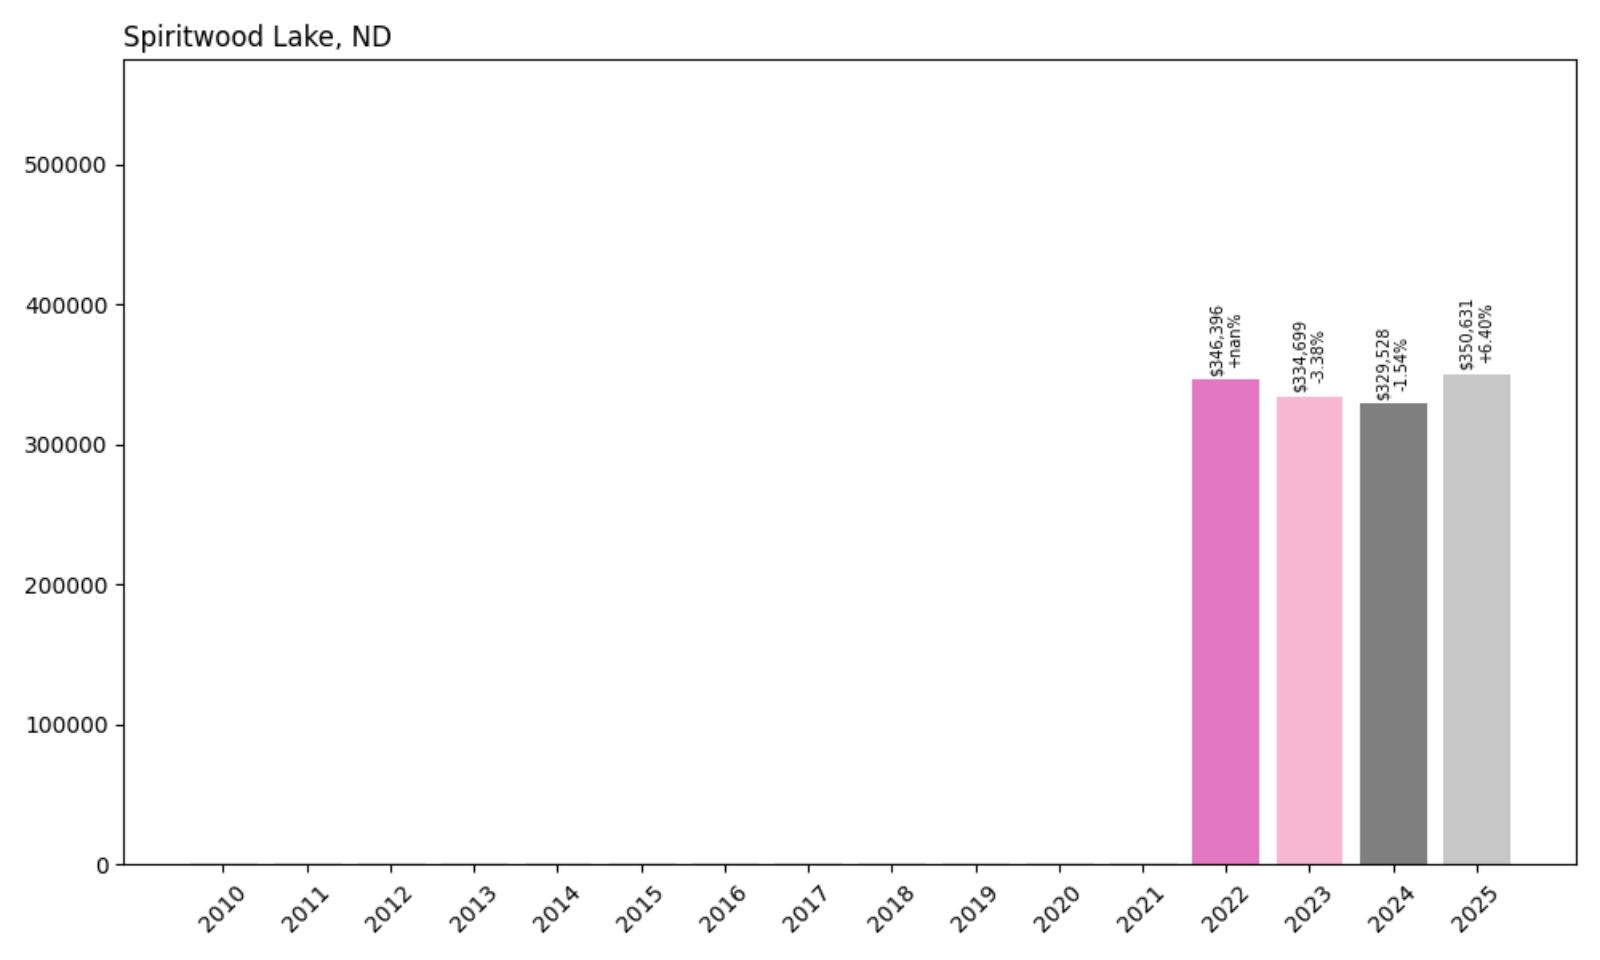
17. Spiritwood Lake – Recreational Market Recovery
- 2010: N/A
- 2011: N/A
- 2012: N/A
- 2013: N/A
- 2014: N/A
- 2015: N/A
- 2016: N/A
- 2017: N/A
- 2018: N/A
- 2019: N/A
- 2020: N/A
- 2021: N/A
- 2022: $346,396
- 2023: $334,699 (−$11,698, −3.38% from previous year)
- 2024: $329,528 (−$5,171, −1.54% from previous year)
- 2025: $350,631 (+$21,103, +6.40% from previous year)
Spiritwood Lake’s housing market experienced a notable correction in 2023-2024 before rebounding strongly with a 6.40% gain in 2025. The current median price of $350,631 exceeds the 2022 level, suggesting the market has regained momentum after a brief period of adjustment. This pattern reflects the volatility common in small recreational markets where individual sales can significantly impact overall pricing trends.
Spiritwood Lake – Recreational Community With Renewed Appeal
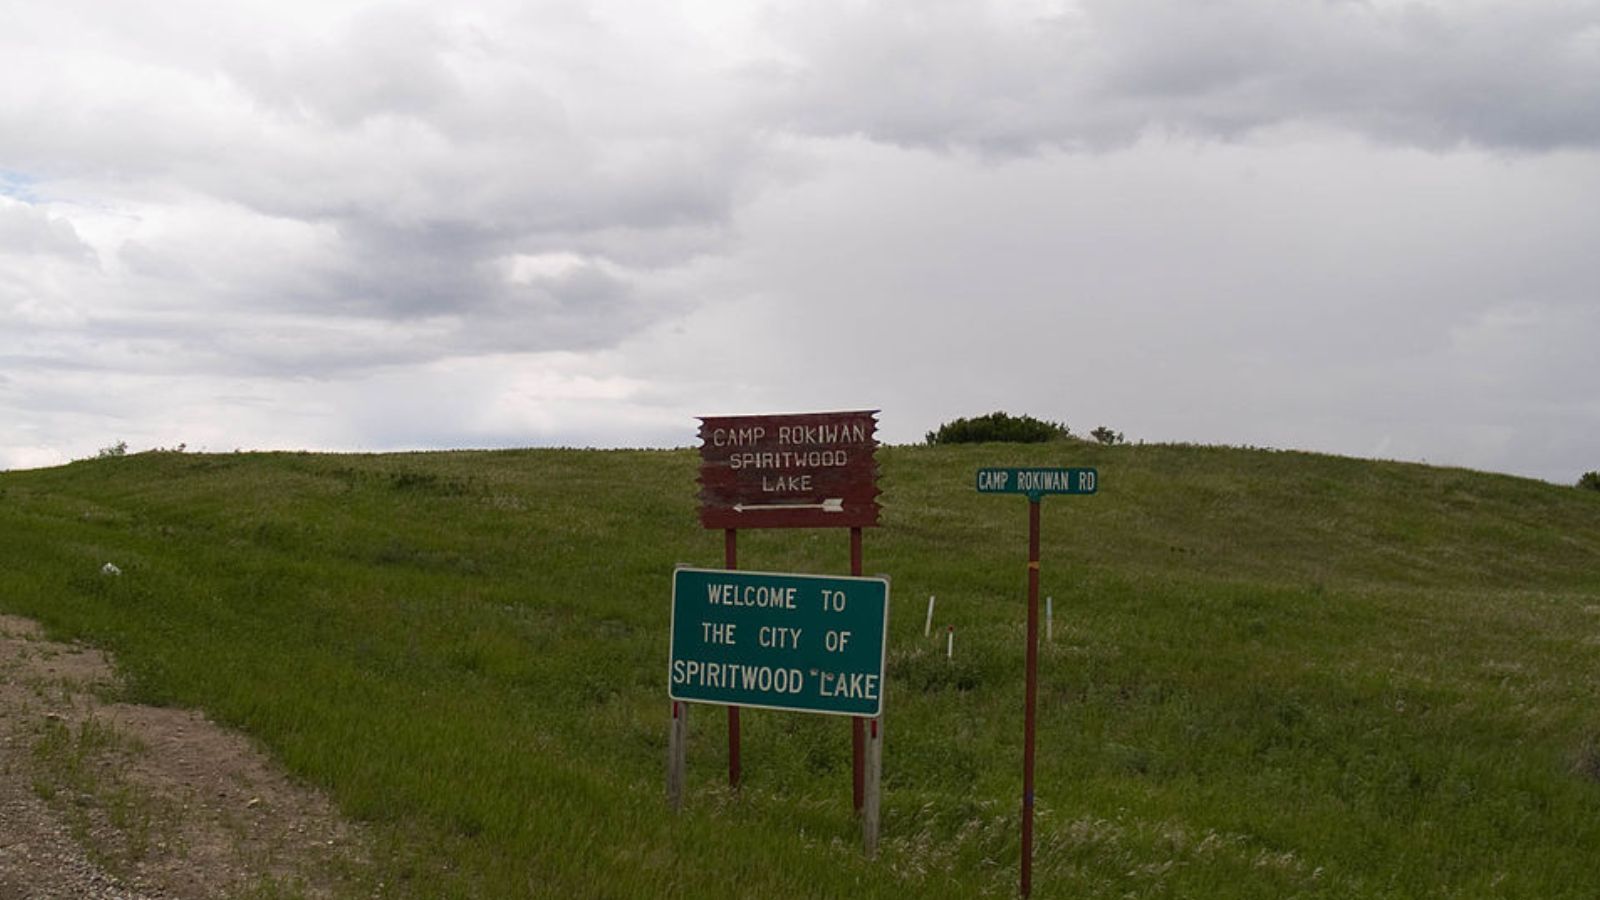
Located in Stutsman County, Spiritwood Lake is a small recreational community centered around its namesake lake, which provides fishing, boating, and outdoor recreation opportunities. With fewer than 80 residents, this community primarily serves as a destination for recreational property owners and retirees seeking lakeside living. The area’s natural beauty and recreational amenities make it attractive to buyers from across the region looking for weekend retreats or permanent lakeside residences.
The housing market’s recent volatility reflects the unique dynamics of recreational property markets, which can be more sensitive to economic changes and seasonal demand patterns than traditional residential markets. The correction in 2023-2024 may have reflected broader economic uncertainties or shifts in recreational property demand, while the strong 2025 recovery suggests renewed confidence in lakeside property investments.
16. Arnegard – Emerging Oil Town Market
- 2010: N/A
- 2011: N/A
- 2012: N/A
- 2013: N/A
- 2014: N/A
- 2015: N/A
- 2016: N/A
- 2017: N/A
- 2018: N/A
- 2019: N/A
- 2020: N/A
- 2021: N/A
- 2022: N/A
- 2023: N/A
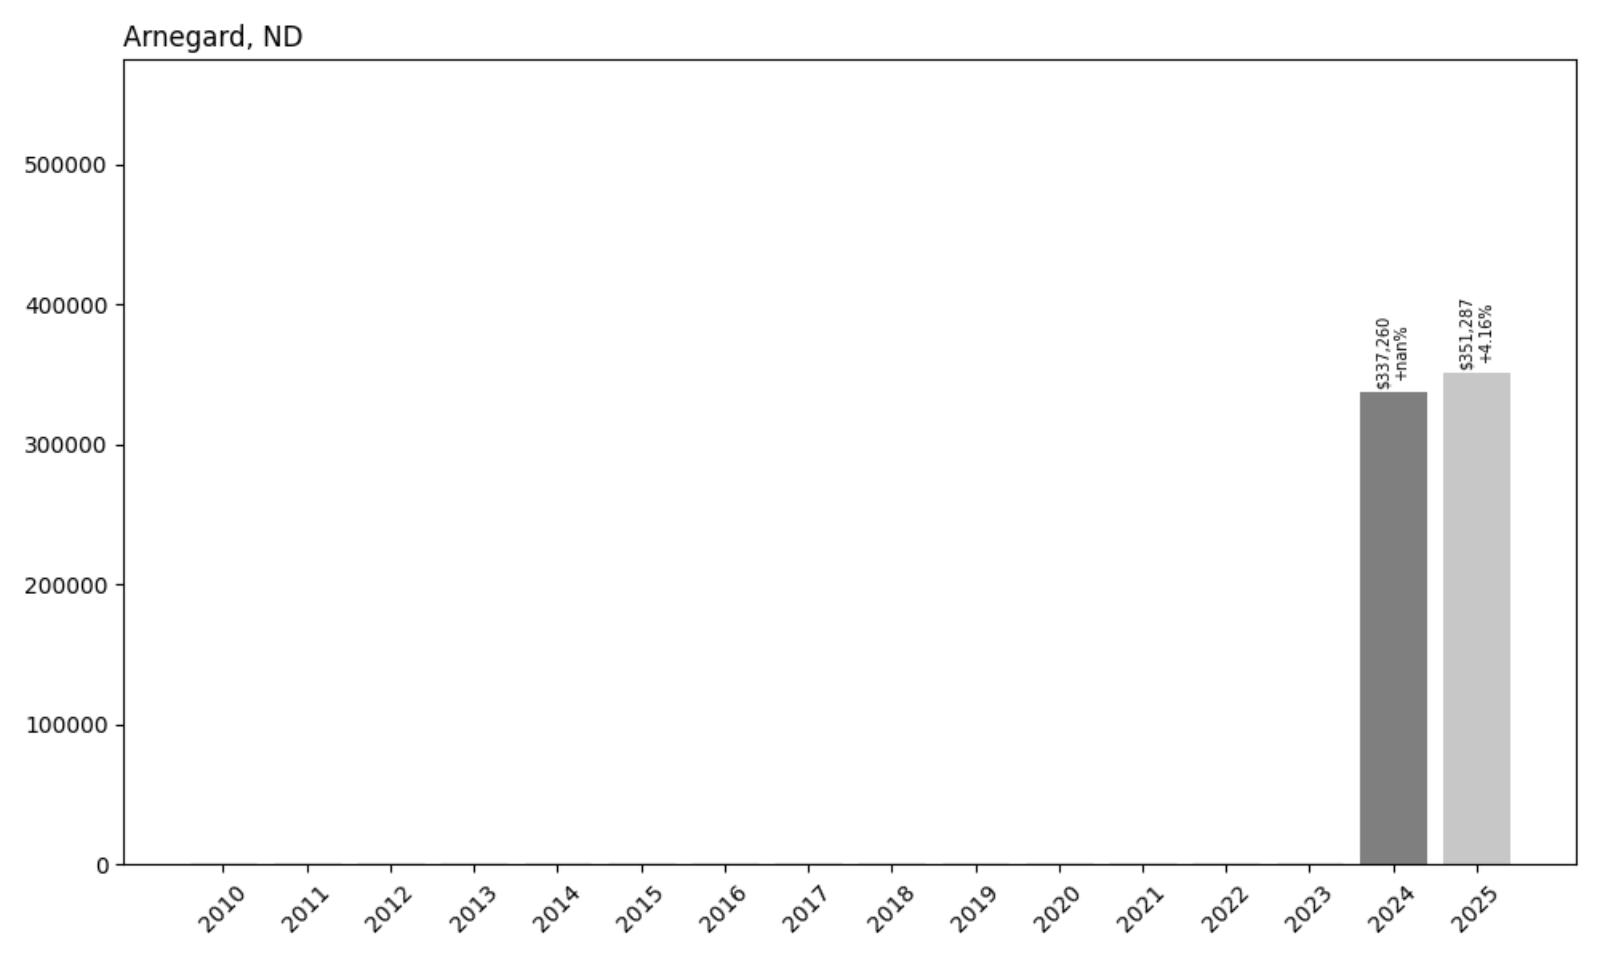
- 2024: $337,260
- 2025: $351,287 (+$14,027, +4.16% from previous year)
Arnegard’s housing market data is limited to just two years, but the available information shows solid appreciation with a 4.16% increase in 2025 bringing median home prices to $351,287. This small McKenzie County community demonstrates how even towns with limited market activity can command substantial home values in North Dakota’s energy-rich regions.
Arnegard – Oil Patch Community With Growing Appeal

Located in McKenzie County in the heart of the Bakken oil formation, Arnegard is a small community that has been significantly impacted by North Dakota’s energy boom. With fewer than 150 residents, this rural town has found itself strategically positioned near major oil and gas operations, creating new economic opportunities and housing demand. The community’s location along Highway 85 provides access to drilling sites and energy infrastructure throughout western North Dakota.
The limited housing market data reflects the reality of very small communities where home sales are infrequent but significant when they occur. The median home price exceeding $350,000 demonstrates how the energy sector’s influence has elevated property values even in tiny rural communities. This pricing level reflects both the general prosperity brought by energy development and the limited housing supply typical of small towns.
15. West Fargo – 79% Home Price Increase Since 2010
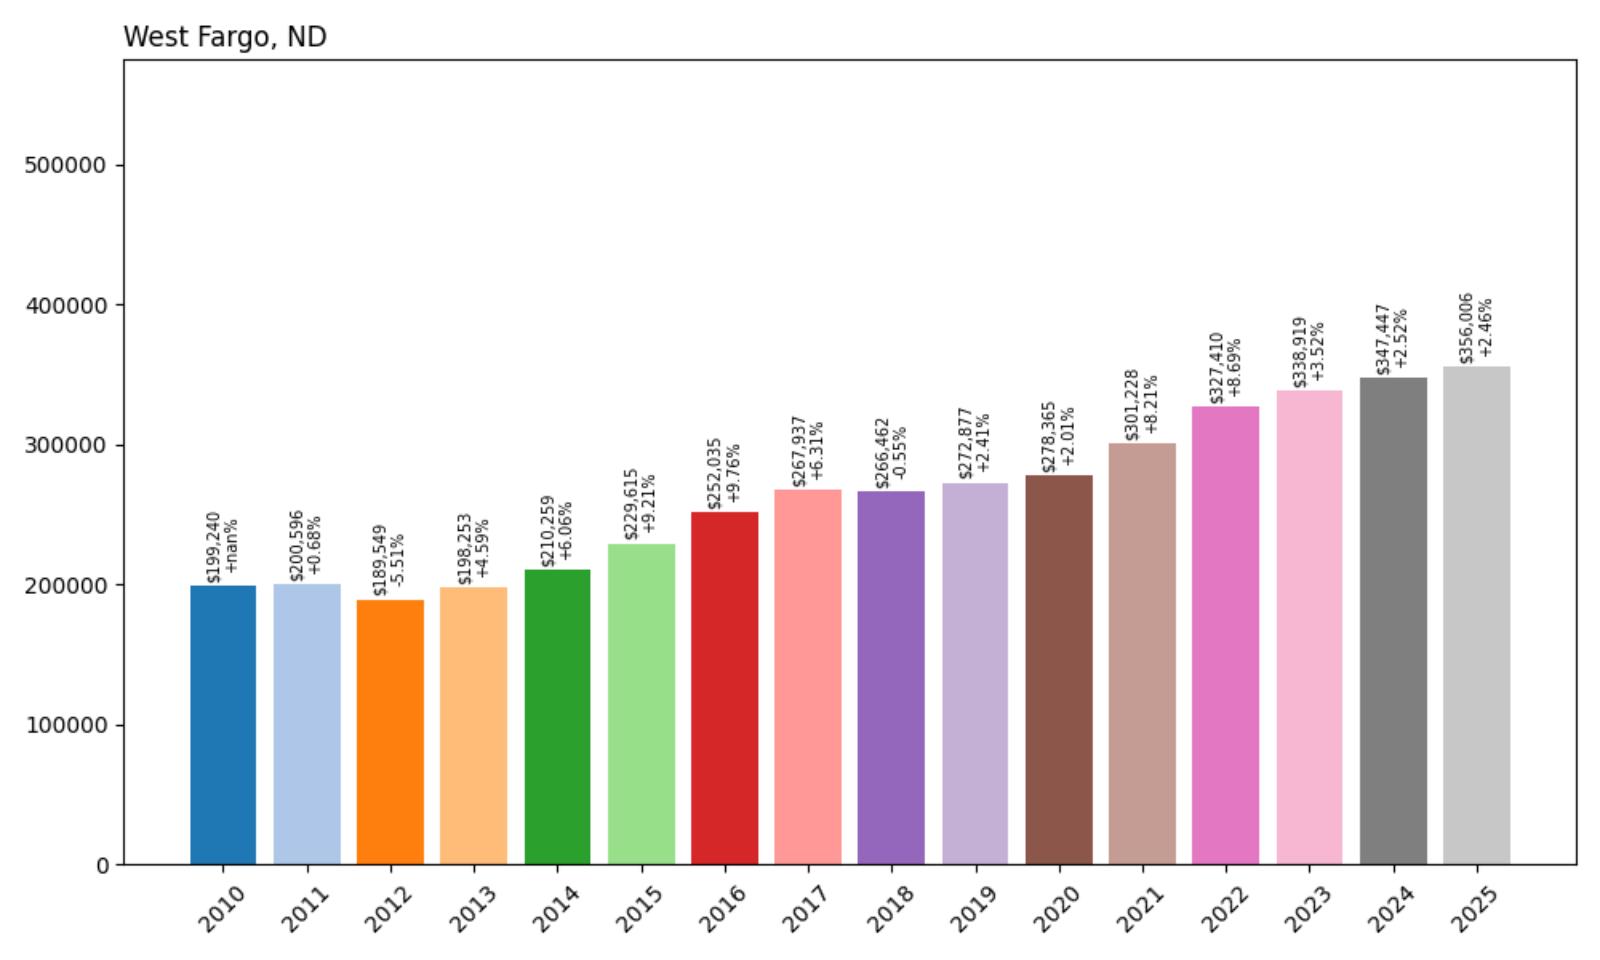
- 2010: $199,240
- 2011: $200,596 (+$1,357, +0.68% from previous year)
- 2012: $189,549 (−$11,048, −5.51% from previous year)
- 2013: $198,253 (+$8,704, +4.59% from previous year)
- 2014: $210,259 (+$12,006, +6.06% from previous year)
- 2015: $229,615 (+$19,355, +9.21% from previous year)
- 2016: $252,035 (+$22,420, +9.76% from previous year)
- 2017: $267,937 (+$15,901, +6.31% from previous year)
- 2018: $266,462 (−$1,475, −0.55% from previous year)
- 2019: $272,877 (+$6,415, +2.41% from previous year)
- 2020: $278,365 (+$5,488, +2.01% from previous year)
- 2021: $301,228 (+$22,863, +8.21% from previous year)
- 2022: $327,410 (+$26,182, +8.69% from previous year)
- 2023: $338,919 (+$11,509, +3.52% from previous year)
- 2024: $347,447 (+$8,528, +2.52% from previous year)
- 2025: $356,006 (+$8,559, +2.46% from previous year)
West Fargo has delivered impressive long-term housing appreciation with a 79% increase in median home prices since 2010, reaching $356,006 in 2025. The market showed particularly strong momentum during 2015-2017 and again in 2021-2022, with recent years maintaining steady but more moderate growth. This Cass County city represents one of North Dakota’s most successful suburban markets.
West Fargo – Booming Suburban Success Story
West Fargo has emerged as North Dakota’s fastest-growing city and one of its most desirable residential markets, with a population that has more than doubled since 2000 to exceed 40,000 residents. Located immediately west of Fargo, this community has successfully positioned itself as a premier suburban destination offering excellent schools, family-friendly neighborhoods, and extensive recreational amenities. The city’s rapid growth reflects its appeal to families and professionals seeking modern suburban living with access to Fargo’s employment opportunities.
The housing market’s strong performance reflects West Fargo’s transformation from a small agricultural community into a major suburban center. Consistent population growth, driven by both local economic expansion and migration from other parts of North Dakota and neighboring states, has created sustained demand for housing. The city has managed this growth effectively with planned developments, new schools, and infrastructure improvements that maintain high quality of life standards.
14. Epping – Oil Boom Recovery
- 2010: N/A
- 2011: N/A
- 2012: N/A
- 2013: N/A
- 2014: N/A
- 2015: N/A
- 2016: N/A
- 2017: N/A
- 2018: N/A
- 2019: N/A
- 2020: N/A
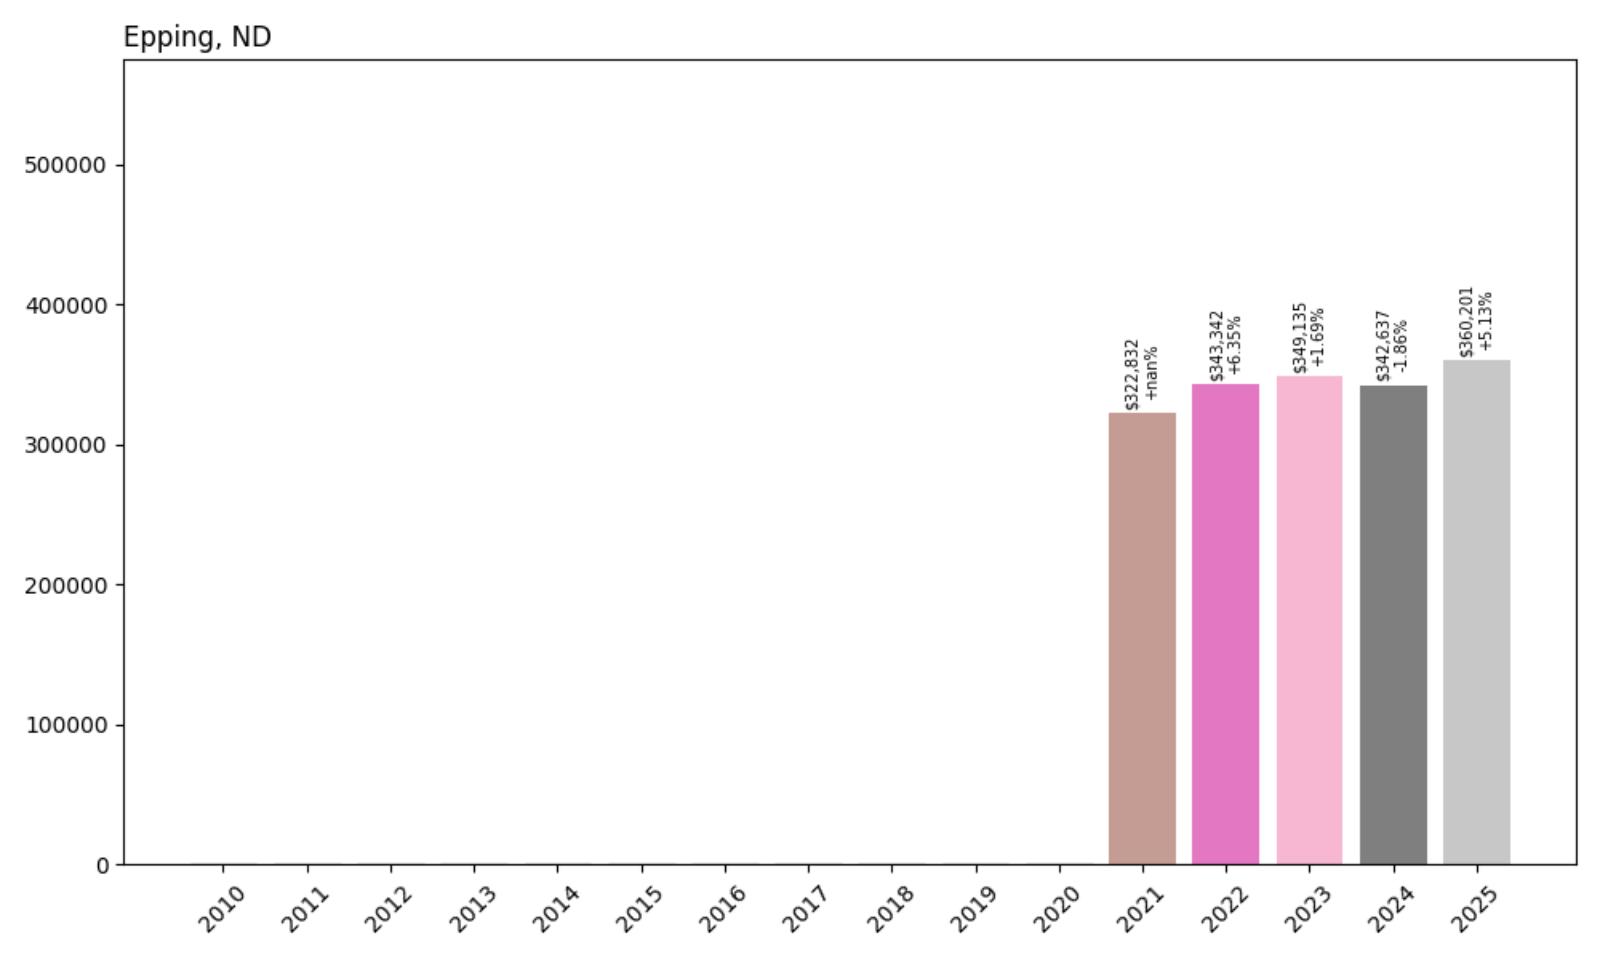
- 2021: $322,832
- 2022: $343,342 (+$20,510, +6.35% from previous year)
- 2023: $349,135 (+$5,793, +1.69% from previous year)
- 2024: $342,637 (−$6,499, −1.86% from previous year)
- 2025: $360,201 (+$17,565, +5.13% from previous year)
Epping’s housing market shows a pattern of growth and adjustment typical of oil-dependent communities, with median prices rising from $322,832 in 2021 to $360,201 in 2025. The market peaked in 2023 before experiencing a modest correction in 2024, followed by a strong 5.13% recovery in 2025. This volatility reflects the ongoing adaptation of energy-dependent communities to changing market conditions.
Epping – Energy Hub With Resilient Market

Located in Williams County near the Montana border, Epping sits in the center of North Dakota’s most productive oil-producing region. This small community of approximately 100 residents has been transformed by its proximity to major Bakken oil operations, creating new economic opportunities and housing demand. The town’s location along Highway 2 provides convenient access to drilling sites and energy infrastructure throughout the western oil fields.
Despite its small size, Epping’s median home prices exceeding $360,000 demonstrate the lasting impact of energy development on western North Dakota real estate markets. The community benefits from its strategic location near major oil infrastructure while offering small-town living that appeals to energy workers seeking alternatives to larger, more congested oil cities. The market’s resilience indicates continued confidence in the area’s long-term energy production prospects.
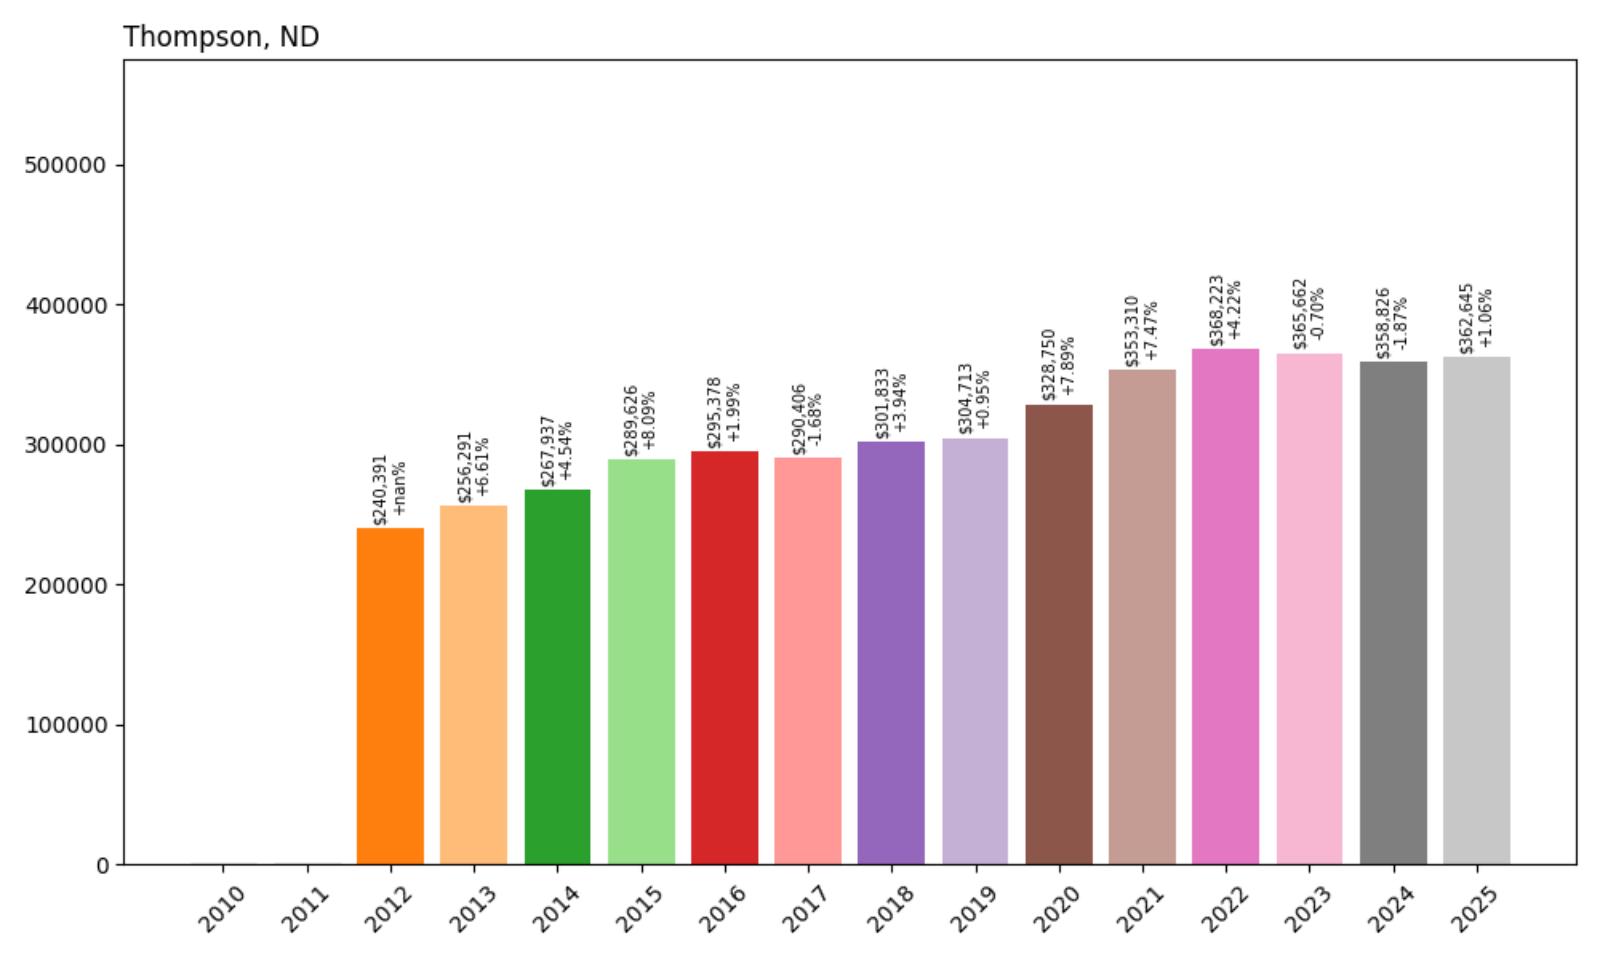
13. Thompson – Steady Appreciation Near Grand Forks
- 2010: N/A
- 2011: N/A
- 2012: $240,391
- 2013: $256,291 (+$15,900, +6.61% from previous year)
- 2014: $267,937 (+$11,646, +4.54% from previous year)
- 2015: $289,626 (+$21,689, +8.09% from previous year)
- 2016: $295,378 (+$5,751, +1.99% from previous year)
- 2017: $290,406 (−$4,972, −1.68% from previous year)
- 2018: $301,833 (+$11,428, +3.94% from previous year)
- 2019: $304,713 (+$2,880, +0.95% from previous year)
- 2020: $328,750 (+$24,037, +7.89% from previous year)
- 2021: $353,310 (+$24,561, +7.47% from previous year)
- 2022: $368,223 (+$14,913, +4.22% from previous year)
- 2023: $365,662 (−$2,562, −0.70% from previous year)
- 2024: $358,826 (−$6,836, −1.87% from previous year)
- 2025: $362,645 (+$3,819, +1.06% from previous year)
Thompson’s housing market has shown solid long-term appreciation with median home prices rising 51% since 2012 to reach $362,645 in 2025. The market demonstrated particular strength during 2020-2022, when prices jumped by nearly 12% annually, before moderating in recent years. The current price level reflects Thompson’s position as a desirable residential community in eastern North Dakota.
Thompson – Agricultural Center With Suburban Appeal
Located in Grand Forks County approximately 15 miles south of Grand Forks, Thompson serves as both an agricultural hub and an increasingly popular bedroom community for the region’s largest city. With roughly 1,000 residents, this community offers small-town charm while providing convenient access to Grand Forks’ employment opportunities, including the University of North Dakota, Altru Health System, and various manufacturing facilities. The town’s location along Highway 2 ensures easy commuting access.
The housing market’s strong performance reflects Thompson’s dual appeal as an agricultural center and suburban alternative to Grand Forks living. The community benefits from the stability of agricultural employment while attracting residents who prefer smaller-town living but work in the larger metropolitan area. Strong appreciation during 2020-2022 coincided with increased interest in suburban and rural living options driven partly by remote work trends and lifestyle preferences.
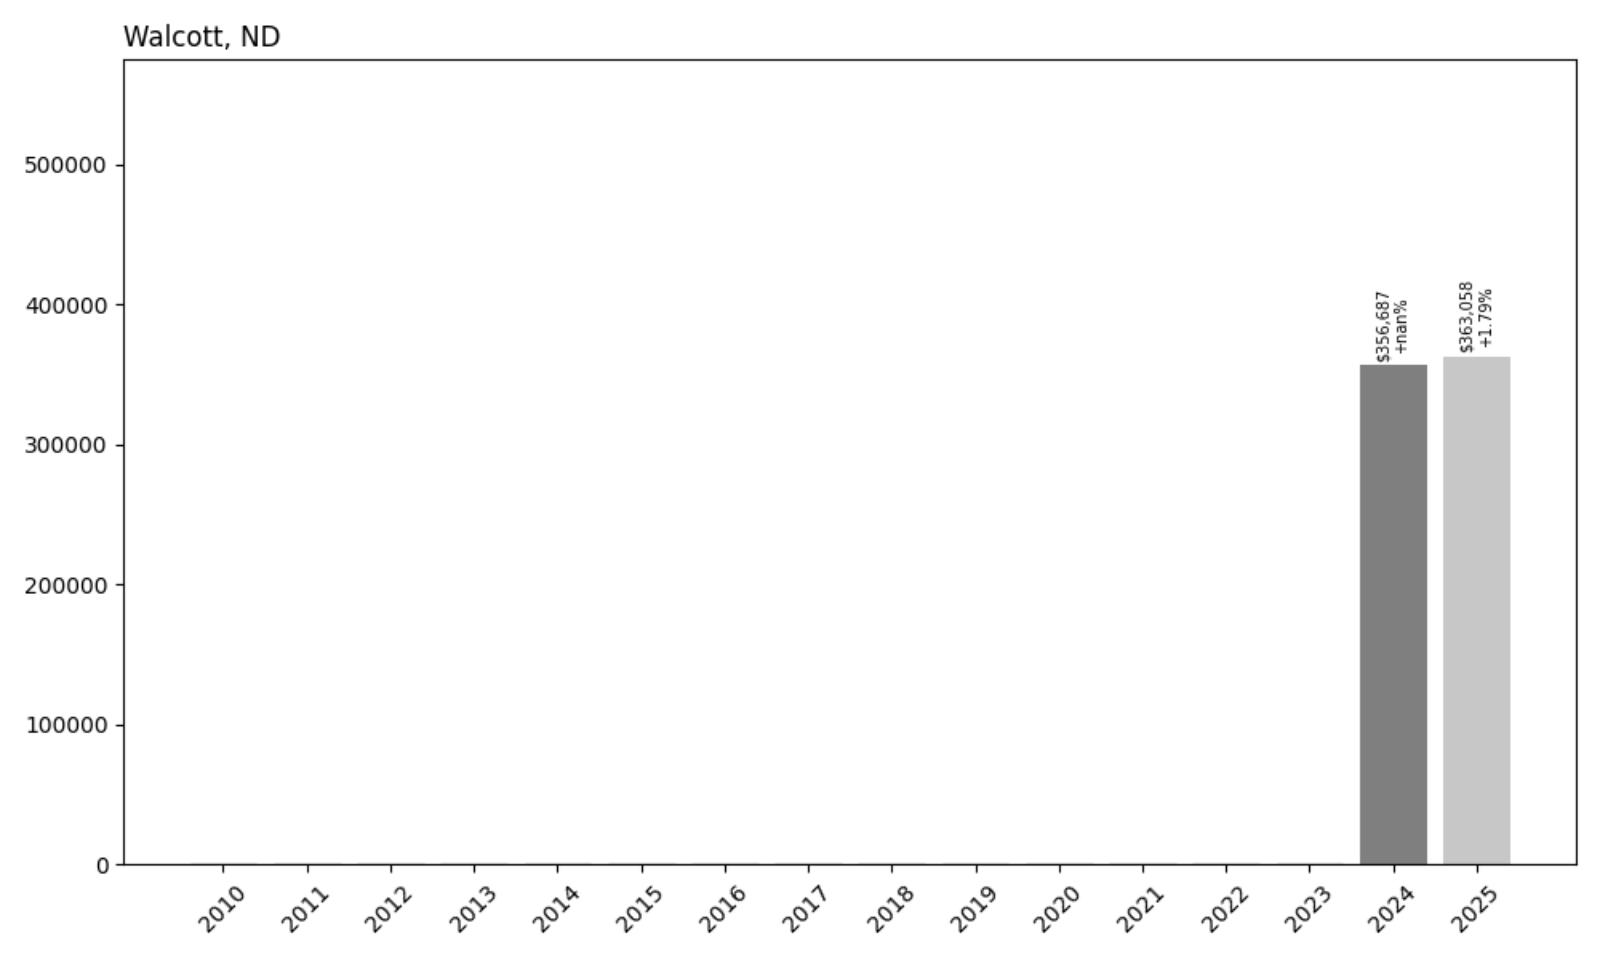
12. Walcott – Premium Rural Market
- 2010: N/A
- 2011: N/A
- 2012: N/A
- 2013: N/A
- 2014: N/A
- 2015: N/A
- 2016: N/A
- 2017: N/A
- 2018: N/A
- 2019: N/A
- 2020: N/A
- 2021: N/A
- 2022: N/A
- 2023: N/A
- 2024: $356,687
- 2025: $363,058 (+$6,371, +1.79% from previous year)
Walcott’s housing market data covers only the past two years, showing modest but steady appreciation with a 1.79% increase bringing median home prices to $363,058 in 2025. This small Richland County community demonstrates how even tiny rural markets can command substantial home values in North Dakota’s elevated real estate environment.
Walcott – Small Town, Big Prices
Located in Richland County in southeastern North Dakota, Walcott is a small agricultural community with fewer than 200 residents that has achieved premium pricing levels despite its rural setting. The town sits in the fertile Red River Valley, contributing to local economic stability through agriculture while maintaining the appeal of small-town living. Despite its tiny size, Walcott’s median home prices exceeding $360,000 reflect the broader elevation of real estate values across the state.
Walcott’s ability to command home prices above $360,000 demonstrates how North Dakota’s resource-based economy has lifted property values throughout the state, even in its smallest communities. The town benefits from productive agricultural land and proximity to regional centers while maintaining rural character that appeals to certain buyer segments. This combination of agricultural economics and lifestyle appeal supports premium pricing despite the limited market size.
11. Bismarck – 109% Home Price Increase Since 2010
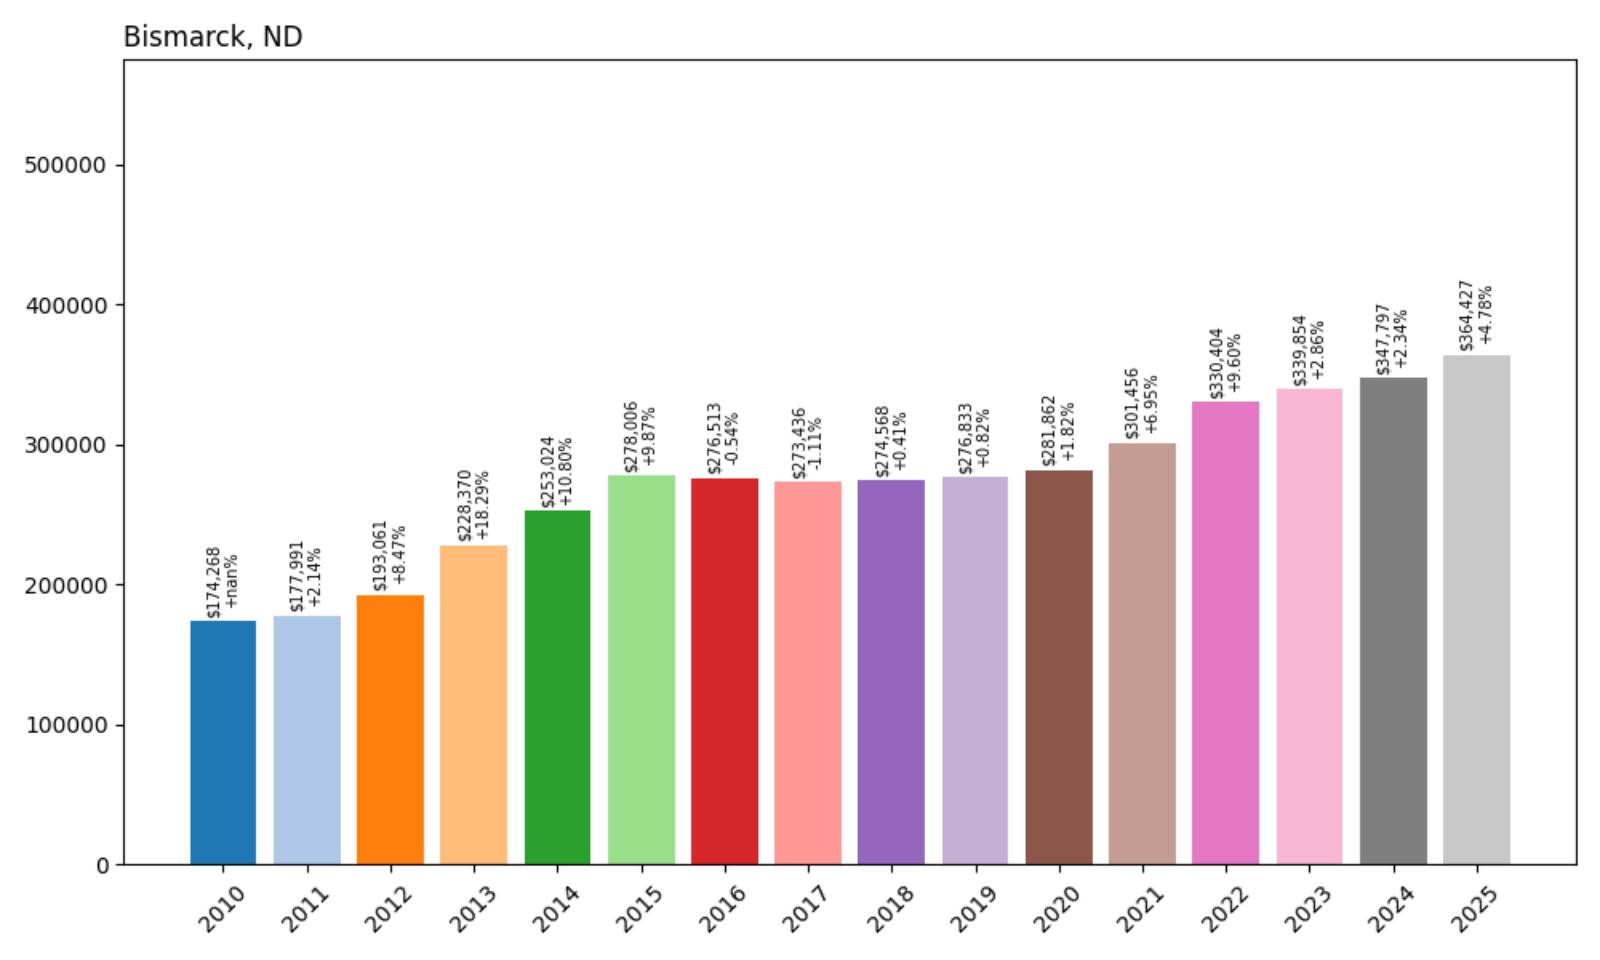
- 2010: $174,268
- 2011: $177,991 (+$3,723, +2.14% from previous year)
- 2012: $193,061 (+$15,070, +8.47% from previous year)
- 2013: $228,370 (+$35,308, +18.29% from previous year)
- 2014: $253,024 (+$24,654, +10.80% from previous year)
- 2015: $278,006 (+$24,982, +9.87% from previous year)
- 2016: $276,513 (−$1,493, −0.54% from previous year)
- 2017: $273,436 (−$3,077, −1.11% from previous year)
- 2018: $274,568 (+$1,132, +0.41% from previous year)
- 2019: $276,833 (+$2,265, +0.82% from previous year)
- 2020: $281,862 (+$5,029, +1.82% from previous year)
- 2021: $301,456 (+$19,594, +6.95% from previous year)
- 2022: $330,404 (+$28,948, +9.60% from previous year)
- 2023: $339,854 (+$9,450, +2.86% from previous year)
- 2024: $347,797 (+$7,943, +2.34% from previous year)
- 2025: $364,427 (+$16,631, +4.78% from previous year)
Bismarck’s housing market has more than doubled since 2010, with median home prices rising 109% to reach $364,427 in 2025. The market experienced explosive growth during 2012-2015, driven by the oil boom’s economic spillover effects, followed by a period of stabilization through 2020. Strong appreciation has resumed since 2021, reflecting the capital city’s continued appeal and economic stability.
Bismarck – State Capital Commands Premium Prices
As North Dakota’s state capital and second-largest city, Bismarck anchors the central region with a diverse economy built around government employment, healthcare, energy, and agriculture. With approximately 75,000 residents in the metropolitan area, the city benefits from economic stability that comes with being the seat of state government, home to major healthcare systems like Sanford Health and CHI St. Alexius, and a regional hub for energy and agricultural businesses. This economic diversity has supported consistent housing demand even during periods of volatility in other sectors.
Recent strong price appreciation reflects renewed confidence in Bismarck’s long-term prospects and its appeal as a high-quality place to live and work. The city offers excellent schools, recreational amenities including the Missouri River corridor, and cultural attractions that support property values. Government employment provides stability, while the city’s role as a regional center for healthcare, finance, and business services creates sustained demand for housing across all price ranges. The 4.78% gain in 2025 suggests continued momentum in this stable market.
10. Williston – 79% Home Price Increase Since 2010
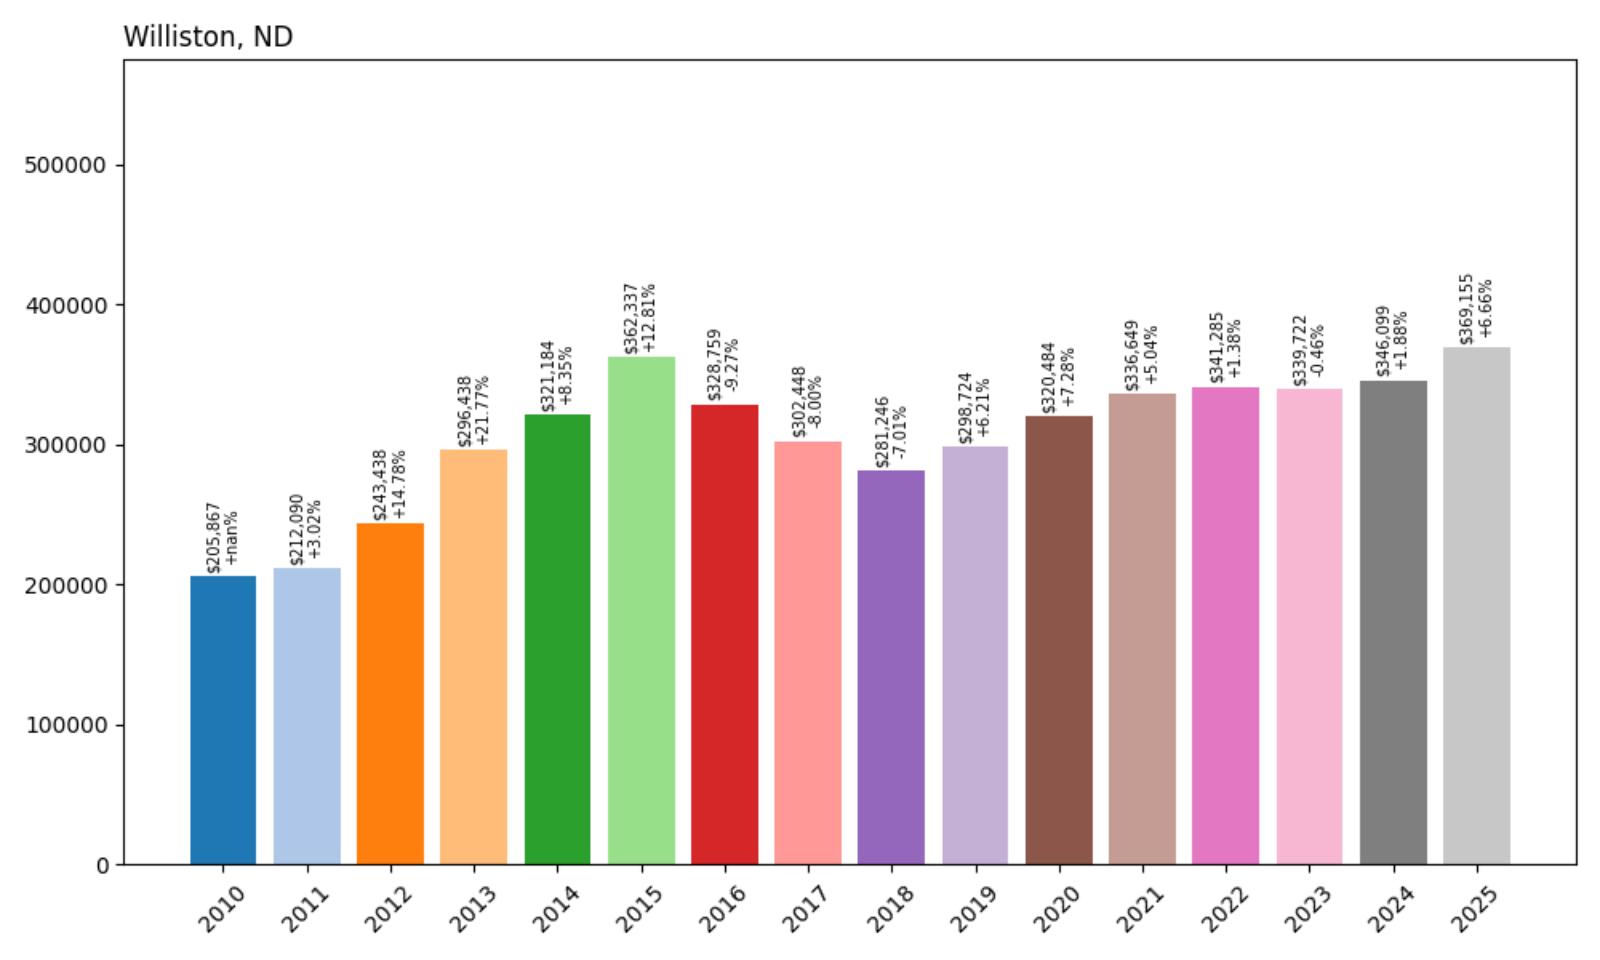
- 2010: $205,867
- 2011: $212,090 (+$6,223, +3.02% from previous year)
- 2012: $243,438 (+$31,348, +14.78% from previous year)
- 2013: $296,438 (+$53,000, +21.77% from previous year)
- 2014: $321,184 (+$24,746, +8.35% from previous year)
- 2015: $362,337 (+$41,153, +12.81% from previous year)
- 2016: $328,759 (−$33,578, −9.27% from previous year)
- 2017: $302,448 (−$26,312, −8.00% from previous year)
- 2018: $281,246 (−$21,201, −7.01% from previous year)
- 2019: $298,724 (+$17,478, +6.21% from previous year)
- 2020: $320,484 (+$21,760, +7.28% from previous year)
- 2021: $336,649 (+$16,165, +5.04% from previous year)
- 2022: $341,285 (+$4,637, +1.38% from previous year)
- 2023: $339,722 (−$1,563, −0.46% from previous year)
- 2024: $346,099 (+$6,377, +1.88% from previous year)
- 2025: $369,155 (+$23,056, +6.66% from previous year)
Williston’s housing market epitomizes the boom-bust-recovery cycle of North Dakota’s oil patch, with median home prices rising 79% since 2010 to reach $369,155 in 2025. The market experienced dramatic volatility, peaking at over $362,000 in 2015 before declining by 22% through 2018, then recovering strongly in recent years. The 6.66% gain in 2025 suggests renewed optimism in this northwestern energy hub.
Williston – Oil Capital’s Market Resurgence
Known as the unofficial capital of North Dakota’s oil patch, Williston has been at the epicenter of the state’s energy transformation since the Bakken boom began. This Williams County city of approximately 30,000 residents serves as the primary hub for oil field services, transportation, and worker housing in the western oil fields. Williston’s economy is more directly tied to energy production than any other major North Dakota city, making its housing market particularly sensitive to oil industry cycles.
The housing market’s extreme volatility from 2010-2020 reflected the boom-bust nature of rapid energy development, with explosive growth during the drilling surge followed by sharp corrections as oil prices fell and drilling activity moderated. The peak pricing in 2015 represented unsustainable levels driven by acute housing shortages during the boom’s height. The subsequent correction, while painful, helped establish more realistic market pricing based on long-term economic fundamentals.
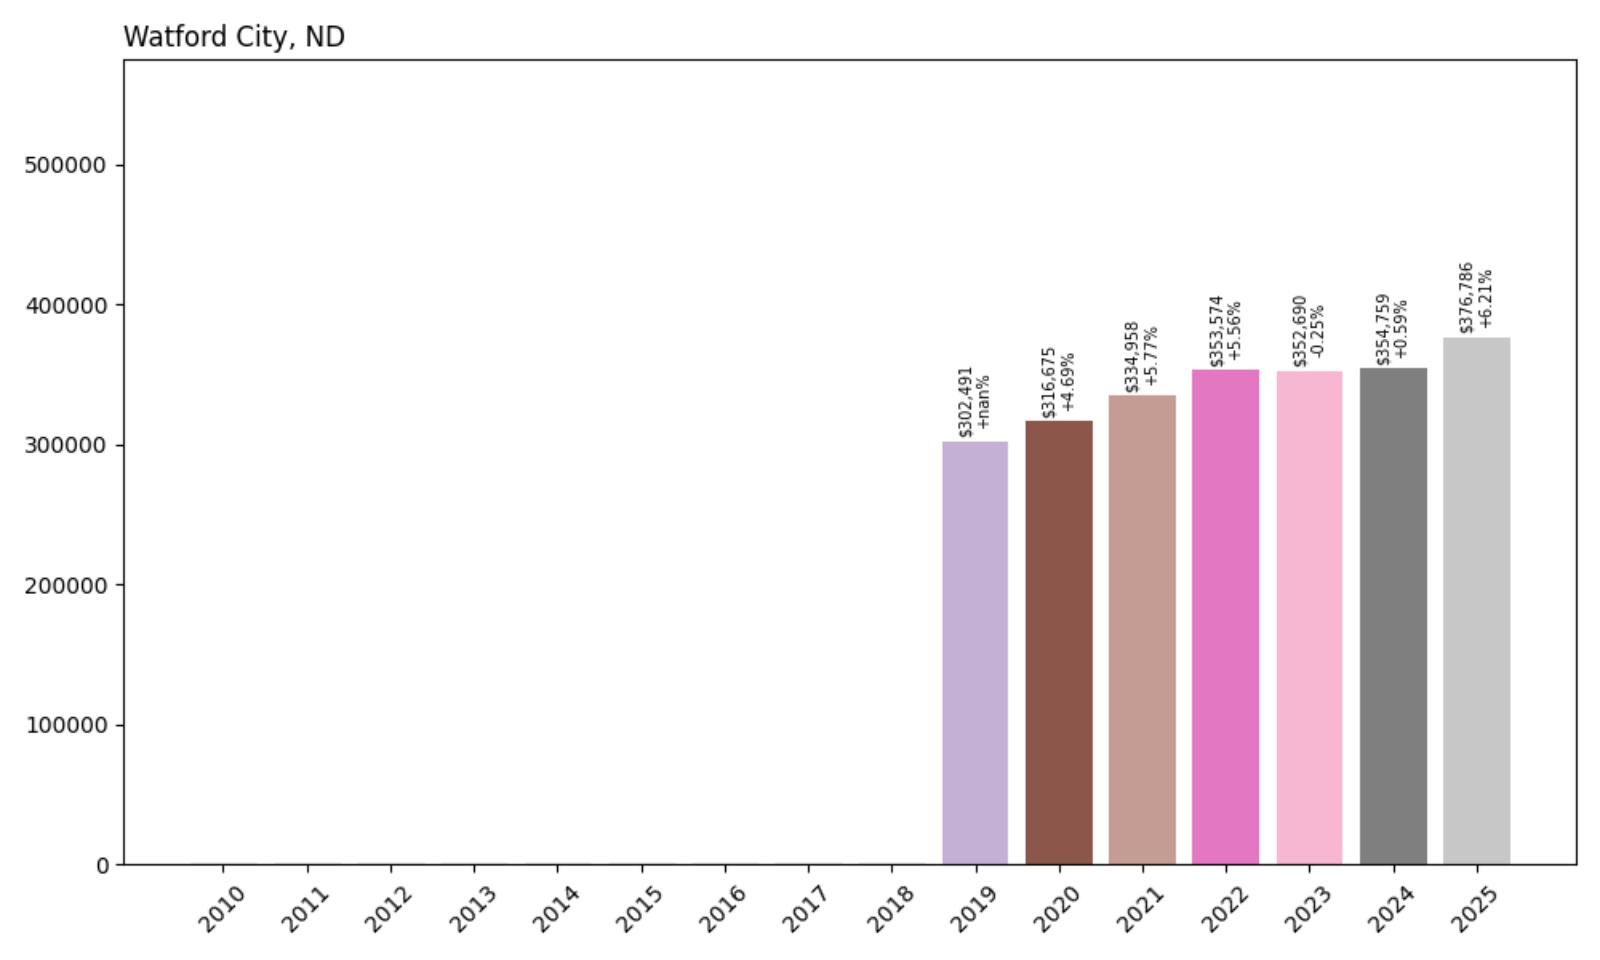
9. Watford City – 25% Home Price Increase Since 2019
- 2010: N/A
- 2011: N/A
- 2012: N/A
- 2013: N/A
- 2014: N/A
- 2015: N/A
- 2016: N/A
- 2017: N/A
- 2018: N/A
- 2019: $302,491
- 2020: $316,675 (+$14,184, +4.69% from previous year)
- 2021: $334,958 (+$18,283, +5.77% from previous year)
- 2022: $353,574 (+$18,615, +5.56% from previous year)
- 2023: $352,690 (−$883, −0.25% from previous year)
- 2024: $354,759 (+$2,069, +0.59% from previous year)
- 2025: $376,786 (+$22,026, +6.21% from previous year)
Watford City’s housing market has shown steady appreciation since data became available in 2019, with median home prices rising 25% to reach $376,786 in 2025. The market demonstrated consistent growth through 2022, stabilized during 2023-2024, and accelerated again with a strong 6.21% gain in 2025. This McKenzie County community has emerged as one of the oil patch’s most successful residential markets.
Watford City – Modern Oil Boom Success Story
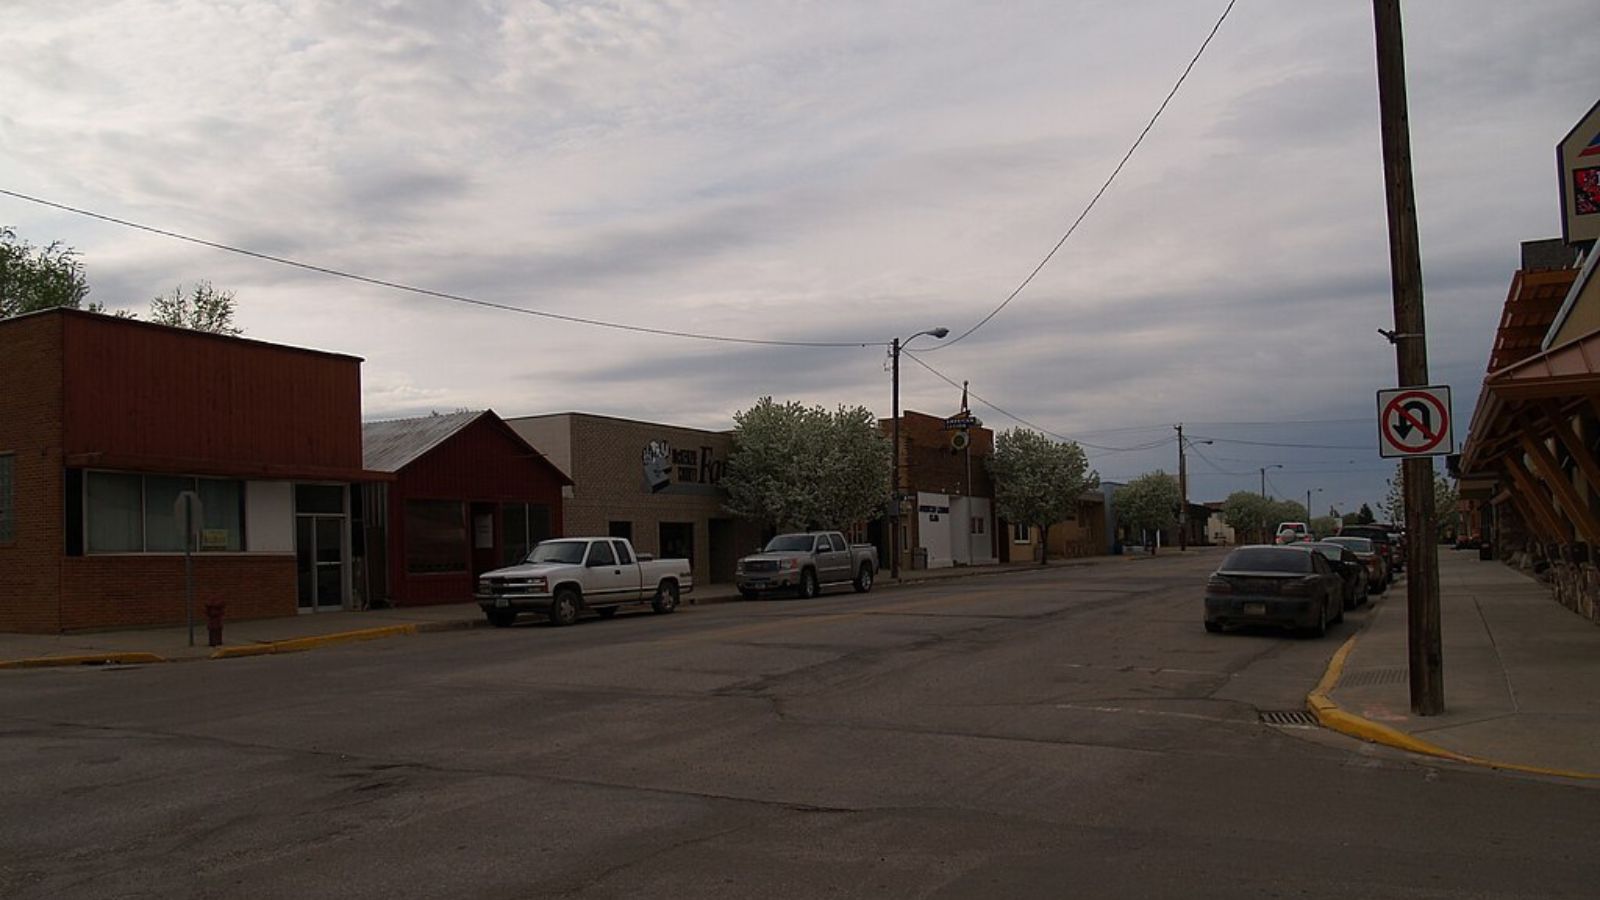
Located in McKenzie County at the heart of the Bakken formation, Watford City has become one of North Dakota’s oil boom success stories, transforming from a sleepy agricultural town of 1,700 residents in 2010 to a thriving energy hub of over 7,000 today. The city serves as the county seat and primary service center for some of the state’s most productive oil fields. Unlike some boom towns that struggled with rapid growth, Watford City has managed its expansion with careful planning and infrastructure investment.
Recent market performance suggests continued optimism about Watford City’s prospects as a major energy hub with quality of life amenities that attract long-term residents and families. The city has successfully balanced rapid economic growth with community development, creating one of western North Dakota’s most livable cities. The strong 6.21% price gain in 2025 reflects both ongoing energy sector strength and the community’s appeal as a place to build a permanent life in the oil patch.
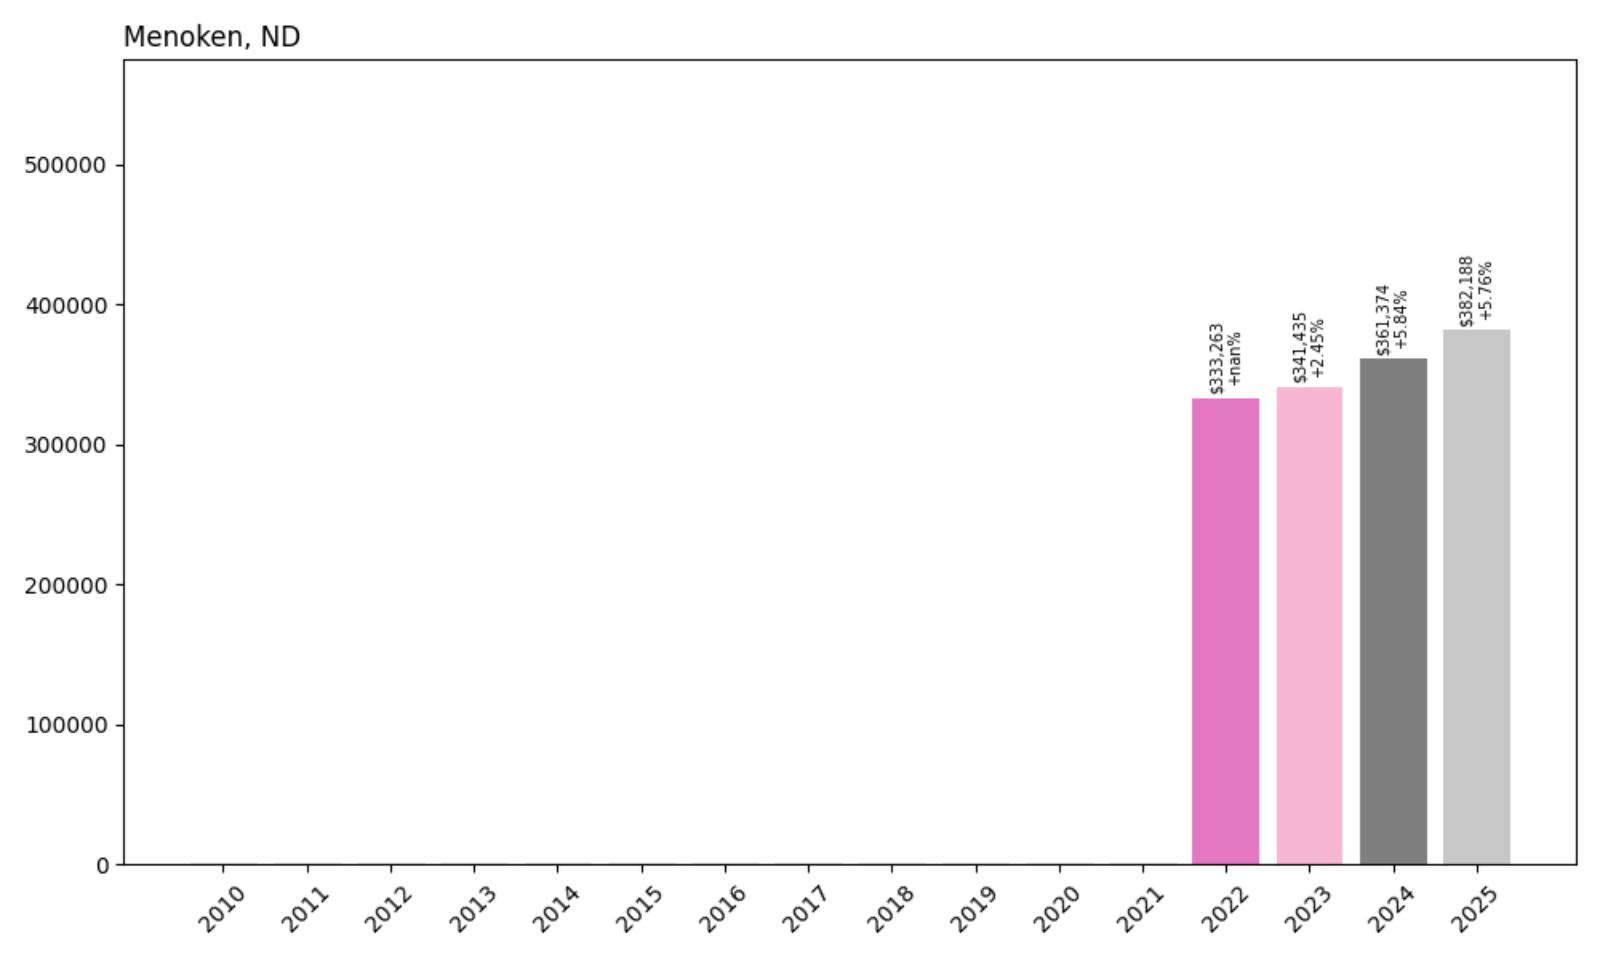
8. Menoken – Rapid Growth Near Bismarck
- 2010: N/A
- 2011: N/A
- 2012: N/A
- 2013: N/A
- 2014: N/A
- 2015: N/A
- 2016: N/A
- 2017: N/A
- 2018: N/A
- 2019: N/A
- 2020: N/A
- 2021: N/A
- 2022: $333,263
- 2023: $341,435 (+$8,172, +2.45% from previous year)
- 2024: $361,374 (+$19,939, +5.84% from previous year)
- 2025: $382,188 (+$20,813, +5.76% from previous year)
Menoken’s housing market has shown impressive momentum since data became available in 2022, with median home prices climbing 15% to reach $382,188 in 2025. The market has demonstrated accelerating growth, with particularly strong gains of 5.84% in 2024 and 5.76% in 2025. This small community near Bismarck represents one of the state’s fastest-appreciating housing markets.
Menoken – Capital Region Bedroom Community
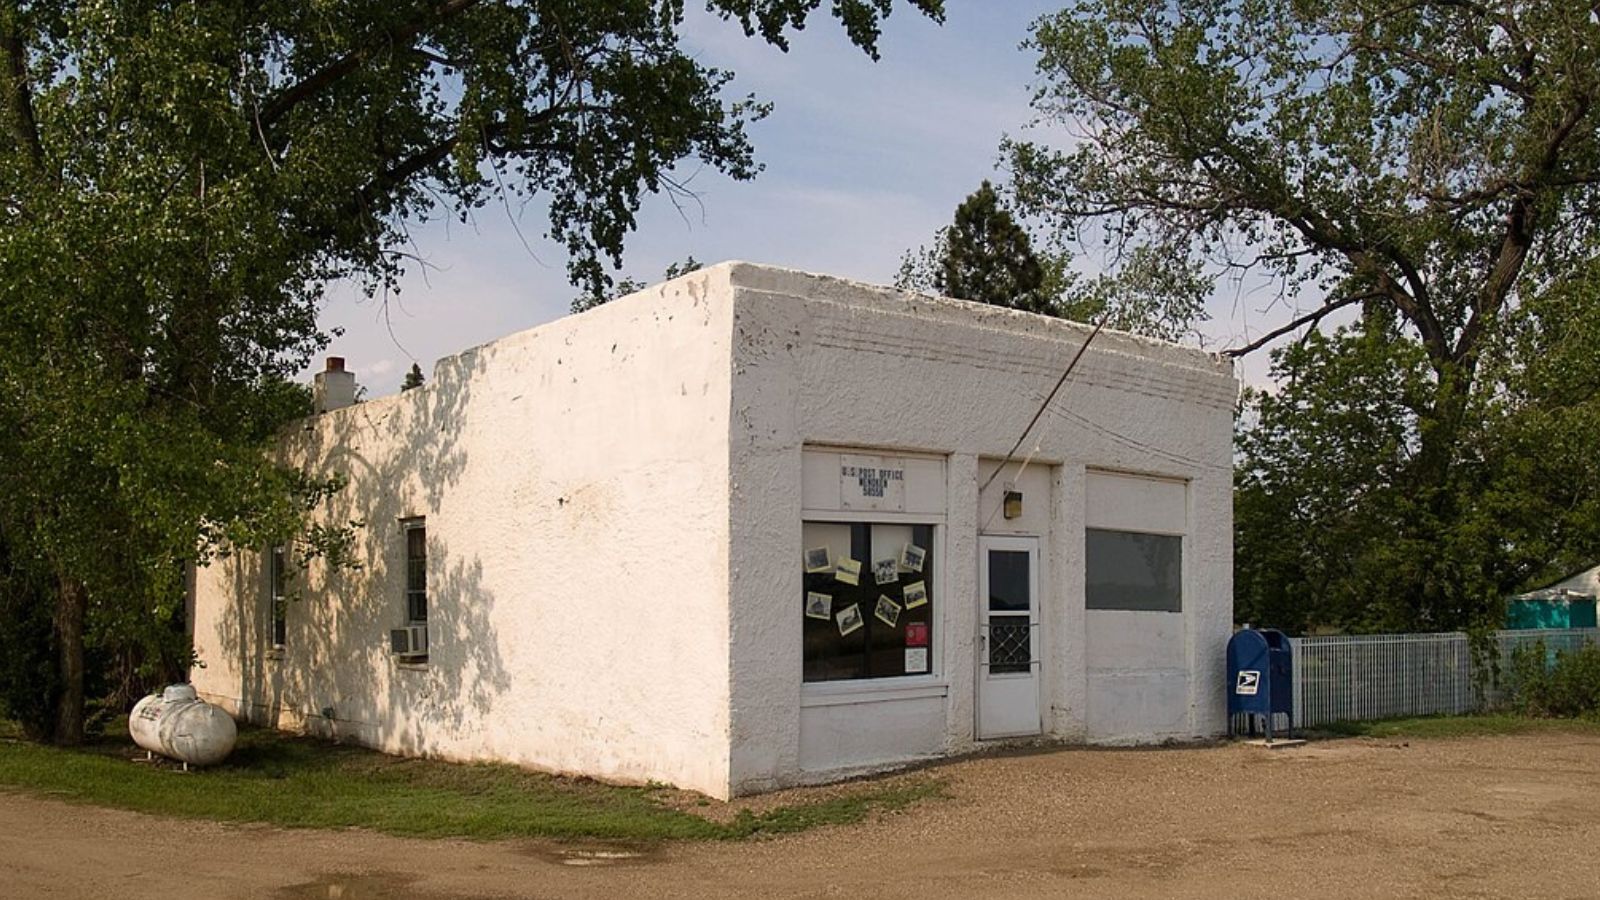
Located in Burleigh County just east of Bismarck, Menoken serves as an increasingly popular bedroom community for the capital region. With fewer than 80 residents, this tiny community offers rural living with convenient access to Bismarck’s employment opportunities and urban amenities. The town’s location along Interstate 94 provides excellent connectivity to the capital city while maintaining a rural character that appeals to buyers seeking alternatives to urban living.
Recent price appreciation has accelerated as more buyers discover Menoken’s appeal as a rural alternative to urban living. The community benefits from excellent highway access, proximity to Bismarck amenities, and the ability to offer larger residential lots at competitive prices compared to capital city options. The consistent 5-6% annual gains in recent years suggest strong demand that continues to outpace the limited housing supply available in this small but strategically located community.
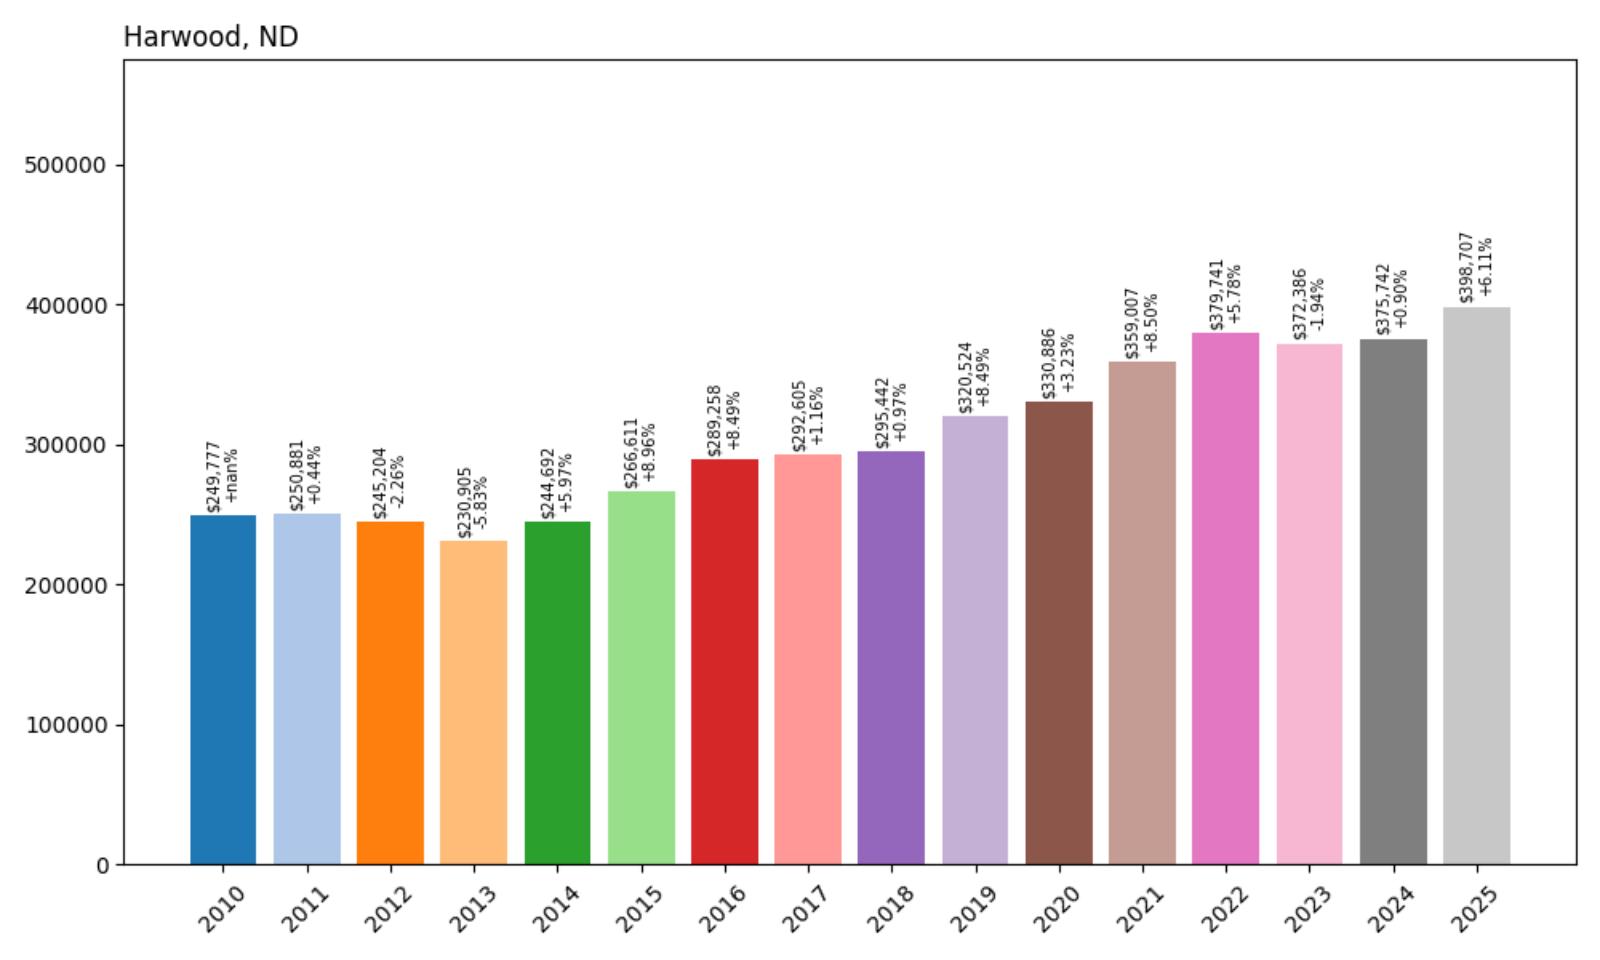
7. Harwood – 60% Home Price Increase Since 2010
- 2010: $249,777
- 2011: $250,881 (+$1,103, +0.44% from previous year)
- 2012: $245,204 (−$5,676, −2.26% from previous year)
- 2013: $230,905 (−$14,299, −5.83% from previous year)
- 2014: $244,692 (+$13,787, +5.97% from previous year)
- 2015: $266,611 (+$21,918, +8.96% from previous year)
- 2016: $289,258 (+$22,647, +8.49% from previous year)
- 2017: $292,605 (+$3,347, +1.16% from previous year)
- 2018: $295,442 (+$2,837, +0.97% from previous year)
- 2019: $320,524 (+$25,083, +8.49% from previous year)
- 2020: $330,886 (+$10,361, +3.23% from previous year)
- 2021: $359,007 (+$28,121, +8.50% from previous year)
- 2022: $379,741 (+$20,734, +5.78% from previous year)
- 2023: $372,386 (−$7,355, −1.94% from previous year)
- 2024: $375,742 (+$3,356, +0.90% from previous year)
- 2025: $398,707 (+$22,965, +6.11% from previous year)
Harwood’s housing market has delivered solid long-term returns with a 60% increase in median home prices since 2010, reaching $398,707 in 2025. The market experienced early volatility including a significant dip in 2013, but has shown strong appreciation since 2015. Recent years brought some moderation through 2024 before a robust 6.11% gain in 2025 pushed prices to new highs.
Harwood – Fargo Suburb With Rural Character
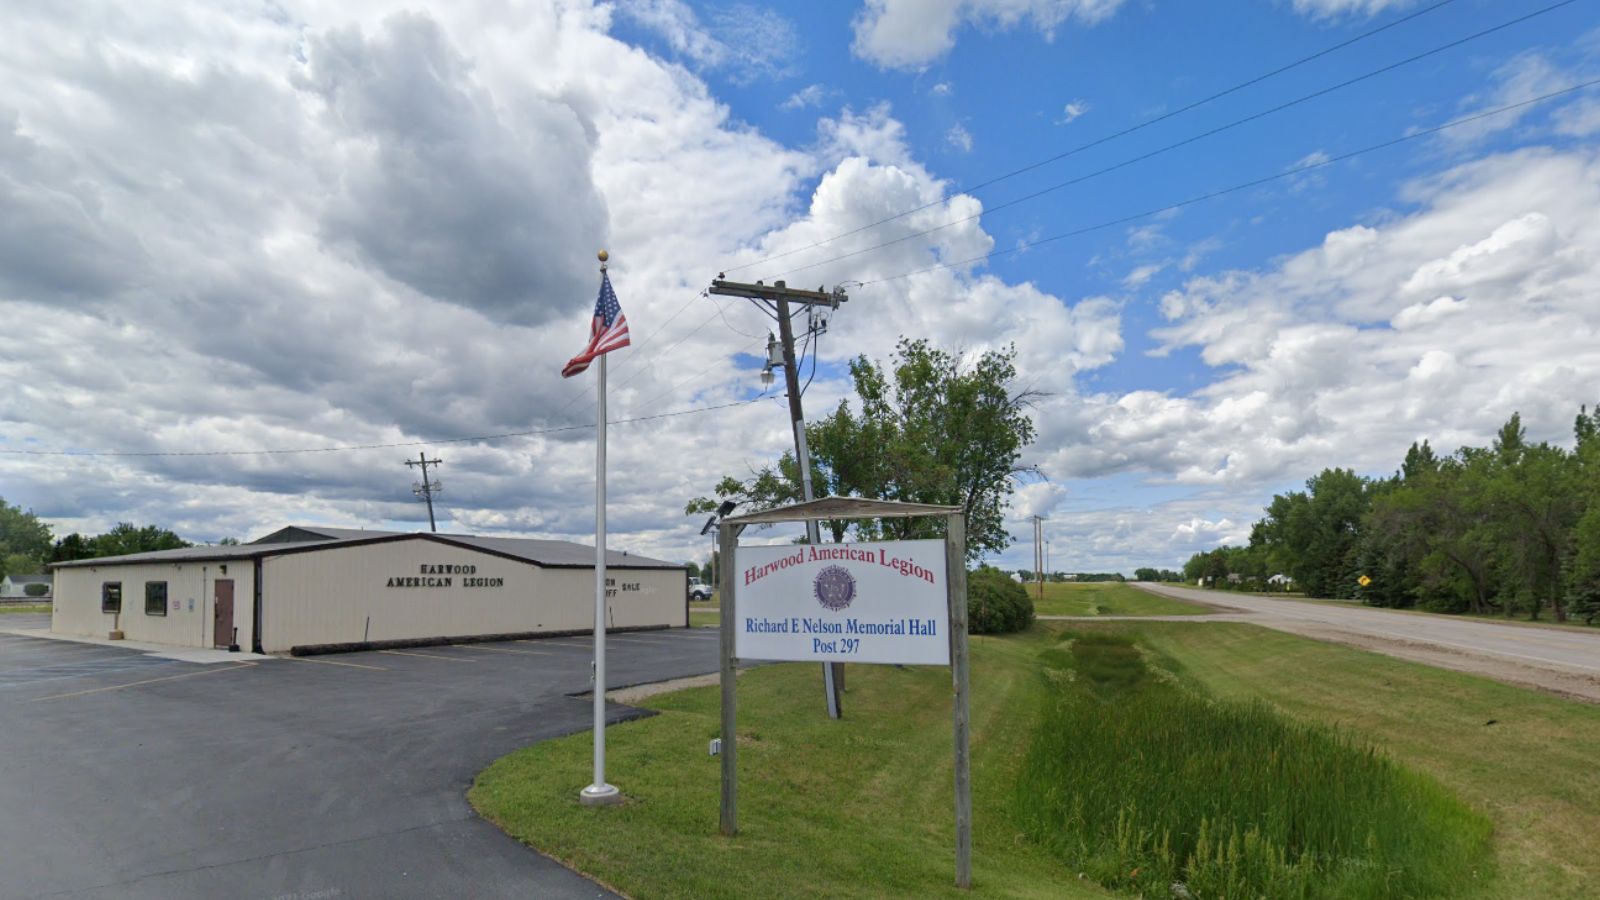
Located in Cass County approximately 15 miles north of Fargo, Harwood combines small-town charm with convenient access to the state’s largest metropolitan area. This community of roughly 700 residents has evolved into a desirable bedroom community for Fargo area workers while maintaining its agricultural roots and rural character. The town’s location provides an attractive alternative to urban living while ensuring easy access to employment, shopping, and cultural amenities.
The housing market’s strong appreciation reflects Harwood’s growing appeal as a suburban alternative that offers larger lots, newer homes, and small-town atmosphere without sacrificing access to metropolitan amenities. The community has experienced steady population growth as families seek alternatives to Fargo’s denser development and higher prices. Strong gains in 2019, 2021, and 2025 coincided with periods of increased interest in suburban and rural living options.
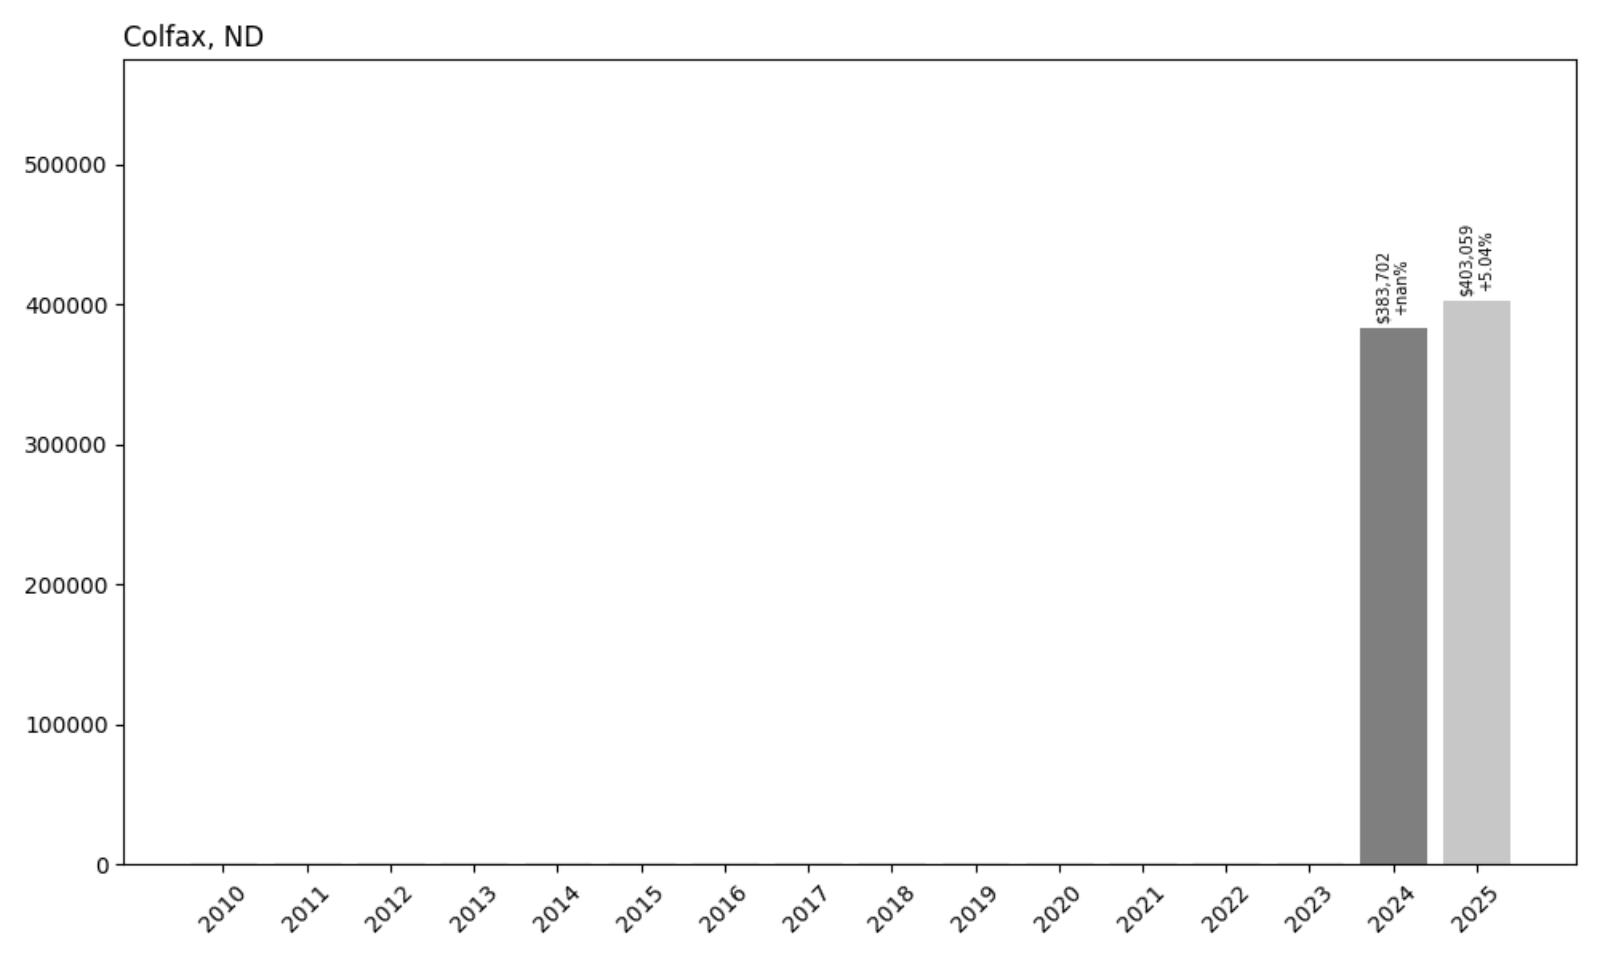
6. Colfax – 5% Home Price Increase Since 2024
- 2010: N/A
- 2011: N/A
- 2012: N/A
- 2013: N/A
- 2014: N/A
- 2015: N/A
- 2016: N/A
- 2017: N/A
- 2018: N/A
- 2019: N/A
- 2020: N/A
- 2021: N/A
- 2022: N/A
- 2023: N/A
- 2024: $383,702
- 2025: $403,059 (+$19,357, +5.04% from previous year)
Colfax’s housing market data covers only the past two years, showing solid appreciation with a 5.04% increase bringing median home prices to $403,059 in 2025. This small Richland County community demonstrates how even tiny rural markets can achieve premium pricing levels that rank among North Dakota’s most expensive residential markets.
Colfax – Premium Rural Market Excellence
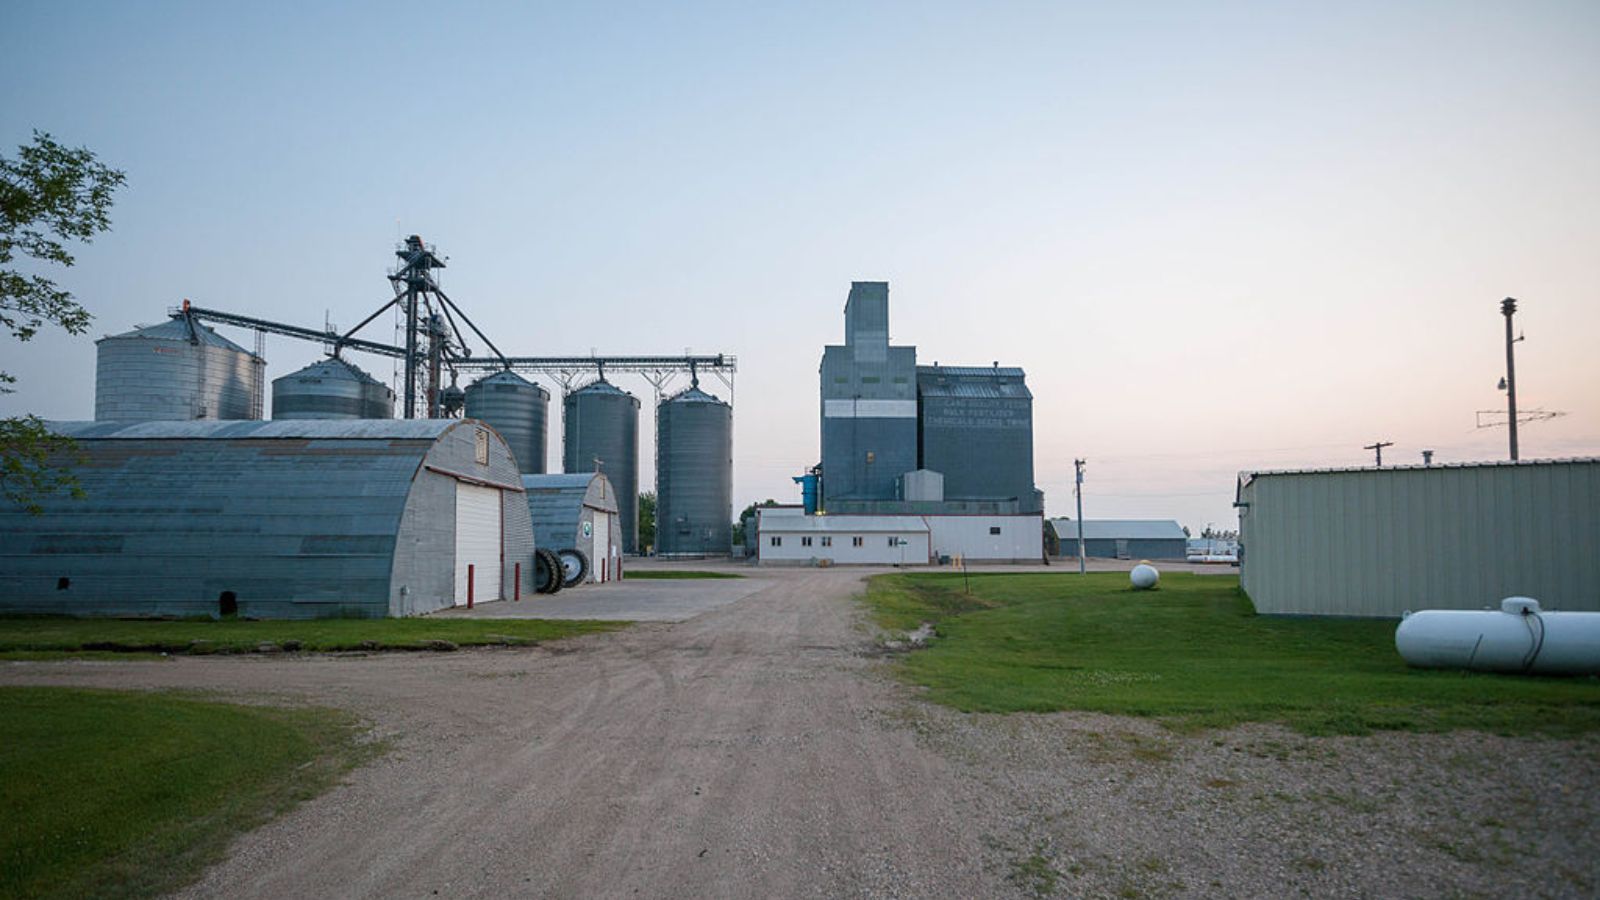
Located in Richland County in southeastern North Dakota, Colfax is a small agricultural community with fewer than 100 residents that has achieved remarkable home pricing levels approaching $405,000. The town sits in the heart of the Red River Valley’s most productive farmland, contributing to local economic prosperity and property values. Despite its tiny size, Colfax’s median home prices place it among the state’s most expensive communities, reflecting both agricultural success and limited housing supply.
Colfax’s success in commanding home prices above $400,000 illustrates the broader transformation of North Dakota’s rural real estate markets, where agricultural prosperity and lifestyle appeal have created premium pricing even in tiny communities. The town benefits from productive farmland, proximity to regional employment centers, and the appeal of rural living for buyers seeking alternatives to urban markets. This combination supports exceptional pricing levels that reflect both economic fundamentals and quality of life factors.
5. Horace – 79% Home Price Increase Since 2010
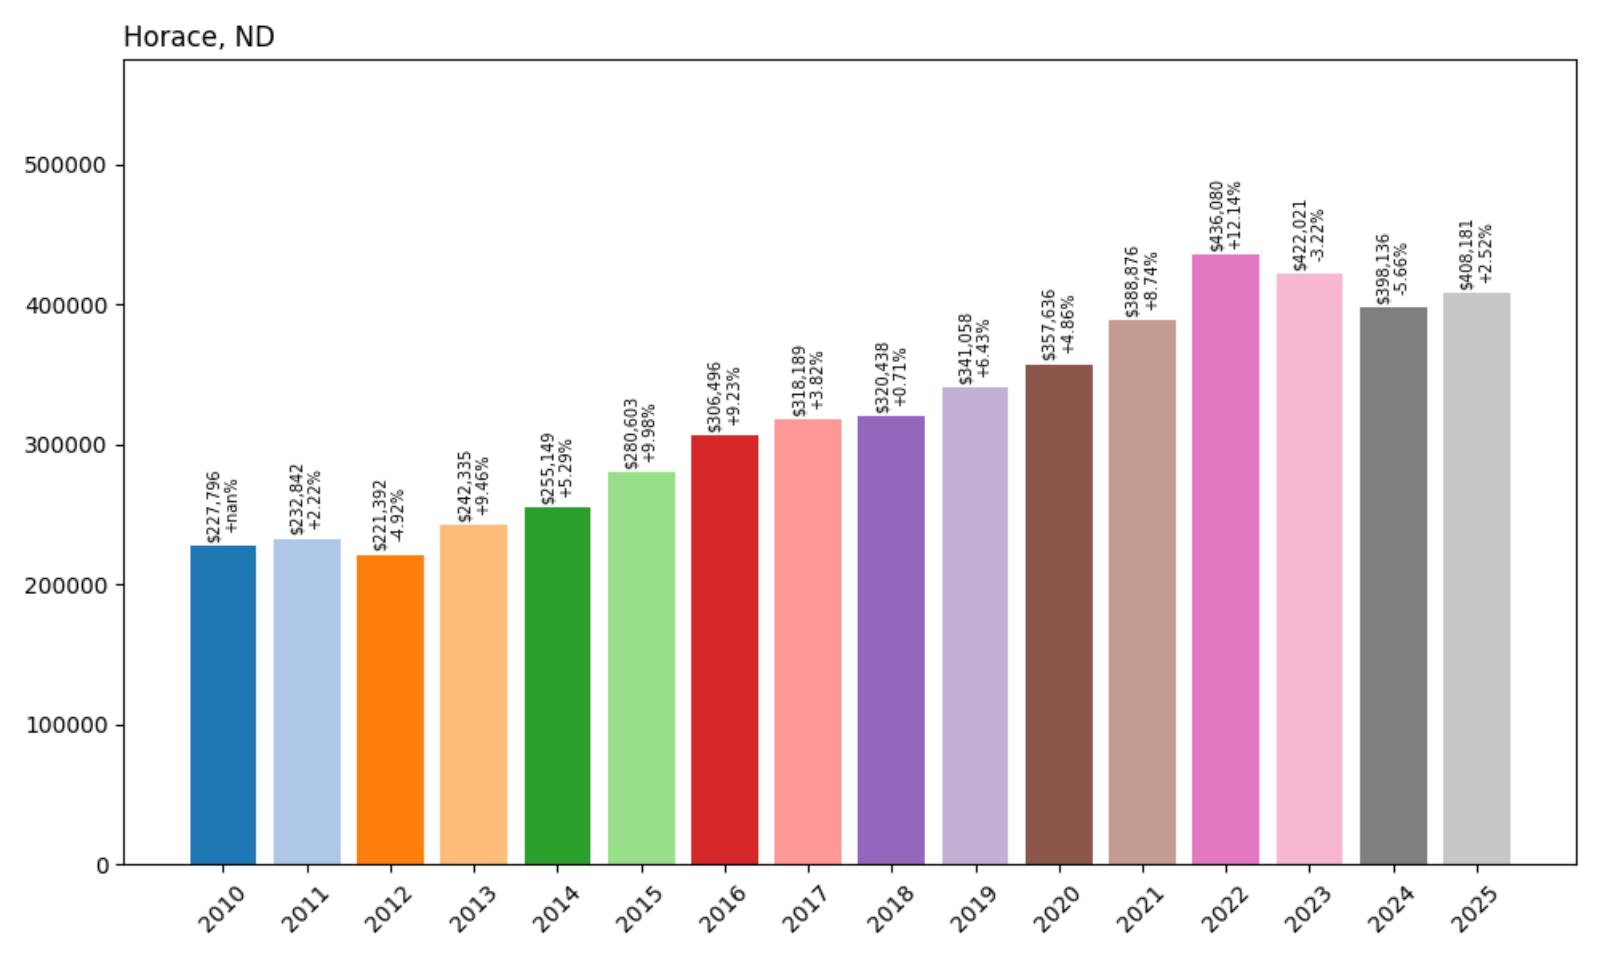
- 2010: $227,796
- 2011: $232,842 (+$5,046, +2.22% from previous year)
- 2012: $221,392 (−$11,450, −4.92% from previous year)
- 2013: $242,335 (+$20,943, +9.46% from previous year)
- 2014: $255,149 (+$12,814, +5.29% from previous year)
- 2015: $280,603 (+$25,454, +9.98% from previous year)
- 2016: $306,496 (+$25,893, +9.23% from previous year)
- 2017: $318,189 (+$11,693, +3.82% from previous year)
- 2018: $320,438 (+$2,249, +0.71% from previous year)
- 2019: $341,058 (+$20,620, +6.43% from previous year)
- 2020: $357,636 (+$16,578, +4.86% from previous year)
- 2021: $388,876 (+$31,240, +8.74% from previous year)
- 2022: $436,080 (+$47,204, +12.14% from previous year)
- 2023: $422,021 (−$14,060, −3.22% from previous year)
- 2024: $398,136 (−$23,885, −5.66% from previous year)
- 2025: $408,181 (+$10,045, +2.52% from previous year)
Horace’s housing market has shown impressive long-term growth with a 79% increase in median home prices since 2010, reaching $408,181 in 2025. The market experienced particularly strong momentum from 2015-2022, peaking at over $436,000 before a correction in 2023-2024. The recent recovery suggests stabilization at levels that reflect Horace’s desirability as a premium suburban community near Fargo.
Horace – Premium Fargo Suburb
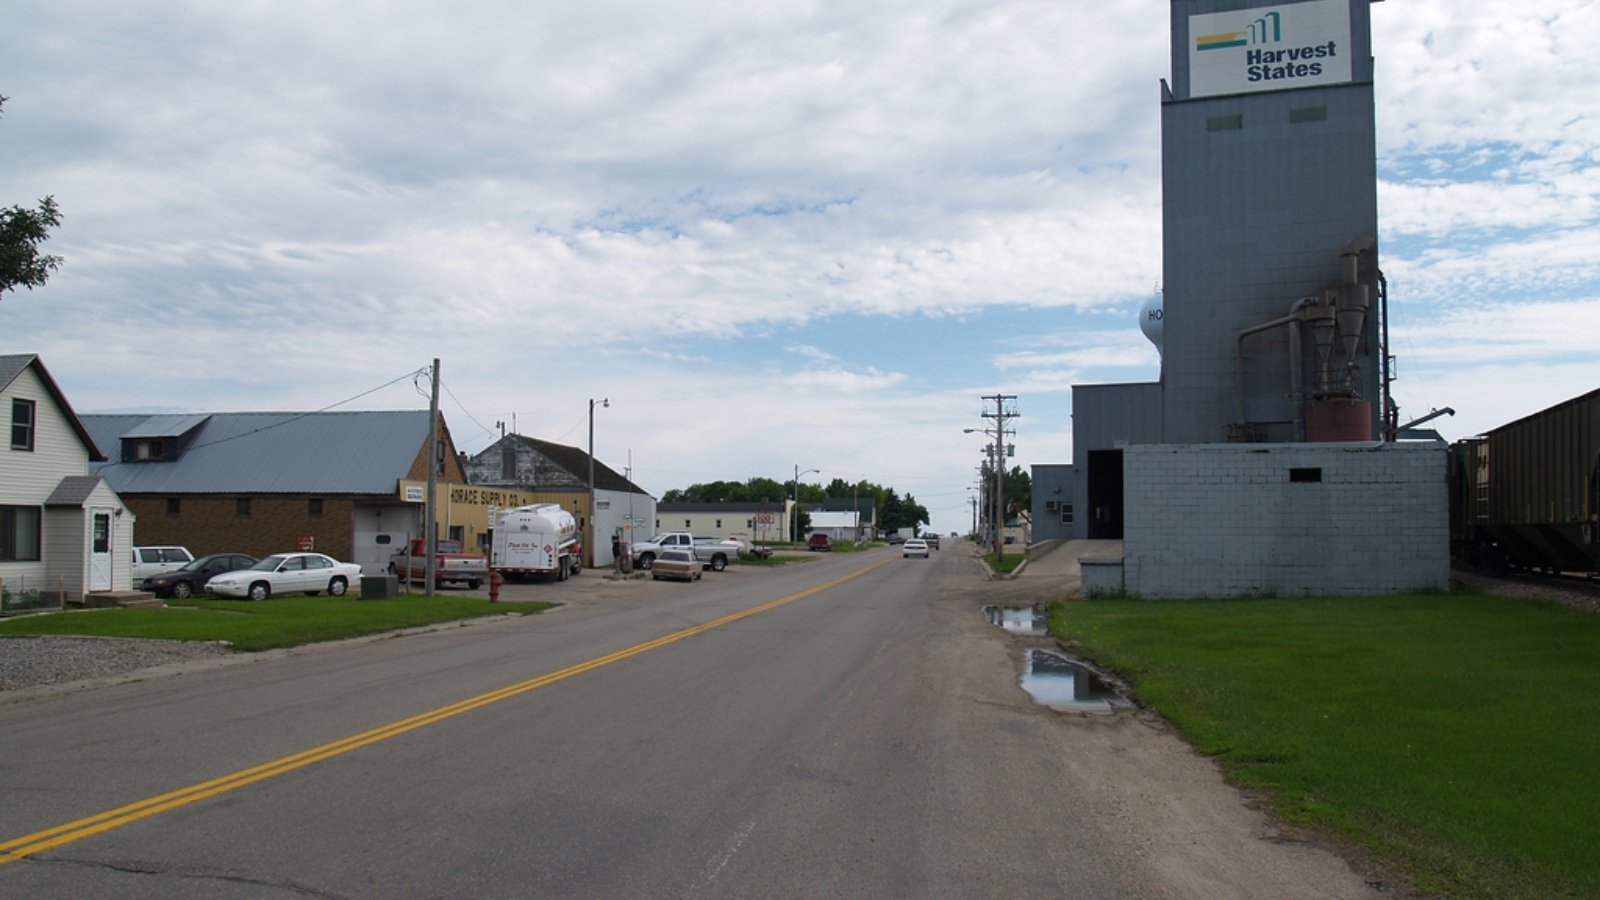
Located in Cass County just southwest of West Fargo, Horace has emerged as one of the region’s most desirable suburban communities, combining small-town charm with proximity to the Fargo metropolitan area. With approximately 3,000 residents, this rapidly growing city offers excellent schools, family-friendly neighborhoods, and easy access to Fargo’s employment and amenities. Horace’s strategic location and community planning have made it particularly attractive to families and professionals seeking high-quality suburban living.
Recent price stabilization and recovery suggest that Horace has found equilibrium as a premium residential market that commands higher prices due to its quality amenities and location advantages. The community continues to attract new residents with its combination of small-town atmosphere, excellent infrastructure, and convenient access to regional employment centers. The moderate recovery in 2025 indicates continued confidence in Horace’s long-term appeal as one of eastern North Dakota’s premier residential communities.
4. Kindred – 92% Home Price Increase Since 2010
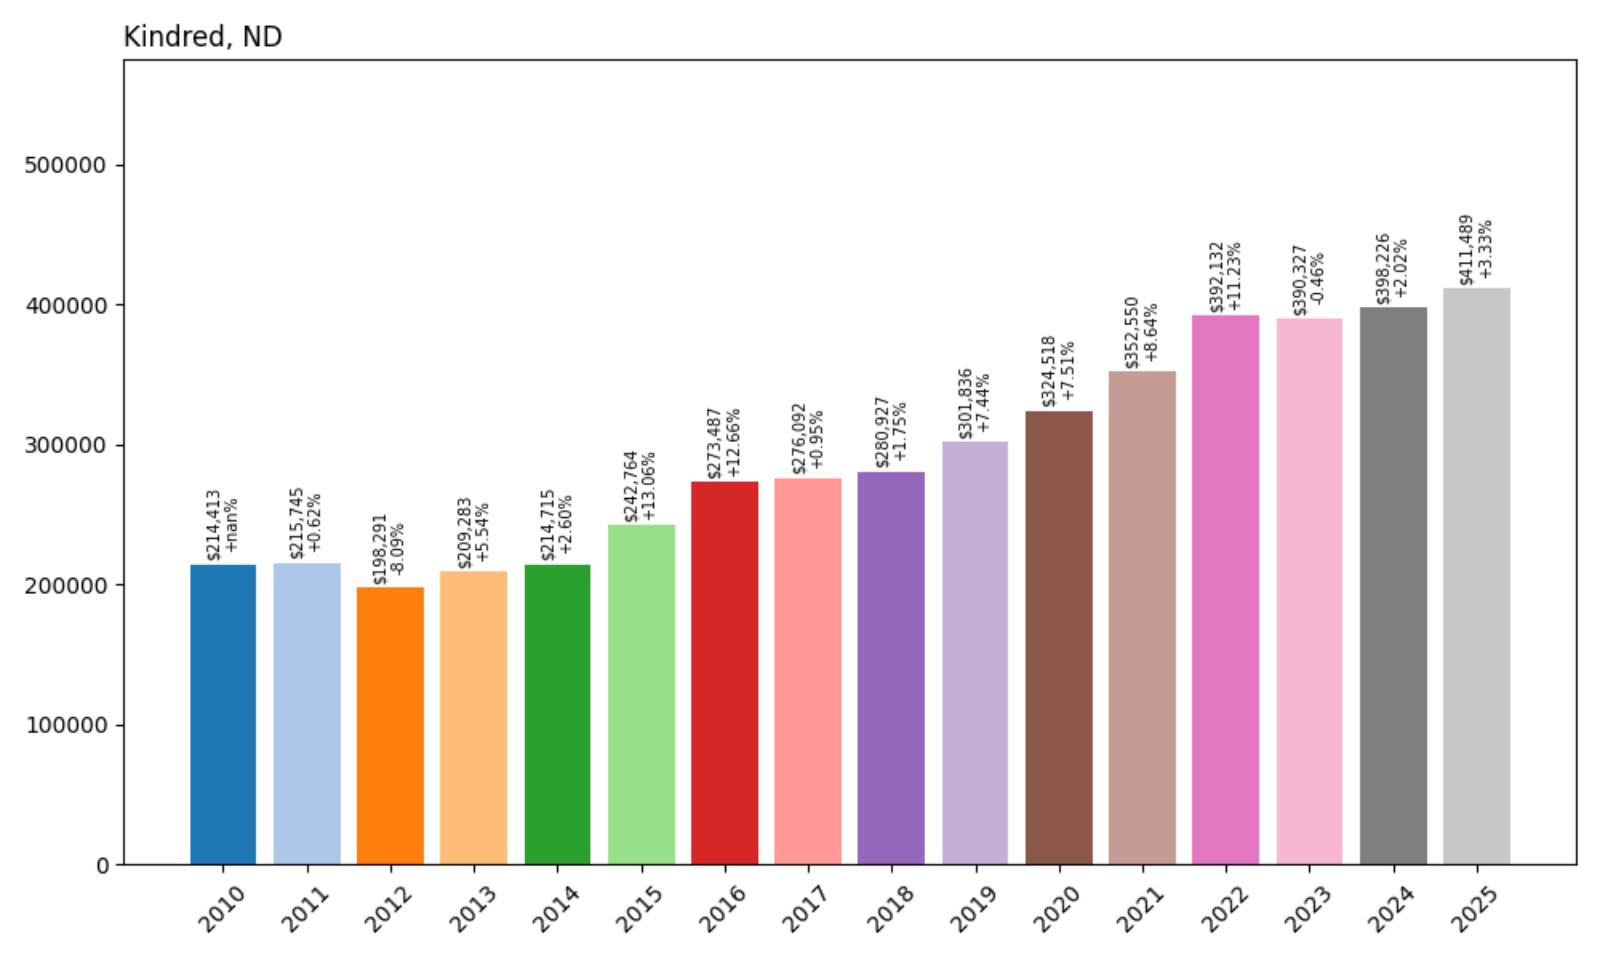
- 2010: $214,413
- 2011: $215,745 (+$1,332, +0.62% from previous year)
- 2012: $198,291 (−$17,454, −8.09% from previous year)
- 2013: $209,283 (+$10,991, +5.54% from previous year)
- 2014: $214,715 (+$5,433, +2.60% from previous year)
- 2015: $242,764 (+$28,048, +13.06% from previous year)
- 2016: $273,487 (+$30,724, +12.66% from previous year)
- 2017: $276,092 (+$2,605, +0.95% from previous year)
- 2018: $280,927 (+$4,835, +1.75% from previous year)
- 2019: $301,836 (+$20,909, +7.44% from previous year)
- 2020: $324,518 (+$22,682, +7.51% from previous year)
- 2021: $352,550 (+$28,032, +8.64% from previous year)
- 2022: $392,132 (+$39,583, +11.23% from previous year)
- 2023: $390,327 (−$1,805, −0.46% from previous year)
- 2024: $398,226 (+$7,899, +2.02% from previous year)
- 2025: $411,489 (+$13,263, +3.33% from previous year)
Kindred’s housing market has nearly doubled since 2010, with median home prices rising 92% to reach $411,489 in 2025. The market showed particularly strong momentum from 2015-2016 and again from 2019-2022, with only minor corrections along the way. The consistent upward trajectory reflects Kindred’s appeal as a desirable residential community in the Fargo metropolitan area.
Kindred – Consistent Growth in Cass County
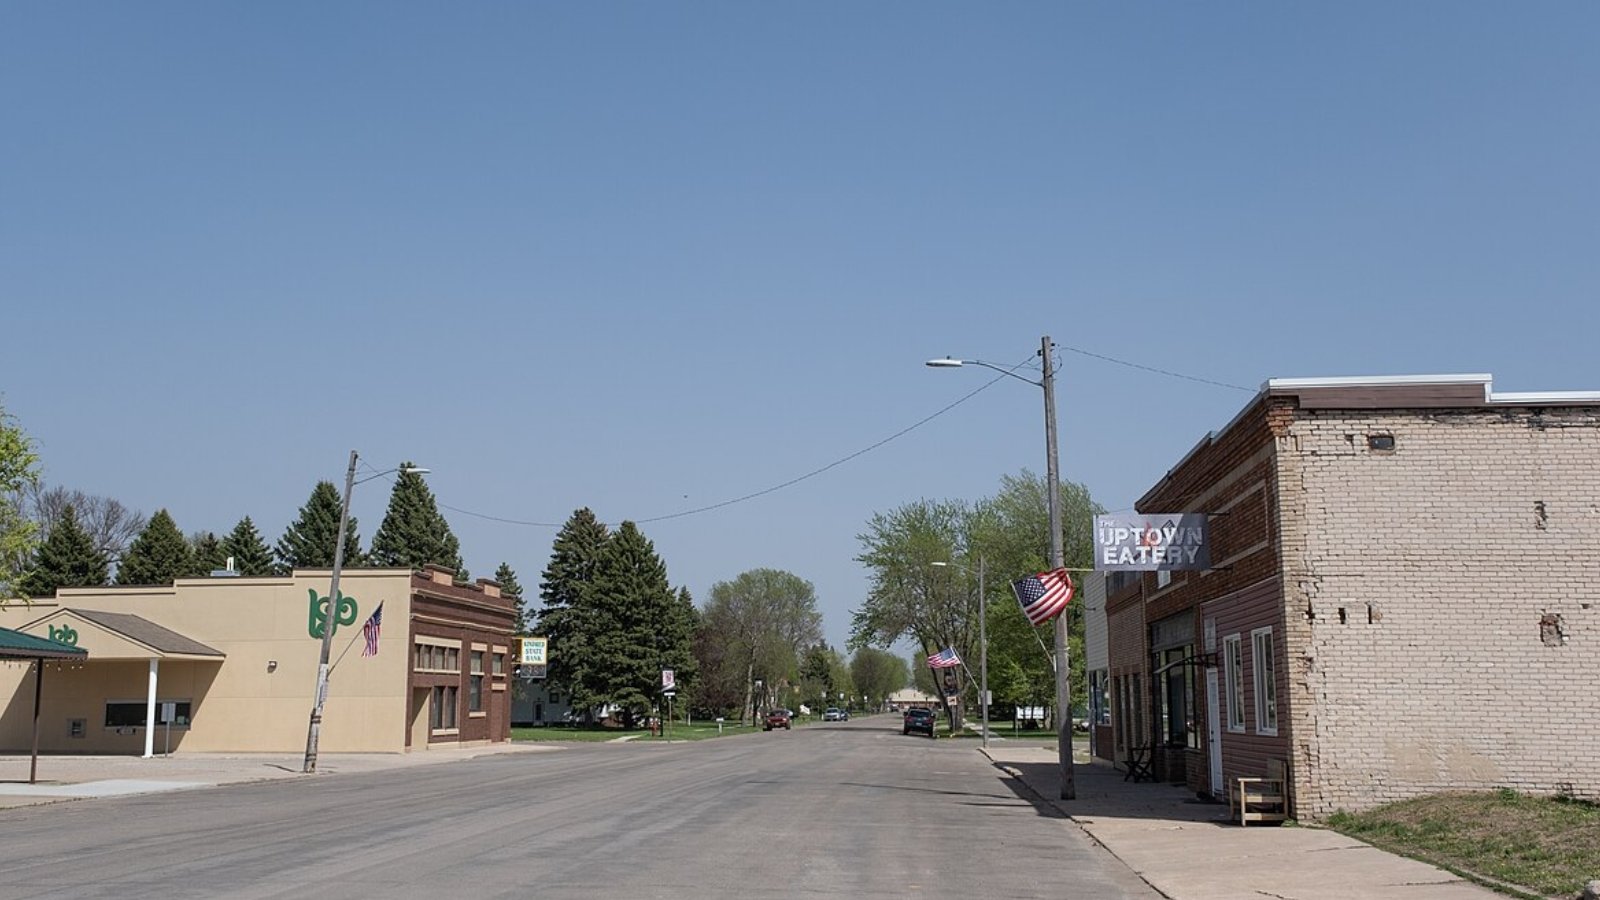
Located in Cass County approximately 25 miles south of Fargo, Kindred has established itself as a premier small city that successfully balances growth with community character. With roughly 800 residents, this community offers excellent schools, modern amenities, and a family-friendly atmosphere while maintaining convenient access to Fargo area employment. Kindred’s planned development and strong community leadership have created one of the region’s most successful smaller cities.
The housing market’s impressive appreciation reflects Kindred’s reputation for quality development, excellent schools, and strong community amenities that attract families seeking alternatives to larger metropolitan areas. The city has managed growth carefully while maintaining its small-town character, creating sustained demand for housing. Strong performance during 2019-2022 coincided with increased interest in smaller communities and suburban living trends that benefited well-positioned places like Kindred.
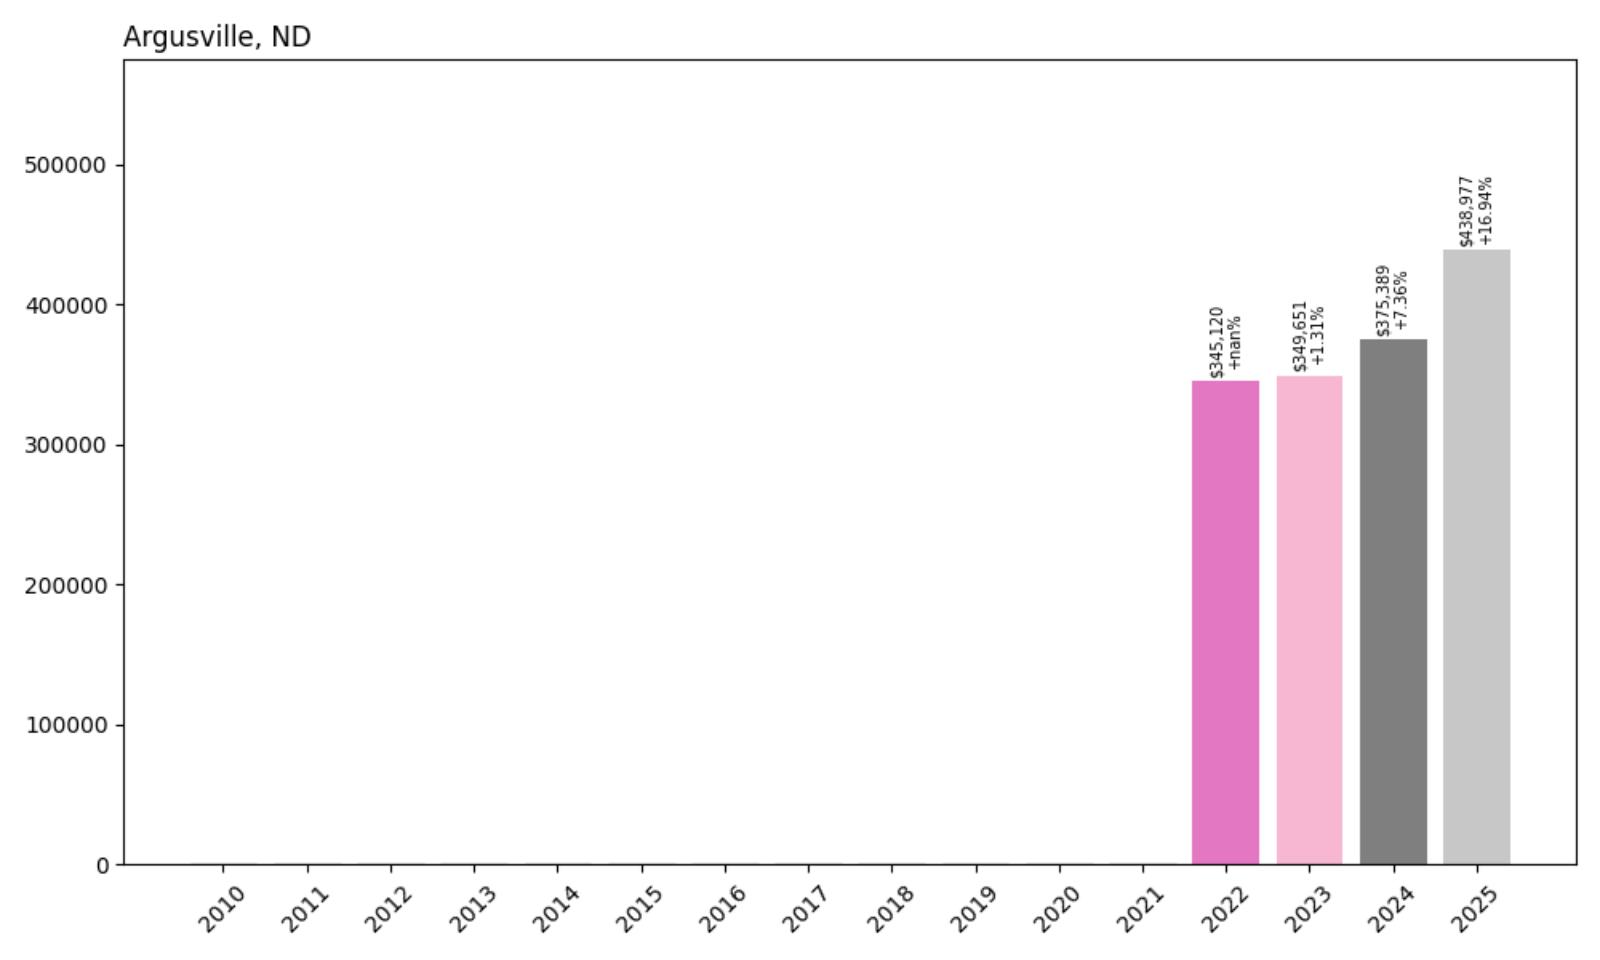
3. Argusville – 127% Home Price Increase Since 2022
- 2010: N/A
- 2011: N/A
- 2012: N/A
- 2013: N/A
- 2014: N/A
- 2015: N/A
- 2016: N/A
- 2017: N/A
- 2018: N/A
- 2019: N/A
- 2020: N/A
- 2021: N/A
- 2022: $345,120
- 2023: $349,651 (+$4,531, +1.31% from previous year)
- 2024: $375,389 (+$25,738, +7.36% from previous year)
- 2025: $438,977 (+$63,588, +16.94% from previous year)
Argusville’s housing market has shown explosive growth since data became available in 2022, with median home prices rising 127% to reach $438,977 in 2025. The market demonstrated accelerating momentum, particularly with a remarkable 16.94% surge in 2025. This dramatic appreciation places Argusville among North Dakota’s fastest-growing and most expensive housing markets.
Argusville – Suburban Boom Near Fargo
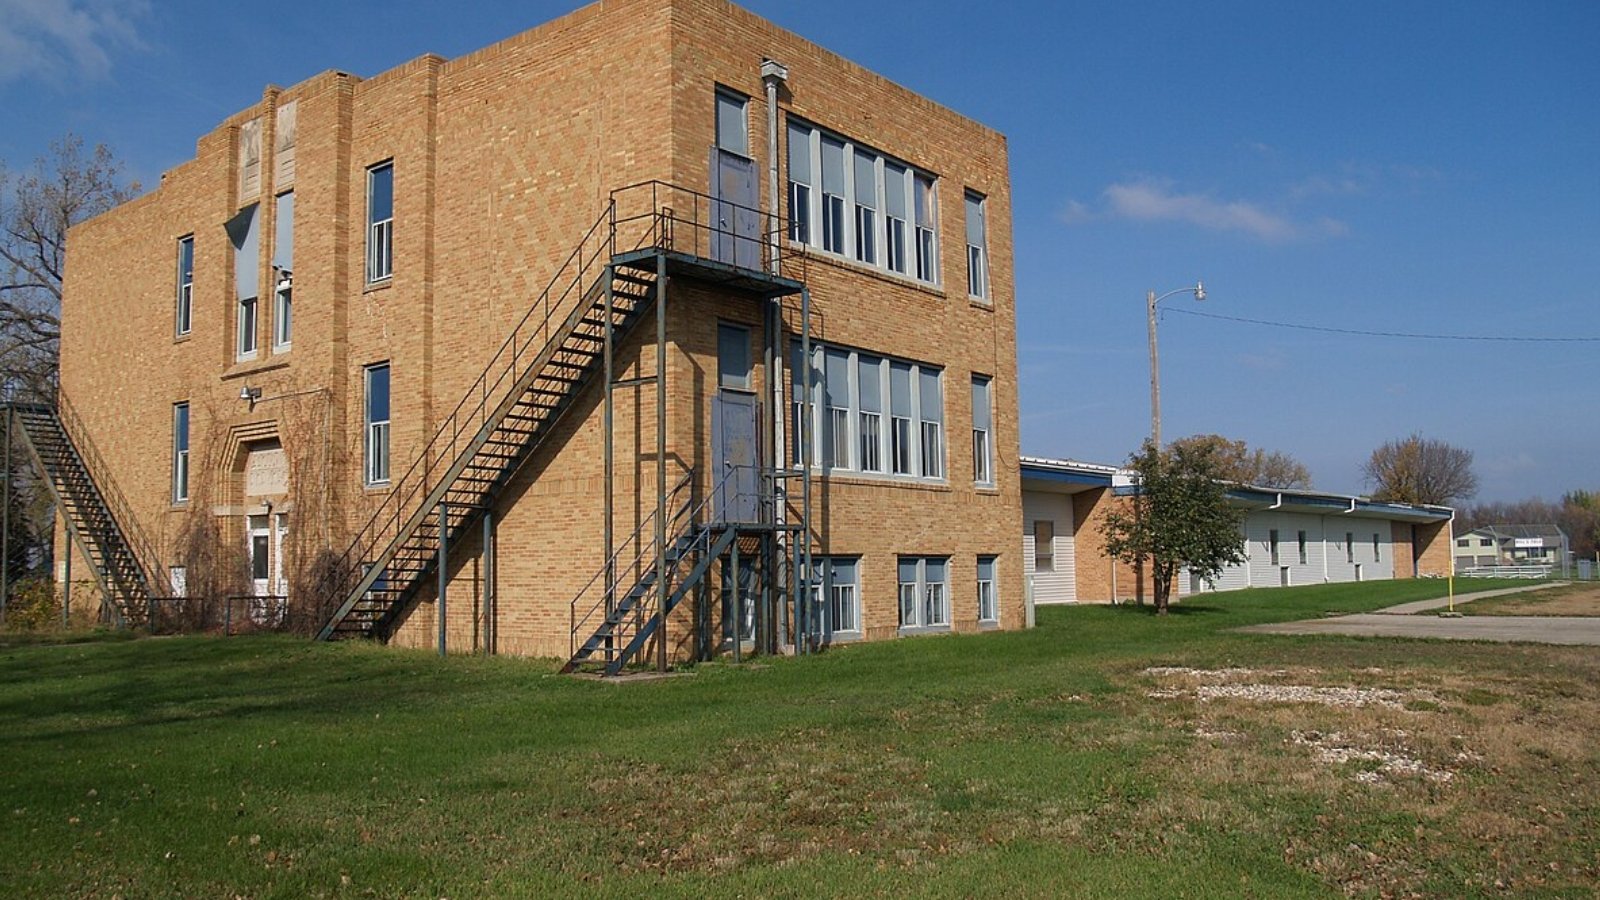
Located in Cass County just north of Fargo, Argusville has emerged as one of the region’s hottest residential markets, transforming from a tiny rural community into a sought-after suburban destination. With fewer than 200 residents but growing rapidly, this community offers new housing developments, excellent school access, and convenient proximity to Fargo employment centers. Argusville’s location provides the perfect combination of rural character with urban accessibility that appeals to families and professionals.
The housing market’s explosive growth reflects both the community’s strategic location and the broader trend toward suburban and rural living preferences that accelerated during the pandemic. Limited housing supply combined with strong demand from Fargo area workers seeking alternatives to urban living has created intense competition for available properties. The 16.94% price surge in 2025 demonstrates continued momentum as more buyers discover Argusville’s appeal.
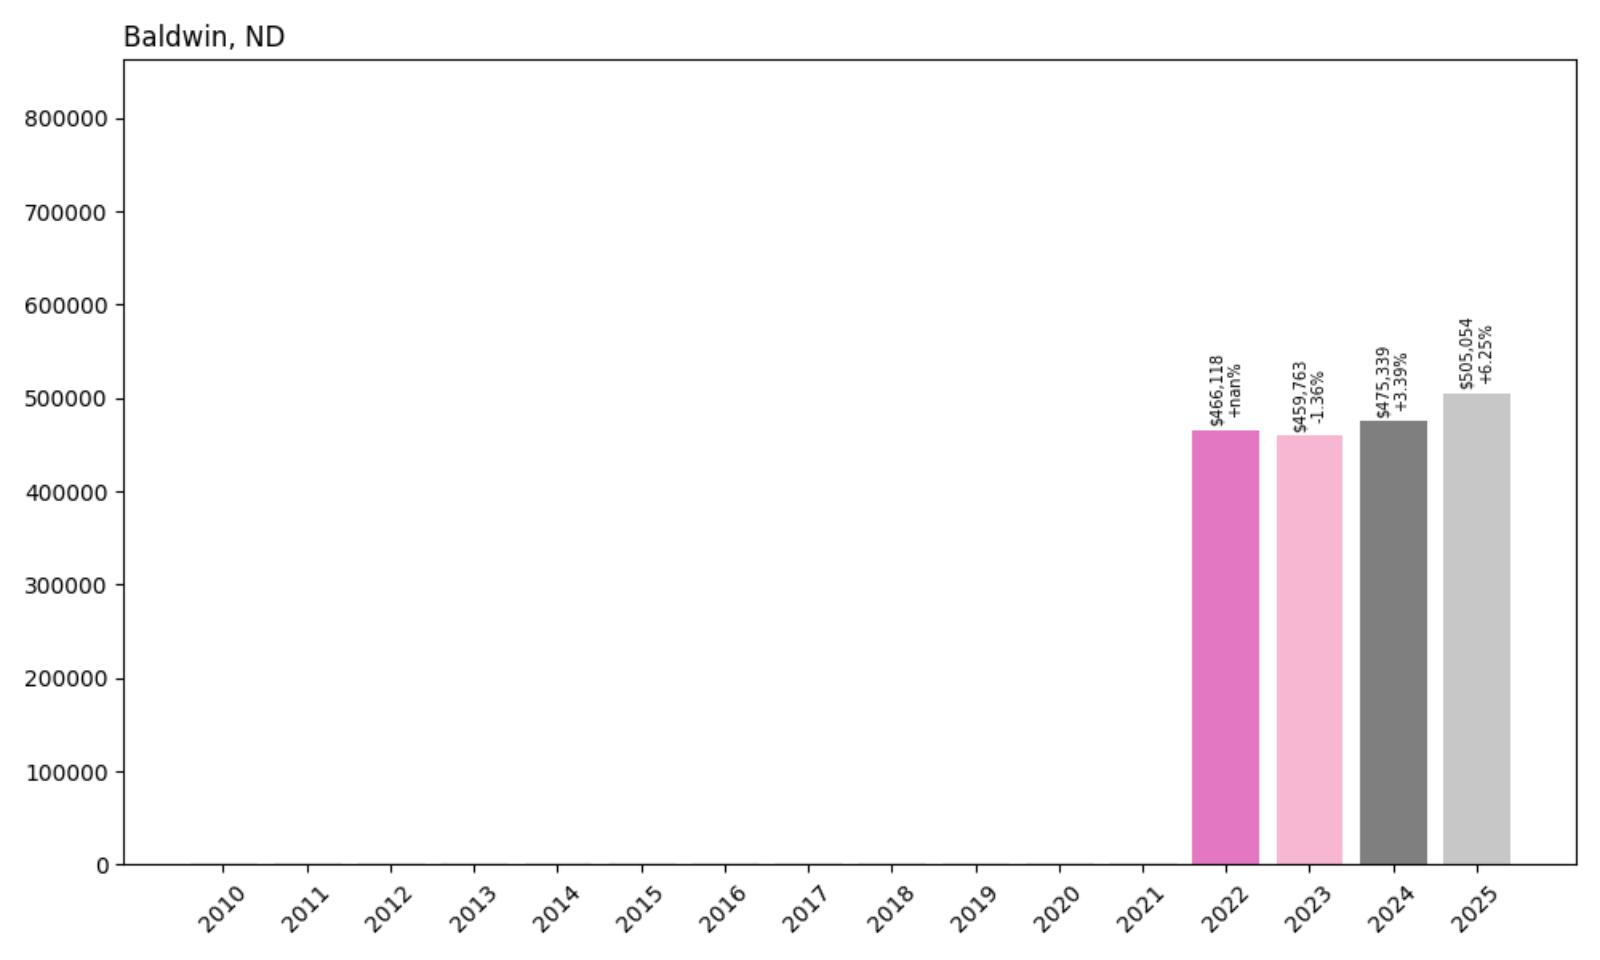
2. Baldwin – 8% Home Price Increase Since 2022
- 2010: N/A
- 2011: N/A
- 2012: N/A
- 2013: N/A
- 2014: N/A
- 2015: N/A
- 2016: N/A
- 2017: N/A
- 2018: N/A
- 2019: N/A
- 2020: N/A
- 2021: N/A
- 2022: $466,118
- 2023: $459,763 (−$6,355, −1.36% from previous year)
- 2024: $475,339 (+$15,576, +3.39% from previous year)
- 2025: $505,054 (+$29,715, +6.25% from previous year)
Baldwin’s housing market has shown strong appreciation since data became available in 2022, with median home prices rising 8% to reach $505,054 in 2025. After a brief dip in 2023, the market has recovered with increasingly strong gains, including a robust 6.25% increase in 2025. This small Burleigh County community commands some of North Dakota’s highest home prices despite its rural location.
Baldwin – Elite Rural Community Near Bismarck
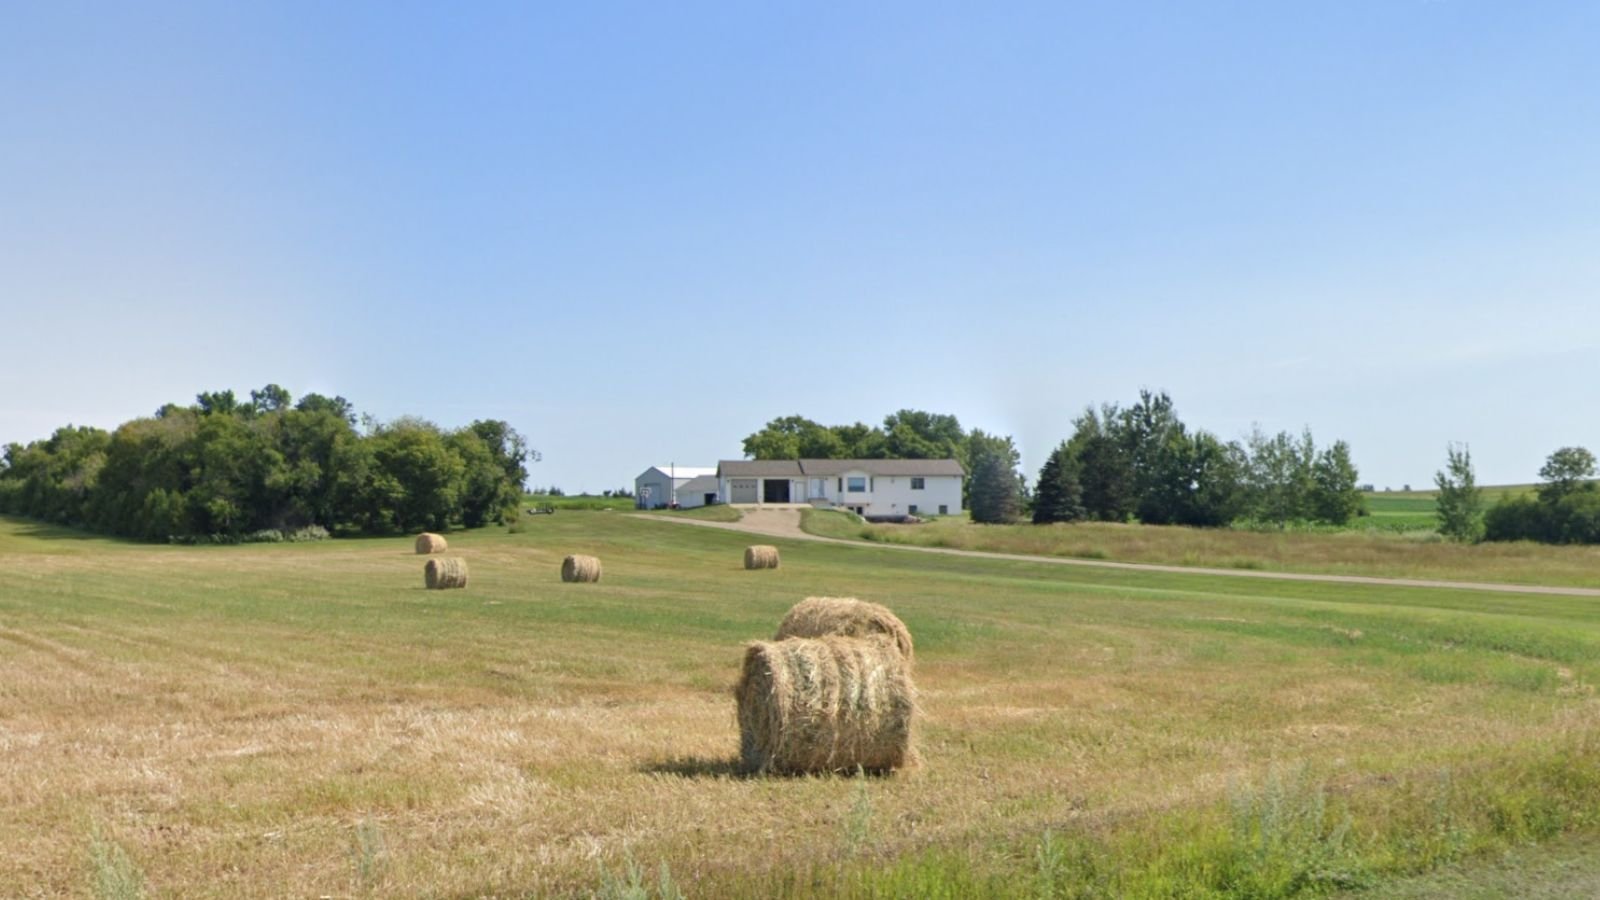
Located in Burleigh County approximately 20 miles northeast of Bismarck, Baldwin represents one of North Dakota’s most exclusive rural residential markets. With fewer than 30 residents, this tiny community has achieved remarkable home pricing levels that rival the state’s most expensive markets. Baldwin’s location provides rural tranquility while maintaining reasonable access to the capital region’s employment opportunities and urban amenities, creating appeal for buyers seeking premium rural living.
The housing market’s exceptional pricing levels reflect both the exclusivity of this small community and the premium placed on rural properties within commuting distance of major employment centers. The brief correction in 2023 was quickly followed by strong recovery, suggesting that demand for premium rural properties remains robust. Baldwin’s appeal lies in its combination of privacy, space, and strategic location that offers the best of rural and urban accessibility.
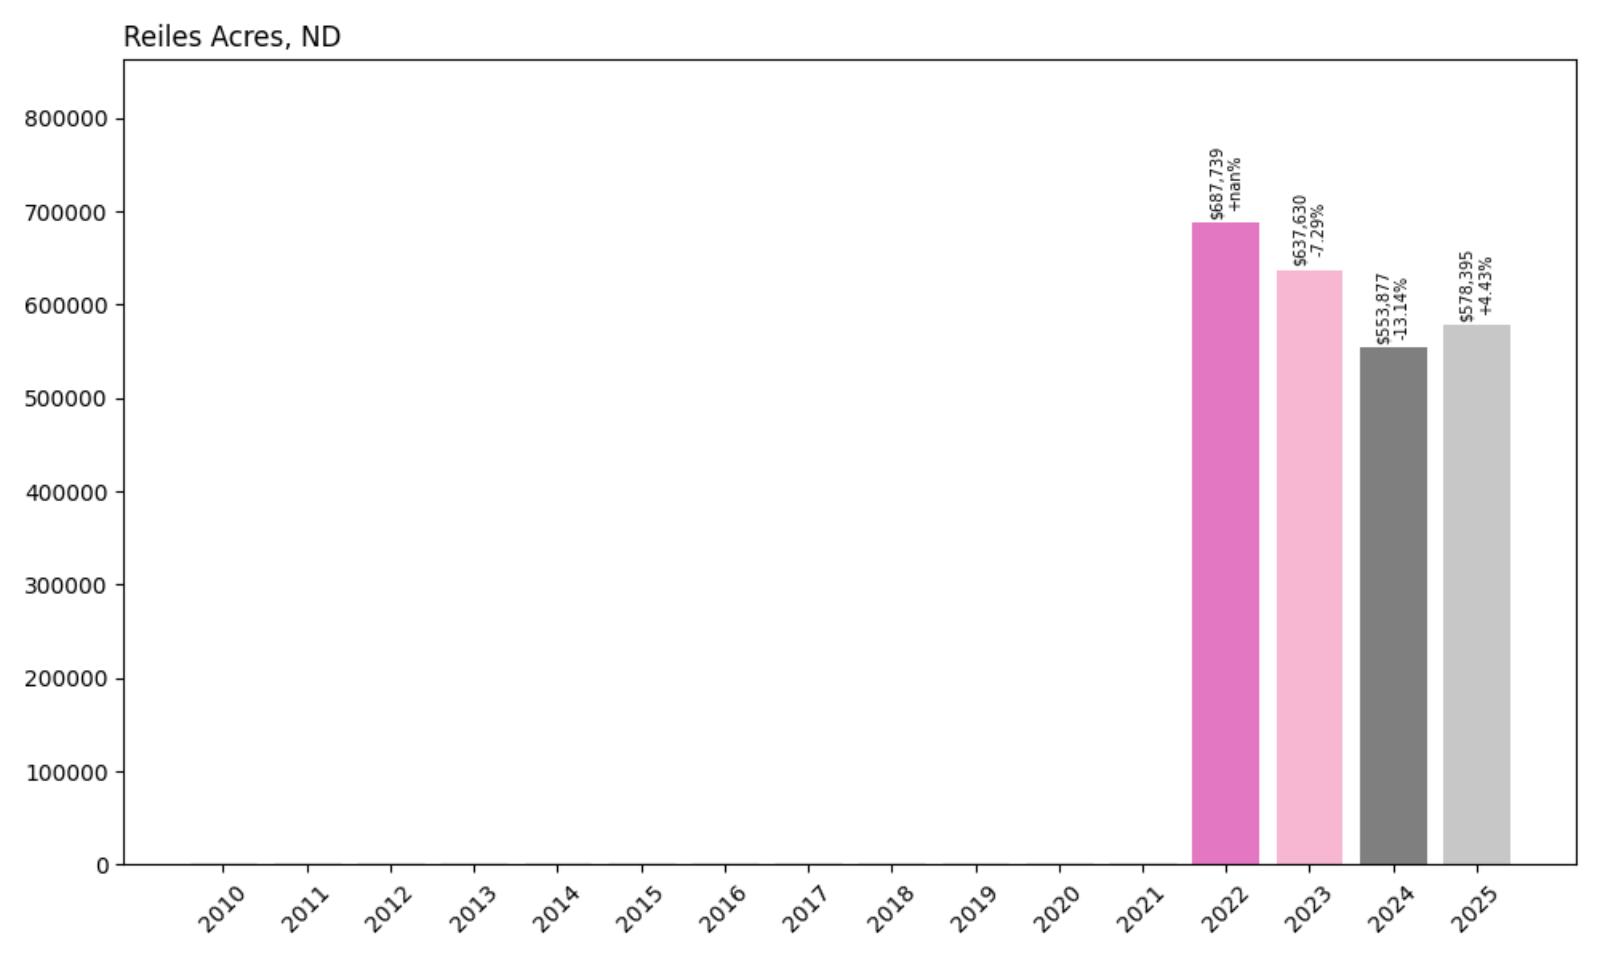
1. Reiles Acres – 16% Home Price Decrease Since 2022
- 2010: N/A
- 2011: N/A
- 2012: N/A
- 2013: N/A
- 2014: N/A
- 2015: N/A
- 2016: N/A
- 2017: N/A
- 2018: N/A
- 2019: N/A
- 2020: N/A
- 2021: N/A
- 2022: $687,739
- 2023: $637,630 (−$50,109, −7.29% from previous year)
- 2024: $553,877 (−$83,753, −13.14% from previous year)
- 2025: $578,395 (+$24,518, +4.43% from previous year)
Reiles Acres holds the distinction of North Dakota’s most expensive housing market despite experiencing significant price volatility since 2022. From a peak of nearly $688,000 in 2022, median home prices declined by 19% before recovering modestly with a 4.43% gain in 2025 to reach $578,395. Even after the correction, Reiles Acres maintains its position as the state’s premium residential market.
Reiles Acres – North Dakota’s Most Exclusive Community
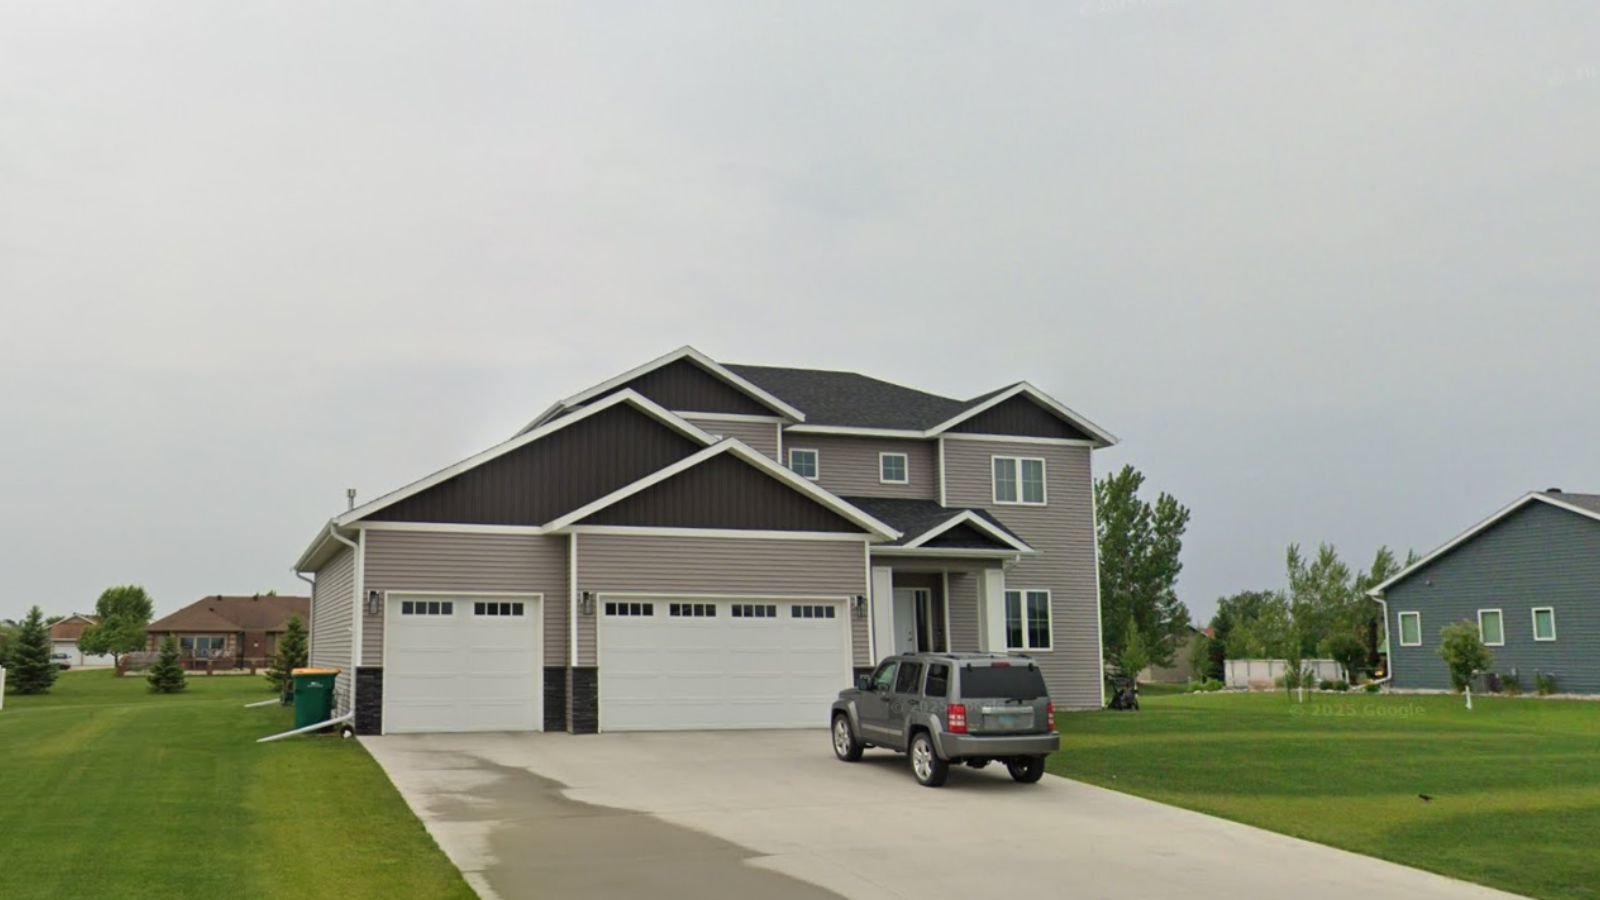
Located in Cass County just north of Fargo, Reiles Acres represents the pinnacle of North Dakota residential luxury as an incorporated city designed specifically for upscale living. With approximately 1,400 residents, this planned community features large lots, custom homes, and strict development standards that maintain its exclusive character. Reiles Acres was developed as a premium residential enclave that offers suburban luxury while providing convenient access to Fargo’s employment and cultural amenities.
The housing market’s volatility reflects both the unique nature of this luxury market and broader economic trends affecting high-end real estate. The peak pricing in 2022 may have represented unsustainable levels driven by pandemic-era market dynamics and speculation in luxury properties. The subsequent correction brought prices more in line with historical norms while still maintaining the community’s position as North Dakota’s most expensive residential market.