
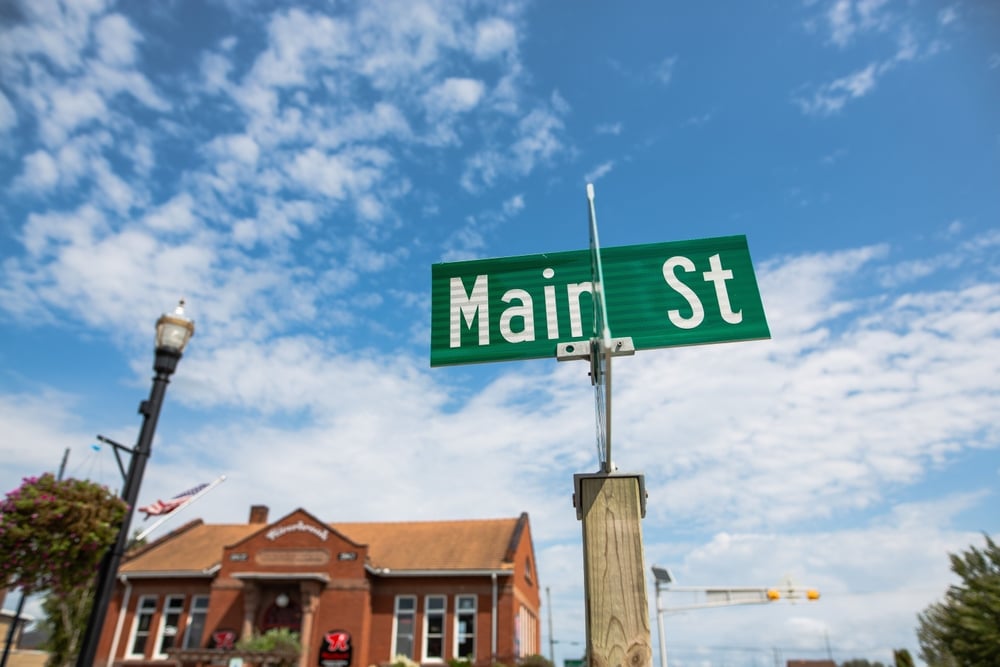
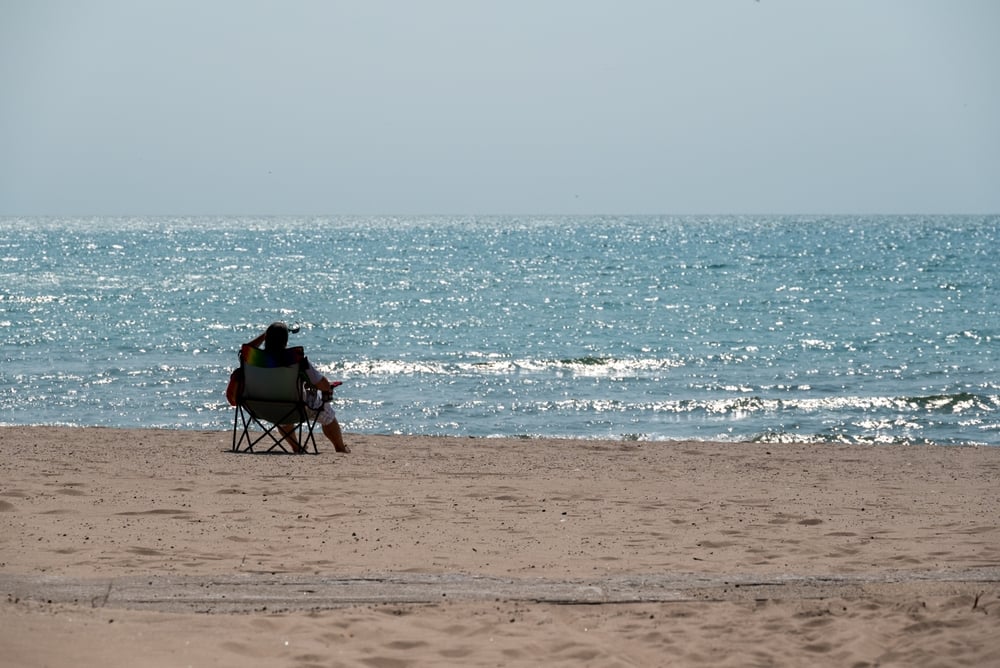
Wisconsin’s small towns don’t all share the same sky. Along the Mississippi River bluffs and across the rolling dairy country in the south, storms stack up in warm months and soaking autumn fronts are common. Closer to the Great Lakes, persistent onshore flow helps wring out moisture and keeps sunshine in short supply at times. Using multi-year climate normals and aggregated local climate profiles, this ranking highlights the small communities where residents see the most rain and the least bright sky, on average.
Method: Rankings emphasize average annual rainfall (liquid-equivalent precipitation) using long-term climate normals and town climate summaries. When towns are within a few tenths of an inch, tie-breakers consider warm-season rainfall and relative sunshine. Sunshine figures reflect average “sunny days”/percent-possible estimates aggregated from the same sources.
30. Bayfield
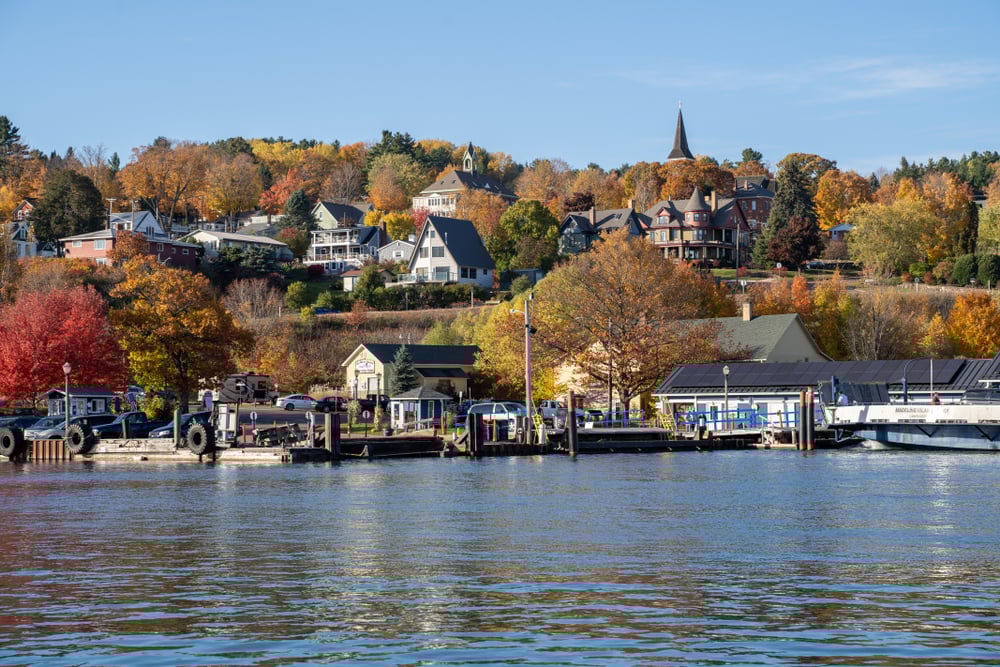
Bayfield sits on Lake Superior’s Apostle Islands doorstep, which keeps summers cool and often damp. Average annual rainfall: ~31 inches. Average sunny days: ~180 per year. Cloud cover and lake breezes can stretch out light rain events well into the afternoon, and fog is a frequent companion along the shoreline.
29. Washburn
A few miles down the lakeshore, Washburn shares Bayfield’s cool, moist microclimate. Average annual rainfall: ~31 inches. Average sunny days: ~181. Spring and early summer are the cloudiest, with persistent onshore flow that keeps showers lingering.
28. Ashland

Where Chequamegon Bay bends inland, passing fronts slow down. Average annual rainfall: ~31–32 inches. Average sunny days: ~182. Storms often redevelop over the bay, delivering multiple rounds of light to moderate rain.
27. Spooner
Forested terrain and frequent summer convection give Spooner a steady diet of rain days. Average annual rainfall: ~32 inches. Average sunny days: ~187. Thunderstorms frequently pop along boundaries and drift across town in late afternoon.
26. Rice Lake
A shallow-basin lake and surrounding woods help seed summertime downpours. Average annual rainfall: ~32 inches. Average sunny days: ~187. Humid July and August periods often bring several inches of rain in a week.
25. Hayward
Hayward’s lakes and pines make for postcard mornings and damp afternoons. Average annual rainfall: ~32 inches. Average sunny days: ~186. Slow-moving warm-season lows can sit nearby for days, adding drizzle to light rain.
24. Minocqua
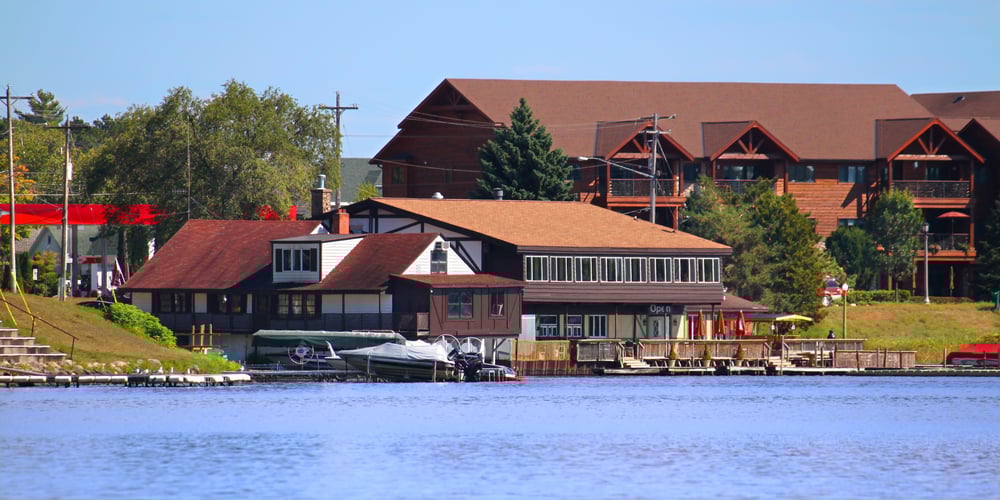
The “Island City” lives up to the name with plenty of water in the air too. Average annual rainfall: ~32–33 inches. Average sunny days: ~186. Convection along lake-breeze boundaries is a frequent driver of short, heavy showers.
23. Eagle River
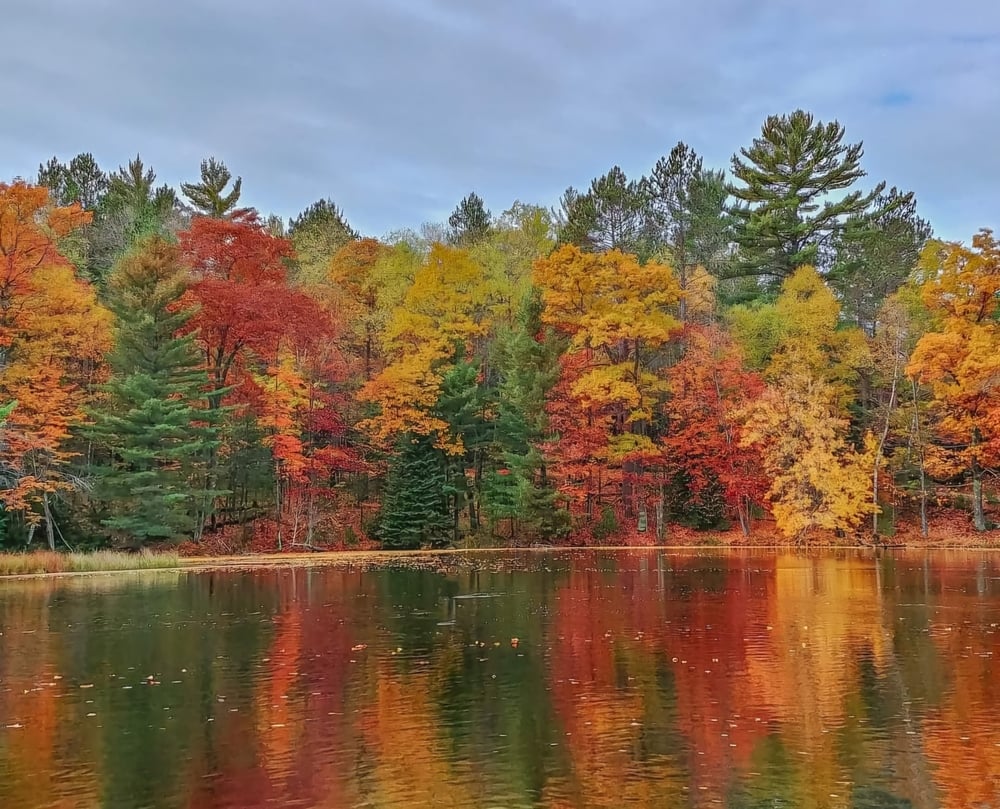
At the heart of lake country, Eagle River sees regular warm-season storms and lingering stratiform rain in fall. Average annual rainfall: ~33 inches. Average sunny days: ~186. Early autumn systems can deliver several inches in a few days.
22. Rhinelander
Forested high ground and interior Wisconsin humidity keep showers active. Average annual rainfall: ~33 inches. Average sunny days: ~185–186. Afternoon thunder is common from late May through August.
21. Antigo
On the northern uplands, weak disturbances wring out moisture efficiently. Average annual rainfall: ~33 inches. Average sunny days: ~185. Spring and fall are notably gray with frequent light rain.
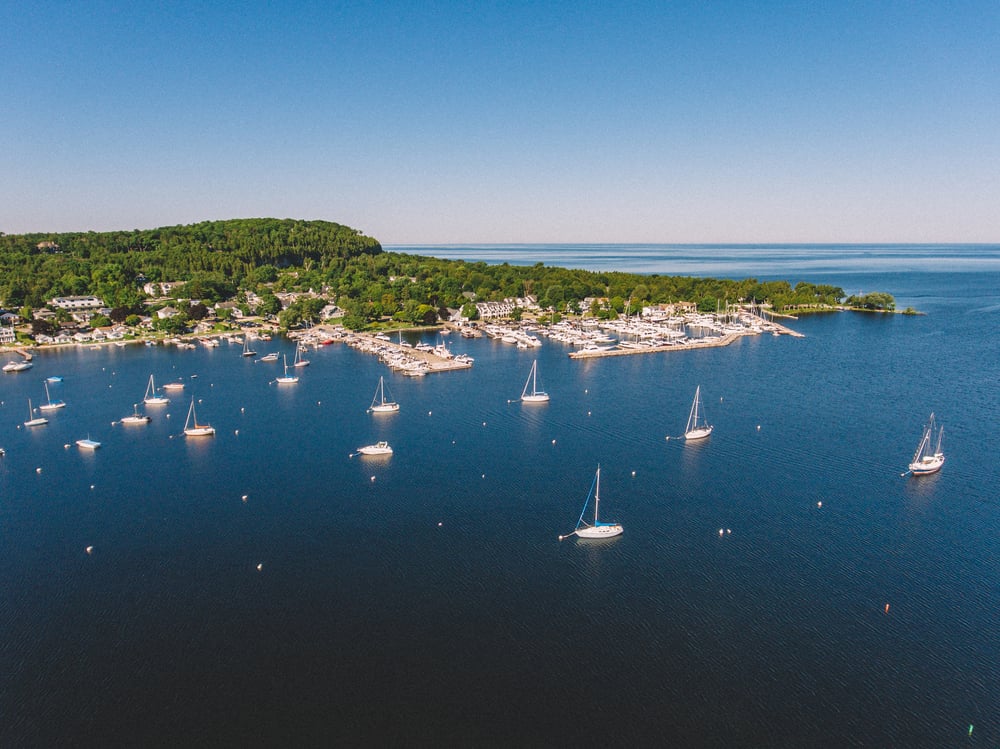
20. Sturgeon Bay
Door County’s mid-peninsula location funnels maritime moisture from Green Bay and Lake Michigan. Average annual rainfall: ~33 inches. Average sunny days: ~184–185. Sea-breeze-like circulations prolong shower chances.
19. Algoma
Right on the Lake Michigan shore, Algoma picks up added drizzle and showers under onshore flow. Average annual rainfall: ~33–34 inches. Average sunny days: ~184. Coastal cloud decks can hold firm, limiting sunshine.
18. Kewaunee
Kewaunee’s lake-enhanced humidity helps minor systems produce measurable rain. Average annual rainfall: ~34 inches. Average sunny days: ~184. Persistent marine layers keep mornings damp much of spring.
17. Two Rivers
Where the Manitowoc River meets Lake Michigan, moist air often stalls. Average annual rainfall: ~34 inches. Average sunny days: ~184. Light rain or drizzle can linger even when inland skies brighten.
16. Port Washington
Closer to Milwaukee’s lake breeze zone but still small-town in scale, Port Washington sees frequent lake-influenced showers. Average annual rainfall: ~34 inches. Average sunny days: ~185. Summer storm complexes drifting in from the west often recharge over the lakefront.
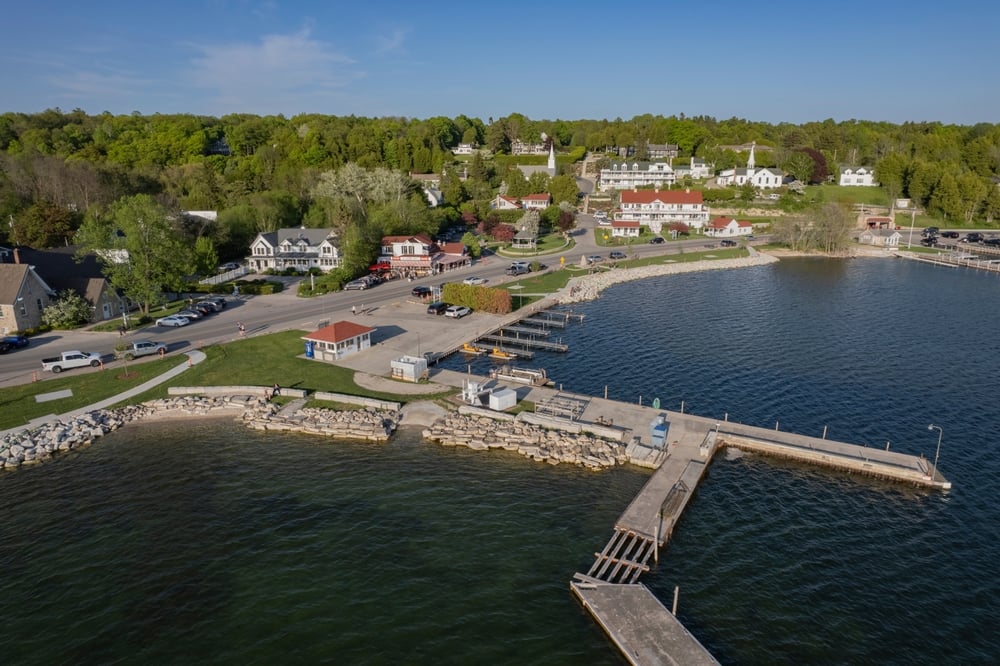
15. Sister Bay

Northern Door County’s shorelines trap cool, moist air through June and again in September. Average annual rainfall: ~34 inches. Average sunny days: ~184. Occasional heavy fall rains arrive with passing Great Lakes lows.
14. Fish Creek
A notch farther south on the peninsula, Fish Creek shares the same damp shoulder seasons. Average annual rainfall: ~34 inches. Average sunny days: ~184–185. Afternoon sun breaks are common, but mornings trend gray.
13. Ephraim
Ephraim’s bayside setting favors light, persistent precipitation when winds blow off the lake. Average annual rainfall: ~34 inches. Average sunny days: ~185. Drizzly days are typical in April and May.
12. Waupaca
In central Wisconsin’s kettle lakes region, storm tracks frequently run overhead. Average annual rainfall: ~34–35 inches. Average sunny days: ~187. Warm-season squall lines can deliver multiple inches in a single evening.
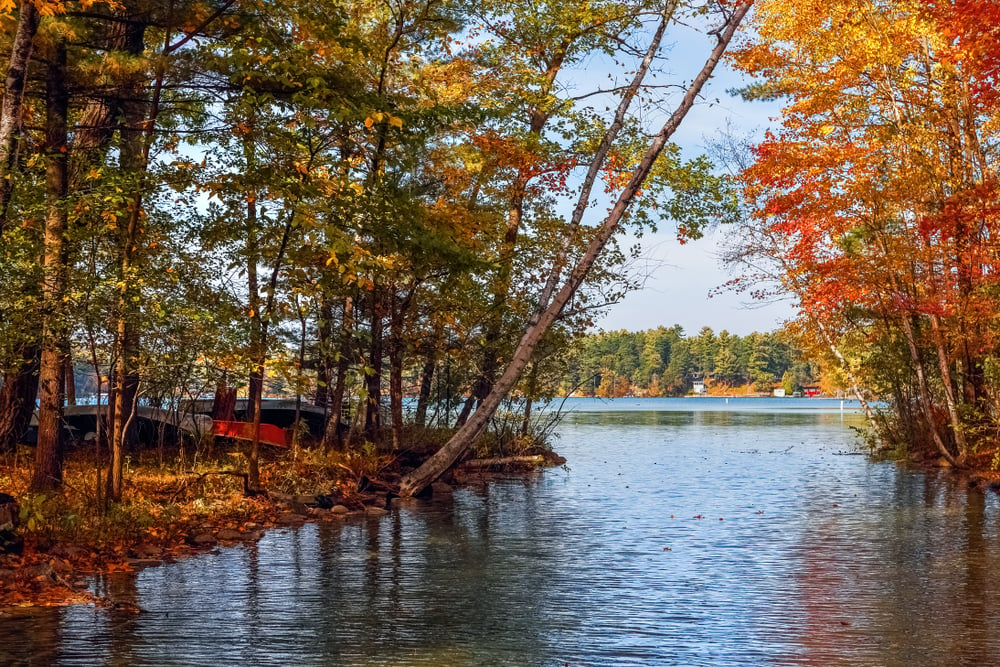
11. Wisconsin Dells
Tourism capital by name, storm magnet by geography. Average annual rainfall: ~35 inches. Average sunny days: ~187. The Wisconsin River valley helps focus slow-moving summer storms that soak the sandstone bluffs.
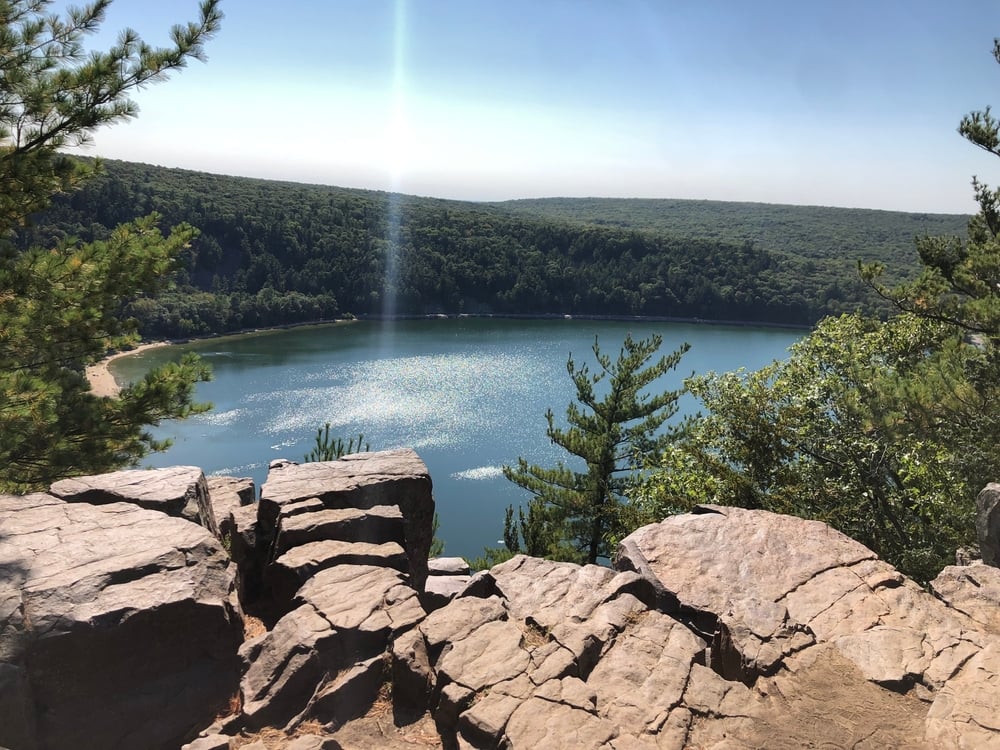
10. Baraboo

Just downstream from the Dells, Baraboo’s proximity to river bluffs keeps storms organized. Average annual rainfall: ~35 inches. Average sunny days: ~187. May–August accounts for the bulk of annual totals, often via nocturnal complexes.
9. Richland Center
The Driftless Area’s dissected hills coax lift from every passing boundary. Average annual rainfall: ~35 inches. Average sunny days: ~187. Spring systems can deliver long, soaking rains ahead of slow cold fronts.
8. Viroqua
High on the ridgetops, Viroqua squeezes extra rain from humid air masses. Average annual rainfall: ~35 inches. Average sunny days: ~186–187. Southerly flow days in June and July are especially wet.
7. Prairie du Chien
Where the Wisconsin meets the Mississippi, moisture pools and storms slow. Average annual rainfall: ~35–36 inches. Average sunny days: ~187. Training thunderstorms in summer are a hallmark here.
6. Onalaska
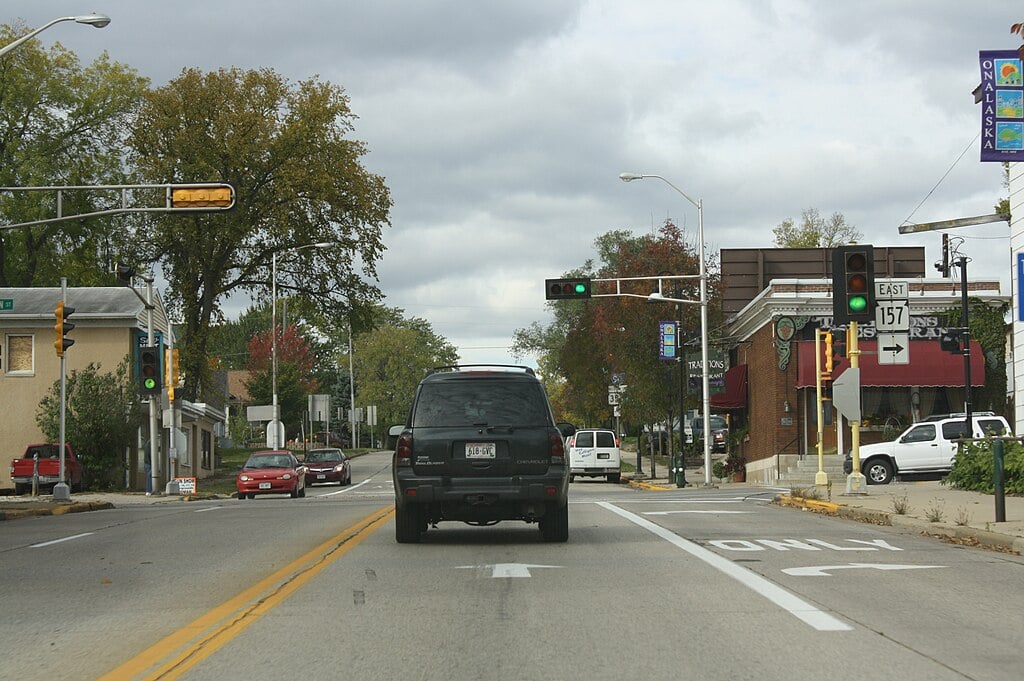
North of La Crosse, the Mississippi valley geometry helps focus evening storm clusters. Average annual rainfall: ~36 inches. Average sunny days: ~188. Heavy, warm-season rainfall events are common.
5. Sparta
Set between river valleys and rolling ridges, Sparta often sees multiple rain days in a week during peak season. Average annual rainfall: ~36 inches. Average sunny days: ~187–188. Autumn systems can be slow and soaking.
4. Tomah
Tomah’s crossroads location gets a steady parade of storm systems. Average annual rainfall: ~36 inches. Average sunny days: ~187–188. Overnight mesoscale convective systems frequently push totals higher than nearby towns.
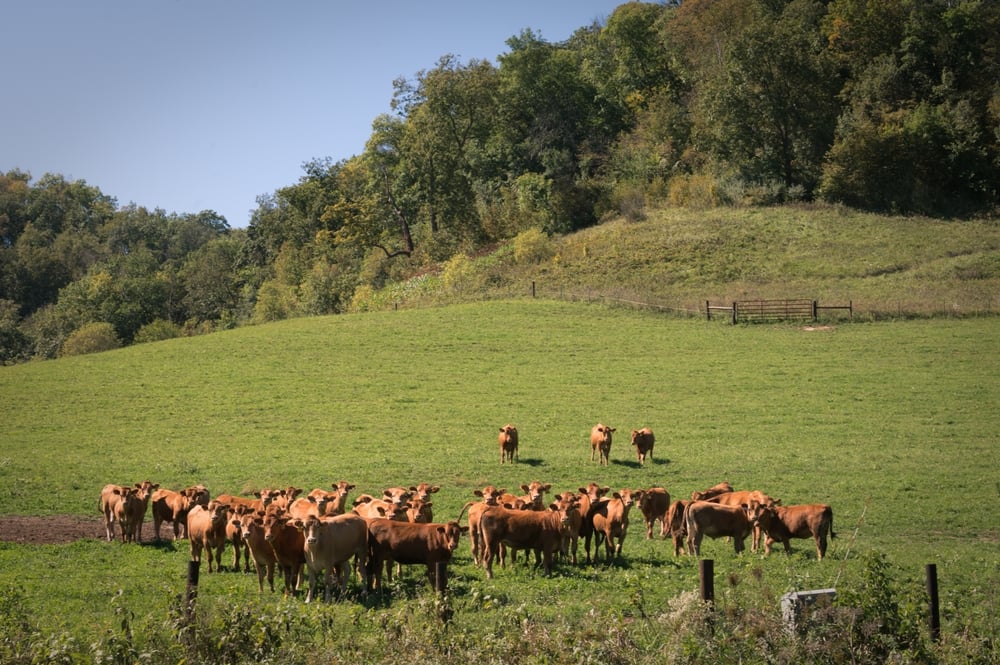
3. Monroe
Farther south, Monroe sits in a corridor of frequent thunderstorm tracks. Average annual rainfall: ~36–37 inches. Average sunny days: ~189. Late-spring and midsummer downpours are a defining feature.
2. Platteville
On the high ground of the state’s southwest, Platteville regularly lands in the bullseye of slow-moving storm complexes. Average annual rainfall: ~36–37 inches. Average sunny days: ~189. The wettest days often cluster in June.
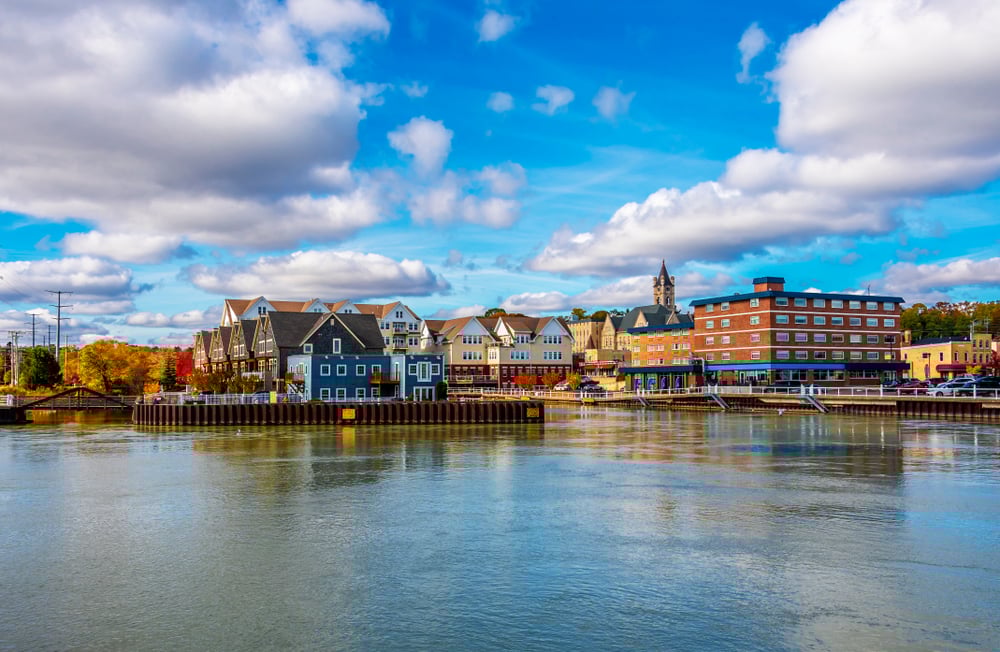
1. Lake Geneva

Near the Illinois line, Lake Geneva benefits from rich Gulf moisture on south winds and frequent storm redevelopment. Average annual rainfall: ~37 inches. Average sunny days: ~189–190. Spring and summer bring repeated heavy-rain events, and the lake itself helps keep low clouds around on marginal days.
References
-
Bayfield, WI Climate – BestPlaces
-
Washburn, WI Climate – U.S. Climate Data
-
Ashland, WI Weather Averages – Weather Spark
-
Spooner, WI Climate – Climate-Data.org
-
Rice Lake, WI Climate – BestPlaces
-
Hayward, WI Weather Averages – Weather Spark
-
Minocqua, WI Climate – U.S. Climate Data
-
Eagle River, WI Climate – BestPlaces
-
Rhinelander, WI Climate – Climate-Data.org
-
Antigo, WI Weather Averages – Weather Spark
-
Sturgeon Bay, WI Climate – BestPlaces
-
Algoma, WI Climate – U.S. Climate Data
-
Kewaunee, WI Climate – Climate-Data.org
-
Two Rivers, WI Weather Averages – Weather Spark
-
Port Washington, WI Climate – BestPlaces
-
Sister Bay, WI Climate – U.S. Climate Data
-
Fish Creek, WI Climate – Climate-Data.org
-
Ephraim, WI Weather Averages – Weather Spark
-
Waupaca, WI Climate – BestPlaces
-
Wisconsin Dells, WI Climate – U.S. Climate Data
-
Baraboo, WI Climate – Climate-Data.org
-
Richland Center, WI Weather Averages – Weather Spark
-
Viroqua, WI Climate – BestPlaces
-
Prairie du Chien, WI Climate – U.S. Climate Data
-
Onalaska, WI Climate – Climate-Data.org
-
Sparta, WI Weather Averages – Weather Spark
-
Tomah, WI Climate – BestPlaces
-
Monroe, WI Climate – U.S. Climate Data
-
Platteville, WI Climate – Climate-Data.org
-
Lake Geneva, WI Weather Averages – Weather Spark
-
1991–2020 U.S. Climate Normals – NOAA/NCEI
-
Wisconsin State Climatology Office – Climate Averages & Maps