
While much of New Jersey has seen home prices soar, the Zillow Home Value Index reveals 19 towns where homes remain surprisingly affordable in 2025. These places—ranging from quiet bayside communities to commuter-friendly hubs—still offer home prices well below the state average, without sacrificing livability or long-term potential.
Some have slowly gained value since the early 2010s, others have rebounded more recently, but all reflect where buyers can still find breathing room in a tight market. Whether you’re a first-time buyer, a growing family, or simply looking to stretch your housing budget, these towns offer rare value in a state where prices often tell a different story.
19. Carneys Point – 87.1% Home Price Increase Since 2013

- 2010: $144,031
- 2011: $139,342 (-$4,689, -3.26% from previous year)
- 2012: $137,804 (-$1,538, -1.10% from previous year)
- 2013: $132,857 (-$4,947, -3.59% from previous year)
- 2014: $139,415 (+$6,558, +4.94% from previous year)
- 2015: $136,126 (-$3,289, -2.36% from previous year)
- 2016: $133,472 (-$2,654, -1.95% from previous year)
- 2017: $132,311 (-$1,161, -0.87% from previous year)
- 2018: $131,967 (-$344, -0.26% from previous year)
- 2019: $129,376 (-$2,592, -1.96% from previous year)
- 2020: N/A
- 2021: $170,067 (+$40,692, +31.45% from previous year)
- 2022: $202,623 (+$32,556, +19.14% from previous year)
- 2023: $218,527 (+$15,904, +7.85% from previous year)
- 2024: $239,506 (+$20,980, +9.60% from previous year)
- 2025: $248,473 (+$8,966, +3.74% from previous year)
Carneys Point has seen an impressive 87% increase in home values since 2013, marking a steady recovery from earlier declines. The housing market here was largely flat or even declining through most of the 2010s, but the jump starting in 2021 was a turning point. Prices shot up by more than 30% in a single year and have continued rising at a more moderate pace ever since. The current median home value of $248,473 puts it comfortably within the affordable range for New Jersey, even as demand continues to climb.
Carneys Point – Quiet Affordability at the Crossroads of New Jersey

Carneys Point sits in Salem County near the Delaware River and offers direct access to I-295, the New Jersey Turnpike, and the Delaware Memorial Bridge. It’s a strategically located community for commuters heading to Wilmington or Philadelphia, but it doesn’t have the dense, fast-paced feel of a metro area. Instead, Carneys Point is quiet, with suburban neighborhoods and a mix of older homes and newer developments. Schools, supermarkets, and recreational spaces are nearby, making it a practical place for families or retirees seeking more space and less congestion.
The town’s affordability has made it attractive for buyers looking to escape higher-cost parts of South Jersey. While it may not have the buzz of a revitalized downtown or trendy new builds, the numbers show strong growth, likely driven by its location and pricing advantage. Carneys Point remains under the radar for many buyers — but those who discover it often find they’re getting far more house for their money compared to nearby alternatives.
18. Millville – 84.8% Home Price Increase Since 2013

- 2010: $138,580
- 2011: $136,118 (-$2,463, -1.78% from previous year)
- 2012: $133,444 (-$2,673, -1.96% from previous year)
- 2013: $133,617 (+$173, +0.13% from previous year)
- 2014: $129,531 (-$4,086, -3.06% from previous year)
- 2015: $127,916 (-$1,615, -1.25% from previous year)
- 2016: $131,334 (+$3,419, +2.67% from previous year)
- 2017: $130,157 (-$1,177, -0.90% from previous year)
- 2018: $130,096 (-$61, -0.05% from previous year)
- 2019: $134,132 (+$4,036, +3.10% from previous year)
- 2020: N/A
- 2021: $166,010 (+$31,878, +23.77% from previous year)
- 2022: $198,170 (+$32,160, +19.37% from previous year)
- 2023: $208,096 (+$9,925, +5.01% from previous year)
- 2024: $225,528 (+$17,432, +8.38% from previous year)
- 2025: $246,999 (+$21,471, +9.52% from previous year)
Millville’s home prices have risen almost 85% since 2013, fueled by a strong rebound that started in 2021. For much of the previous decade, prices hovered with little movement. That changed when buyers began re-evaluating affordability and space needs, pushing demand in towns that had been overlooked for years. With an average home now priced at $246,999, Millville remains affordable by state standards, even with the substantial increases.
Millville – Artistic Heritage and Steady Growth

Located in Cumberland County, Millville is best known for its glassmaking legacy and the creative energy of the Glasstown Arts District. Its downtown has seen steady revitalization efforts, and a growing number of small businesses, galleries, and cafes are creating a more vibrant community feel. Despite being far from major metros, it has enough infrastructure and cultural energy to feel connected — but without the high housing costs that often accompany such amenities.
Millville also benefits from access to nature, including the Maurice River and Union Lake, offering opportunities for kayaking, birding, and hiking. The area’s slower pace and competitive home prices have drawn attention from remote workers and families seeking more land and less stress. While some nearby towns have already peaked, Millville’s gains appear more sustainable — backed by community investment and improving livability.
17. Gloucester City – 87.4% Home Price Increase Since 2013

- 2010: $134,194
- 2011: $128,484 (-$5,710, -4.25% from previous year)
- 2012: $108,313 (-$20,171, -15.70% from previous year)
- 2013: $95,546 (-$12,767, -11.79% from previous year)
- 2014: $98,686 (+$3,140, +3.29% from previous year)
- 2015: $98,220 (-$466, -0.47% from previous year)
- 2016: $103,315 (+$5,095, +5.19% from previous year)
- 2017: $95,224 (-$8,091, -7.83% from previous year)
- 2018: $100,405 (+$5,182, +5.44% from previous year)
- 2019: $111,127 (+$10,722, +10.68% from previous year)
- 2020: N/A
- 2021: $157,472 (+$46,345, +41.70% from previous year)
- 2022: $179,149 (+$21,677, +13.77% from previous year)
- 2023: $194,422 (+$15,273, +8.53% from previous year)
- 2024: $228,832 (+$34,411, +17.70% from previous year)
- 2025: $245,454 (+$16,621, +7.26% from previous year)
Gloucester City has experienced nearly 90% growth in home prices since 2013, a major turnaround after years of decline. The city hit its low point in the early 2010s, but starting around 2018, prices began to climb, with a massive surge in 2021 and strong momentum continuing through 2025. With home values now sitting at $245,454, Gloucester City stands out as one of New Jersey’s most affordable waterfront towns with real long-term growth potential.
Gloucester City – Affordable Access to the Philly Metro

Gloucester City sits right on the Delaware River, just across from South Philadelphia, offering one of the most affordable housing markets within close reach of a major city. Commuters have long valued the town’s location, with easy access to I-76, I-295, and multiple bridges into Pennsylvania. But in recent years, it’s not just the location that’s attracting interest. Community reinvestment, infrastructure upgrades, and local pride have given the city a renewed sense of identity.
Neighborhoods here still feel like close-knit communities, with rowhomes and single-family houses providing entry-level options that are disappearing in nearby suburbs. The strong jump in home values reflects a mix of investor interest and families looking for more affordable alternatives to Philly’s increasingly pricey neighborhoods. Gloucester City isn’t polished, but it’s real — and that authenticity, along with solid value, continues to draw people in.
16. Quinton – 64.3% Home Price Increase Since 2019

- 2010: N/A
- 2011: N/A
- 2012: N/A
- 2013: N/A
- 2014: N/A
- 2015: N/A
- 2016: N/A
- 2017: N/A
- 2018: N/A
- 2019: $149,297
- 2020: N/A
- 2021: $170,943 (+$21,646, +14.50% from previous year)
- 2022: $212,093 (+$41,151, +24.07% from previous year)
- 2023: $230,557 (+$18,463, +8.71% from previous year)
- 2024: $257,013 (+$26,456, +11.47% from previous year)
- 2025: $245,265 (-$11,748, -4.57% from previous year)
Quinton’s home prices have climbed more than 64% since 2019, fueled by rapid increases from 2021 through 2024. While 2025 saw a modest pullback, overall growth remains strong, particularly for a small, rural township. With an average price of $245,265, Quinton is still well below the state median, offering breathing room for buyers looking for space and affordability in southern New Jersey.
Quinton – Rural Peace and Room to Grow

Located in Salem County, Quinton is a spread-out community with a distinctly rural vibe. There’s a lot of farmland, quiet roads, and space between neighbors. This appeal has grown as more people look beyond urban centers for quieter living. While the town doesn’t have a bustling downtown or large retail hubs, it does offer a slower pace of life — and access to nature that’s hard to find in more developed areas of the state.
The limited inventory and strong jump in demand post-2020 likely explain the dramatic price gains. Quinton is still under the radar, with low housing density and minimal development pressure. Buyers here are often in search of privacy, outdoor space, and budget-friendly housing. The 2025 price dip may just reflect market normalization rather than a shift in overall demand. Long-term, Quinton remains a stable and affordable corner of southern New Jersey.
15. Leesburg – Flat Pricing with Minor Dip Since 2024

- 2010: N/A
- 2011: N/A
- 2012: N/A
- 2013: N/A
- 2014: N/A
- 2015: N/A
- 2016: N/A
- 2017: N/A
- 2018: N/A
- 2019: N/A
- 2020: N/A
- 2021: N/A
- 2022: N/A
- 2023: N/A
- 2024: $244,952
- 2025: $244,759 (-$194, -0.08% from previous year)
Leesburg has shown no meaningful price movement between 2024 and 2025. The current median home price is $244,759, nearly unchanged from the previous year. This kind of pricing stability is rare in New Jersey’s more volatile markets and suggests a town with limited turnover and steady local demand.
Leesburg – Stability in a Quiet Cumberland County Enclave

Leesburg is part of Maurice River Township in rural Cumberland County. The town is mostly residential, surrounded by woodlands and far from the noise of major cities. It’s not the kind of place where buyers rush in and out of the market — homes tend to stay in families or are bought by long-term residents who value peace and privacy over urban convenience. There’s very little commercial development, and that suits many locals just fine.
While the lack of data before 2024 limits long-term analysis, the stability shown in the most recent numbers aligns with what’s known about the area: quiet, slow-moving, and largely insulated from the state’s broader real estate swings. For buyers seeking predictability and a lifestyle away from the state’s traffic and tension, Leesburg remains a hidden haven where little changes — and that’s exactly the point.
14. Brooklawn – 113.3% Home Price Increase Since 2013

- 2010: $158,073
- 2011: $145,836 (-$12,237, -7.74% from previous year)
- 2012: $126,883 (-$18,952, -13.00% from previous year)
- 2013: $114,332 (-$12,551, -9.89% from previous year)
- 2014: $114,676 (+$344, +0.30% from previous year)
- 2015: $112,127 (-$2,549, -2.22% from previous year)
- 2016: $112,047 (-$80, -0.07% from previous year)
- 2017: $111,081 (-$966, -0.86% from previous year)
- 2018: $107,796 (-$3,285, -2.96% from previous year)
- 2019: $121,864 (+$14,069, +13.05% from previous year)
- 2020: N/A
- 2021: $157,519 (+$35,654, +29.26% from previous year)
- 2022: $185,871 (+$28,352, +18.00% from previous year)
- 2023: $197,865 (+$11,995, +6.45% from previous year)
- 2024: $231,614 (+$33,748, +17.06% from previous year)
- 2025: $244,100 (+$12,486, +5.39% from previous year)
Brooklawn has more than doubled its average home price since 2013, with an increase of 113.3% over 12 years. The steepest gains came after 2020, when home values surged, reflecting increased buyer interest in small, commuter-friendly boroughs. With a current median of $244,100, Brooklawn remains below the state average — but not for long if trends continue.
Brooklawn – Big Gains in a Small Borough

Brooklawn is a tight-knit borough in Camden County, located near Gloucester City and just minutes from Philadelphia. Though only about half a square mile in size, it offers a blend of affordability, accessibility, and community that appeals to both new homeowners and long-term residents. Local schools, parks, and access to transit make it a smart choice for families and commuters alike.
The housing stock here is mostly older but well-kept, with many homes reflecting early- to mid-20th-century architecture. Brooklawn’s price surge aligns with broader interest in small, well-situated towns that still have room to grow. Its market is competitive but not overheated, and buyers continue to find strong value — especially compared to larger towns just a few miles away.
13. Pleasantville – 170.9% Home Price Increase Since 2013

- 2010: $123,629
- 2011: $106,621 (-$17,008, -13.76% from previous year)
- 2012: $94,606 (-$12,015, -11.27% from previous year)
- 2013: $89,412 (-$5,194, -5.49% from previous year)
- 2014: $91,169 (+$1,757, +1.96% from previous year)
- 2015: $94,816 (+$3,647, +4.00% from previous year)
- 2016: $87,806 (-$7,010, -7.39% from previous year)
- 2017: $75,619 (-$12,187, -13.88% from previous year)
- 2018: $89,569 (+$13,950, +18.45% from previous year)
- 2019: $110,554 (+$20,985, +23.43% from previous year)
- 2020: N/A
- 2021: $155,591 (+$45,038, +40.74% from previous year)
- 2022: $182,483 (+$26,892, +17.28% from previous year)
- 2023: $199,325 (+$16,841, +9.23% from previous year)
- 2024: $227,170 (+$27,845, +13.97% from previous year)
- 2025: $242,460 (+$15,290, +6.73% from previous year)
Pleasantville’s home values have surged an astounding 170% since 2013, making it one of the most dynamic housing markets on this list. From a low point in the mid-2010s, the town began gaining traction around 2018, with major price jumps post-2020. Despite this rapid rise, homes in Pleasantville are still far more affordable than those in neighboring beach towns, with a current average of $242,460 in 2025.
Pleasantville – Atlantic County’s Affordable Turnaround

Pleasantville is situated just west of Atlantic City and offers residents the convenience of coastal living without the inflated property costs. The town has long been home to working-class families and commuters, and over the last several years, it’s drawn interest from buyers priced out of the shore or seeking investment opportunities near the water. With schools, public transit, and easy access to the Atlantic City Expressway, it’s well connected without feeling crowded.
Much of the recent appreciation is driven by a shift in how buyers view proximity to Atlantic City. As that city reinvents itself, nearby areas like Pleasantville have become increasingly attractive. Revitalization efforts in local infrastructure, schools, and community development have also played a role. The result is a town on the rise — still affordable by statewide standards, but with clear momentum behind it.
12. Cedarville – 53.4% Home Price Increase Since 2016

- 2010: N/A
- 2011: N/A
- 2012: N/A
- 2013: N/A
- 2014: N/A
- 2015: N/A
- 2016: $157,674
- 2017: $162,373 (+$4,699, +2.98% from previous year)
- 2018: $155,195 (-$7,178, -4.42% from previous year)
- 2019: $158,392 (+$3,197, +2.06% from previous year)
- 2020: N/A
- 2021: $187,893 (+$29,501, +18.63% from previous year)
- 2022: $215,338 (+$27,445, +14.61% from previous year)
- 2023: $228,217 (+$12,878, +5.98% from previous year)
- 2024: $241,346 (+$13,129, +5.75% from previous year)
- 2025: $241,926 (+$580, +0.24% from previous year)
Home prices in Cedarville have climbed over 53% since 2016, with the most substantial jumps occurring between 2020 and 2022. While growth has slowed in the last two years, the town’s market has held its ground, suggesting that previous gains were based on sustained interest rather than speculation. At $241,926 in 2025, home prices remain reasonable, especially for buyers looking for peace, space, and rural charm.
Cedarville – Quiet Growth in a Serene Setting

Cedarville is a small village in Lawrence Township, Cumberland County. The town is defined by quiet roads, farmland, and a sense of community that appeals to buyers who value simplicity and space. With modest local development and minimal commercial sprawl, Cedarville has been largely spared from the rapid overbuilding seen elsewhere in the state. That makes its home price growth all the more notable — it’s happening quietly, but steadily.
Nature lovers are drawn to Cedarville’s proximity to the Cedar Lake Wildlife Management Area and surrounding natural preserves. While not a commuter hub, it offers enough accessibility to Bridgeton and Millville to meet everyday needs. The town’s affordability and slower pace have made it especially appealing post-2020, when remote work opened the door to lifestyle-based relocation. That trend appears to be sticking around, and Cedarville is reaping the benefits.
11. Paulsboro – 167% Home Price Increase Since 2013

- 2010: $122,404
- 2011: $112,744 (-$9,660, -7.89% from previous year)
- 2012: $102,099 (-$10,645, -9.44% from previous year)
- 2013: $88,010 (-$14,089, -13.80% from previous year)
- 2014: $94,836 (+$6,825, +7.76% from previous year)
- 2015: $89,492 (-$5,343, -5.63% from previous year)
- 2016: $94,546 (+$5,054, +5.65% from previous year)
- 2017: $91,919 (-$2,627, -2.78% from previous year)
- 2018: $90,967 (-$952, -1.04% from previous year)
- 2019: $106,450 (+$15,483, +17.02% from previous year)
- 2020: N/A
- 2021: $148,536 (+$42,086, +39.54% from previous year)
- 2022: $177,183 (+$28,647, +19.29% from previous year)
- 2023: $191,815 (+$14,632, +8.26% from previous year)
- 2024: $208,143 (+$16,328, +8.51% from previous year)
- 2025: $234,860 (+$26,717, +12.84% from previous year)
Paulsboro’s housing market has transformed dramatically over the past decade. From a post-recession low of $88,010 in 2013, prices have jumped more than 167%, reaching $234,860 in 2025. Much of this momentum has come since 2020, when the market caught fire due to a combination of affordability, proximity to major cities, and renewed investor attention.
Paulsboro – Working-Class Roots, Rising Market

Paulsboro is a riverside community in Gloucester County known for its industrial background and tight-knit neighborhoods. It lies just across the Delaware River from Wilmington and is less than 20 minutes from the Philadelphia metro area. That makes it attractive to commuters who want low home prices and quick highway access. The town is also home to the Port of Paulsboro, a key economic driver that continues to attract investment.
Despite its blue-collar image, Paulsboro has gained traction with first-time buyers and flippers seeking untapped potential. Renovations are becoming more common, and home values have responded. While the town still faces challenges, its market growth suggests growing confidence in its long-term prospects. For buyers who want a foot in the market before prices catch up to the region, Paulsboro offers real opportunity.
10. Salem – 88.5% Home Price Increase Since 2013

- 2010: $132,759
- 2011: $127,009 (-$5,750, -4.33% from previous year)
- 2012: $124,897 (-$2,112, -1.66% from previous year)
- 2013: $120,849 (-$4,048, -3.24% from previous year)
- 2014: $115,097 (-$5,752, -4.76% from previous year)
- 2015: $115,756 (+$659, +0.57% from previous year)
- 2016: $116,120 (+$364, +0.31% from previous year)
- 2017: $112,035 (-$4,085, -3.52% from previous year)
- 2018: $109,521 (-$2,514, -2.24% from previous year)
- 2019: $109,082 (-$439, -0.40% from previous year)
- 2020: N/A
- 2021: $160,355 (+$51,273, +47.00% from previous year)
- 2022: $178,289 (+$17,933, +11.18% from previous year)
- 2023: $197,265 (+$18,976, +10.64% from previous year)
- 2024: $214,803 (+$17,537, +8.89% from previous year)
- 2025: $227,944 (+$13,142, +6.12% from previous year)
Salem has experienced nearly 90% growth in average home values since 2013, with most of that gain coming since 2020. Once among the more stagnant markets in South Jersey, the city has shown that affordability, location, and even modest investment can create major returns. The current median of $227,944 still positions Salem as a strong value play in a rising market.
Salem – Historic Charm, Future Promise

Salem is the county seat of Salem County and one of New Jersey’s oldest towns, rich with colonial history and architecture. Located along the Salem River and just a short drive from the Delaware Memorial Bridge, the town has a quiet, almost pastoral feel that belies its strategic location. While it has long battled economic struggles, there are visible signs of revitalization — and buyers are responding.
Increased attention to historic preservation, waterfront redevelopment potential, and modest commercial improvements have brought a slow but steady turnaround. The post-2020 housing rush helped Salem get on the radar for buyers looking outside major metros. And while it’s not booming like some towns on this list, its numbers suggest a town with real staying power and a lot of room left to grow.
9. Whiting – 3.4% Home Price Increase Since 2024

- 2010: N/A
- 2011: N/A
- 2012: N/A
- 2013: N/A
- 2014: N/A
- 2015: N/A
- 2016: N/A
- 2017: N/A
- 2018: N/A
- 2019: N/A
- 2020: N/A
- 2021: N/A
- 2022: N/A
- 2023: N/A
- 2024: $215,861
- 2025: $223,152 (+$7,291, +3.38% from previous year)
Whiting has seen modest growth in the past year, with a 3.4% increase in average home prices between 2024 and 2025. While the town doesn’t have a long trail of historical data, the most recent figures show gentle appreciation that reflects a stable, low-pressure housing market. With home prices currently averaging $223,152, Whiting continues to provide affordability in a region where costs are climbing almost everywhere else.
Whiting – Retirement Living and Community Simplicity

Whiting, part of Manchester Township in Ocean County, is known for its retirement-friendly communities, peaceful neighborhoods, and proximity to the New Jersey Pine Barrens. It’s a destination that draws older adults seeking low-maintenance living, smaller homes, and a more relaxed lifestyle. The area is largely residential, dotted with senior villages and co-ops, and has become a go-to location for those wanting to stay in-state without breaking the bank.
Its market doesn’t move quickly, but that’s exactly what many buyers here appreciate. The 2025 increase is more of a slow, steady gain than a surge, and that reflects the town’s deliberate pace. Whiting offers access to nearby medical care, grocery shopping, and coastal amenities — all within a short drive — while retaining the quiet, secluded feel that sets it apart from larger Ocean County towns. For retirees or low-stress buyers, it’s one of the last places where affordability meets calm.
8. Atlantic City – 158.6% Home Price Increase Since 2016

- 2010: $145,615
- 2011: $122,043 (-$23,572, -16.19% from previous year)
- 2012: $111,508 (-$10,535, -8.63% from previous year)
- 2013: $106,713 (-$4,795, -4.30% from previous year)
- 2014: $97,562 (-$9,150, -8.57% from previous year)
- 2015: $100,206 (+$2,644, +2.71% from previous year)
- 2016: $85,121 (-$15,085, -15.05% from previous year)
- 2017: $77,904 (-$7,216, -8.48% from previous year)
- 2018: $90,599 (+$12,695, +16.30% from previous year)
- 2019: $105,786 (+$15,187, +16.76% from previous year)
- 2020: N/A
- 2021: $139,010 (+$33,224, +31.41% from previous year)
- 2022: $160,721 (+$21,711, +15.62% from previous year)
- 2023: $176,541 (+$15,819, +9.84% from previous year)
- 2024: $205,682 (+$29,141, +16.51% from previous year)
- 2025: $220,106 (+$14,424, +7.01% from previous year)
Atlantic City’s home values have more than doubled since 2016, increasing by nearly 159% over the past nine years. Once struggling with high vacancy rates and economic uncertainty, the city’s real estate market began rebounding in 2018, with an especially steep climb from 2020 onward. Despite the strong appreciation, the current average home price of $220,106 is still far below many other New Jersey shore towns.
Atlantic City – Rebound on the Boardwalk

Atlantic City needs no introduction. It’s long been known for its casinos, boardwalk, and boom-bust cycles. But in recent years, the narrative has been shifting. Casino revenues have stabilized, non-gambling investments have expanded, and residential demand — especially for smaller, more affordable properties — has surged. Neighborhoods previously overlooked by buyers are now attracting attention from those looking to live near the ocean without the price tag of places like Ocean City or Cape May.
Public investment in infrastructure and private-sector interest in developing housing near the Inlet and Chelsea Heights have helped lift local values. And with improvements in public safety and public schools underway, the city’s reputation is slowly improving. Buyers see potential, and the numbers reflect that shift. Atlantic City remains one of the most affordable beach towns in the Northeast — but that window may not stay open for long.
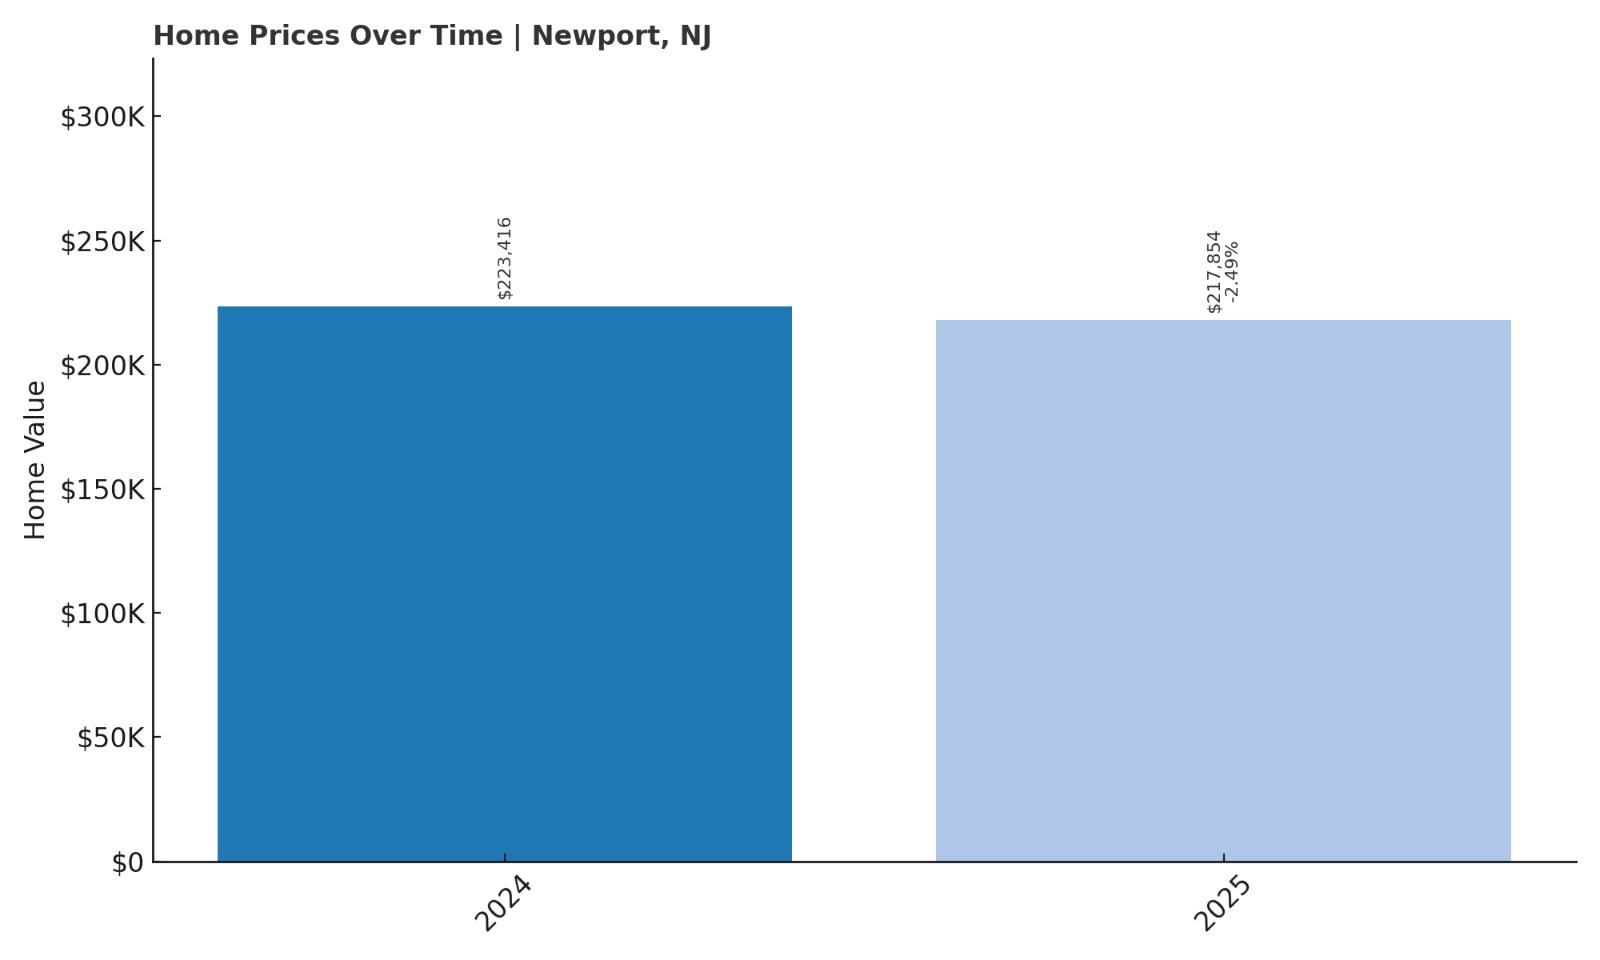
7. Newport – 2.5% Home Price Decrease Since 2024
- 2010: N/A
- 2011: N/A
- 2012: N/A
- 2013: N/A
- 2014: N/A
- 2015: N/A
- 2016: N/A
- 2017: N/A
- 2018: N/A
- 2019: N/A
- 2020: N/A
- 2021: N/A
- 2022: N/A
- 2023: N/A
- 2024: $223,416
- 2025: $217,854 (-$5,562, -2.49% from previous year)
Newport is one of the few towns on this list to see a recent decline in home prices, with values dropping by 2.5% between 2024 and 2025. With very limited historical data, it’s difficult to draw a long-term conclusion — but the most recent figures place the average home price at $217,854, which is still comfortably in affordable territory.
Newport – Coastal Simplicity at the Edge of South Jersey

Located in Downe Township along the Delaware Bay, Newport is a quiet, unincorporated village surrounded by marshland, water, and wildlife. It’s far from the commuter belts and commercial corridors, and that’s part of the draw. Life in Newport is slow, simple, and tied to the rhythms of the bay. Many homes here are small, seasonal, or older — which keeps prices down but also limits year-round demand.
The 2025 dip may reflect a cooling off after short-term interest in remote, coastal living during the pandemic years. With limited new construction and a very small inventory, even a handful of transactions can sway averages. Still, Newport remains an affordable option for buyers who want to be near the water without paying resort-town premiums. It may not be for everyone, but for those seeking peace and proximity to nature, it delivers.
6. Woodlynne – 250.3% Home Price Increase Since 2013

- 2010: $100,370
- 2011: $87,567 (-$12,803, -12.76% from previous year)
- 2012: $66,720 (-$20,847, -23.81% from previous year)
- 2013: $59,523 (-$7,197, -10.79% from previous year)
- 2014: $69,340 (+$9,817, +16.49% from previous year)
- 2015: $64,394 (-$4,946, -7.13% from previous year)
- 2016: $54,432 (-$9,962, -15.47% from previous year)
- 2017: $49,942 (-$4,490, -8.25% from previous year)
- 2018: $48,619 (-$1,324, -2.65% from previous year)
- 2019: $59,222 (+$10,603, +21.81% from previous year)
- 2020: N/A
- 2021: $100,358 (+$41,136, +69.46% from previous year)
- 2022: $135,587 (+$35,230, +35.10% from previous year)
- 2023: $149,093 (+$13,506, +9.96% from previous year)
- 2024: $178,401 (+$29,308, +19.66% from previous year)
- 2025: $208,585 (+$30,184, +16.92% from previous year)
Woodlynne has seen a staggering 250% increase in home prices since 2013 — the single largest percentage gain of any town on this list. After hitting a deep low during the mid-2010s, the local housing market surged starting in 2021, with major gains year after year. Today, average home values are approaching $209,000, signaling a dramatic transformation for this small borough.
Woodlynne – Compact, Connected, and on the Rise

Woodlynne is one of New Jersey’s smallest municipalities by land area, but it’s perfectly positioned near Camden and just a quick ride across the river from Philadelphia. With access to the PATCO Speedline and major highways, it’s one of the most commuter-friendly towns for buyers on a budget. The borough has historically faced challenges — including disinvestment and safety concerns — but it’s now attracting buyers who see potential where others once saw risk.
The affordability, combined with easy access to metro jobs, has turned Woodlynne into a magnet for first-time buyers, small investors, and anyone priced out of larger surrounding cities. Improvements in nearby Camden and gradual neighborhood reinvestment have added momentum. For those who can get past its gritty image, Woodlynne may offer some of the best dollar-for-dollar value in the entire region — and the price data backs that up.
5. Port Norris – 88.4% Home Price Increase Since 2016

- 2010: N/A
- 2011: N/A
- 2012: N/A
- 2013: N/A
- 2014: N/A
- 2015: N/A
- 2016: $101,517
- 2017: $104,129 (+$2,611, +2.57% from previous year)
- 2018: $95,795 (-$8,334, -8.00% from previous year)
- 2019: $97,750 (+$1,955, +2.04% from previous year)
- 2020: N/A
- 2021: $137,932 (+$40,182, +41.11% from previous year)
- 2022: $165,248 (+$27,315, +19.80% from previous year)
- 2023: $184,960 (+$19,713, +11.93% from previous year)
- 2024: $195,418 (+$10,458, +5.65% from previous year)
- 2025: $191,335 (-$4,083, -2.09% from previous year)
Port Norris home values have increased 88.4% since 2016, climbing from $101,517 to $191,335. After a brief dip in 2018, prices surged from 2021 onward, peaking in 2024 before a minor retreat in 2025.
Port Norris – Maritime Roots With Rising Interest

Port Norris is a small, historic fishing village in Cumberland County known for its oyster industry and proximity to the Delaware Bay. Though remote and quiet, its affordability and open space have made it more attractive in recent years, particularly to buyers seeking an off-the-grid lifestyle or investment opportunities in rural South Jersey.
The sharp home price growth in the early 2020s signals new demand, likely boosted by the remote work movement and a general shift toward rural properties. Even after the small decline in 2025, home values are still nearly double what they were less than a decade earlier. Port Norris remains an intriguing option for those looking beyond the typical commuter towns — and offers some of the most accessible prices near the water in New Jersey.
4. Deepwater – 7.3% Home Price Increase Since 2024

- 2010: N/A
- 2011: N/A
- 2012: N/A
- 2013: N/A
- 2014: N/A
- 2015: N/A
- 2016: N/A
- 2017: N/A
- 2018: N/A
- 2019: N/A
- 2020: N/A
- 2021: N/A
- 2022: N/A
- 2023: N/A
- 2024: $177,198
- 2025: $190,113 (+$12,915, +7.29% from previous year)
With data beginning in 2024, Deepwater home values rose by 7.3% in a single year, increasing from $177,198 to $190,113 in 2025. The lack of earlier data limits long-term trend analysis.
Deepwater – Strategic Access With Affordable Prices

Deepwater is an unincorporated area within Pennsville Township, situated along the Delaware River and close to major highways including the New Jersey Turnpike and I-295. The area is home to several large industrial facilities and is well positioned for commuters traveling into Delaware or northern parts of New Jersey.
Despite its industrial edge, Deepwater has remained surprisingly affordable. The limited available housing and unique geography may have kept demand modest until recently. As of 2025, it shows early signs of appreciation — and if regional development continues, Deepwater could see more significant gains in the coming years. For now, it stands out as one of New Jersey’s most affordable river-access points with convenient road links.
3. Penns Grove – 163.1% Home Price Increase Since 2010

- 2010: $70,697
- 2011: $66,929 (-$3,767, -5.33% from previous year)
- 2012: $65,772 (-$1,157, -1.73% from previous year)
- 2013: $63,184 (-$2,588, -3.93% from previous year)
- 2014: $57,151 (-$6,033, -9.55% from previous year)
- 2015: $57,167 (+$16, +0.03% from previous year)
- 2016: $63,168 (+$6,001, +10.50% from previous year)
- 2017: $64,364 (+$1,196, +1.89% from previous year)
- 2018: $70,292 (+$5,928, +9.21% from previous year)
- 2019: $65,408 (-$4,884, -6.95% from previous year)
- 2020: N/A
- 2021: $103,626 (+$38,218, +58.43% from previous year)
- 2022: $139,826 (+$36,200, +34.93% from previous year)
- 2023: $153,932 (+$14,107, +10.09% from previous year)
- 2024: $175,786 (+$21,854, +14.20% from previous year)
- 2025: $186,069 (+$10,283, +5.85% from previous year)
Penns Grove home prices have soared by 163.1% since 2010, from $70,697 to $186,069. A huge spike in 2021 led the charge, with further steady gains each year since.
Penns Grove – Explosive Growth on the Delaware

Penns Grove is a small borough along the Delaware River in Salem County, just across from Wilmington, Delaware. Once a shipping and manufacturing hub, the town experienced long periods of economic stagnation — but that changed dramatically after 2020. The real estate data reveals an extraordinary surge, with home prices jumping over 58% in 2021 alone.
The town’s location, low property taxes, and proximity to Delaware job markets make it a standout option for first-time buyers and investors. While challenges remain, including older housing stock and infrastructure needs, the data clearly shows that the market sees value here. The continued price appreciation into 2025 reinforces Penns Grove’s emergence as one of New Jersey’s fastest-rising affordable towns.
2. Fortescue – 5.1% Home Price Increase Since 2024

- 2010: N/A
- 2011: N/A
- 2012: N/A
- 2013: N/A
- 2014: N/A
- 2015: N/A
- 2016: N/A
- 2017: N/A
- 2018: N/A
- 2019: N/A
- 2020: N/A
- 2021: N/A
- 2022: N/A
- 2023: N/A
- 2024: $165,361
- 2025: $173,872 (+$8,510, +5.15% from previous year)
Fortescue home prices rose 5.1% between 2024 and 2025, increasing from $165,361 to $173,872. There’s no earlier data, but even this short window shows steady growth.
Fortescue – Bayside Affordability With Room to Grow

Fortescue is a bayside village in Downe Township, Cumberland County. Often called the “Weakfish Capital of the World,” it’s a popular destination for fishing and boating, with a population that fluctuates seasonally. Housing here is limited, and the area remains under the radar even for in-state buyers, making it one of New Jersey’s most affordable waterfront communities.
Real estate activity in Fortescue is low-volume, so year-to-year changes may reflect only a handful of transactions. Still, a 5% increase in one year hints at growing interest. For buyers looking for solitude near the Delaware Bay — and who are willing to trade convenience for a unique coastal lifestyle — Fortescue delivers remarkable value.
1. Camden – 59.5% Home Price Increase Since 2010

- 2010: $95,656
- 2011: $87,548 (-$8,107, -8.48% from previous year)
- 2012: $73,661 (-$13,887, -15.86% from previous year)
- 2013: $65,598 (-$8,064, -10.95% from previous year)
- 2014: $64,831 (-$767, -1.17% from previous year)
- 2015: $66,295 (+$1,464, +2.26% from previous year)
- 2016: $61,348 (-$4,947, -7.46% from previous year)
- 2017: $62,091 (+$743, +1.21% from previous year)
- 2018: $63,453 (+$1,362, +2.19% from previous year)
- 2019: $74,255 (+$10,801, +17.02% from previous year)
- 2020: N/A
- 2021: $101,867 (+$27,613, +37.19% from previous year)
- 2022: $115,584 (+$13,717, +13.47% from previous year)
- 2023: $115,888 (+$304, +0.26% from previous year)
- 2024: $140,768 (+$24,880, +21.47% from previous year)
- 2025: $152,562 (+$11,794, +8.38% from previous year)
Camden home prices have risen 59.5% since 2010, from $95,656 to $152,562. After years of stagnation, the market took off in 2021 and continues to grow steadily through 2025.
Camden – Rebuilding Momentum in New Jersey’s Toughest Market

Camden has long been one of the most challenged cities in New Jersey, grappling with poverty, crime, and underinvestment for decades. But recent years have brought new energy to its housing market, driven by redevelopment projects, expanding educational institutions like Rutgers–Camden, and an influx of buyers seeking affordability close to Philadelphia.
The 2021 price jump was a turning point, and values have climbed year over year since then. Despite that growth, Camden remains one of the cheapest cities in the state — which makes it both a risky and potentially rewarding option for buyers and investors. The city’s direction is still evolving, but for those watching long-term affordability trends, Camden is impossible to ignore.