
Minnesota’s high-end housing markets haven’t just held steady—they’ve surged. According to data from the Zillow Home Value Index, these 20 towns now top the charts for property values, with long-term growth that’s outpaced much of the state. From secluded lakeside retreats to affluent commuter suburbs near the Twin Cities, these communities reflect where demand has stayed strong—and prices have kept climbing. In some cases, home values have more than doubled since 2010, driven by limited supply, luxury appeal, and decades of steady development.
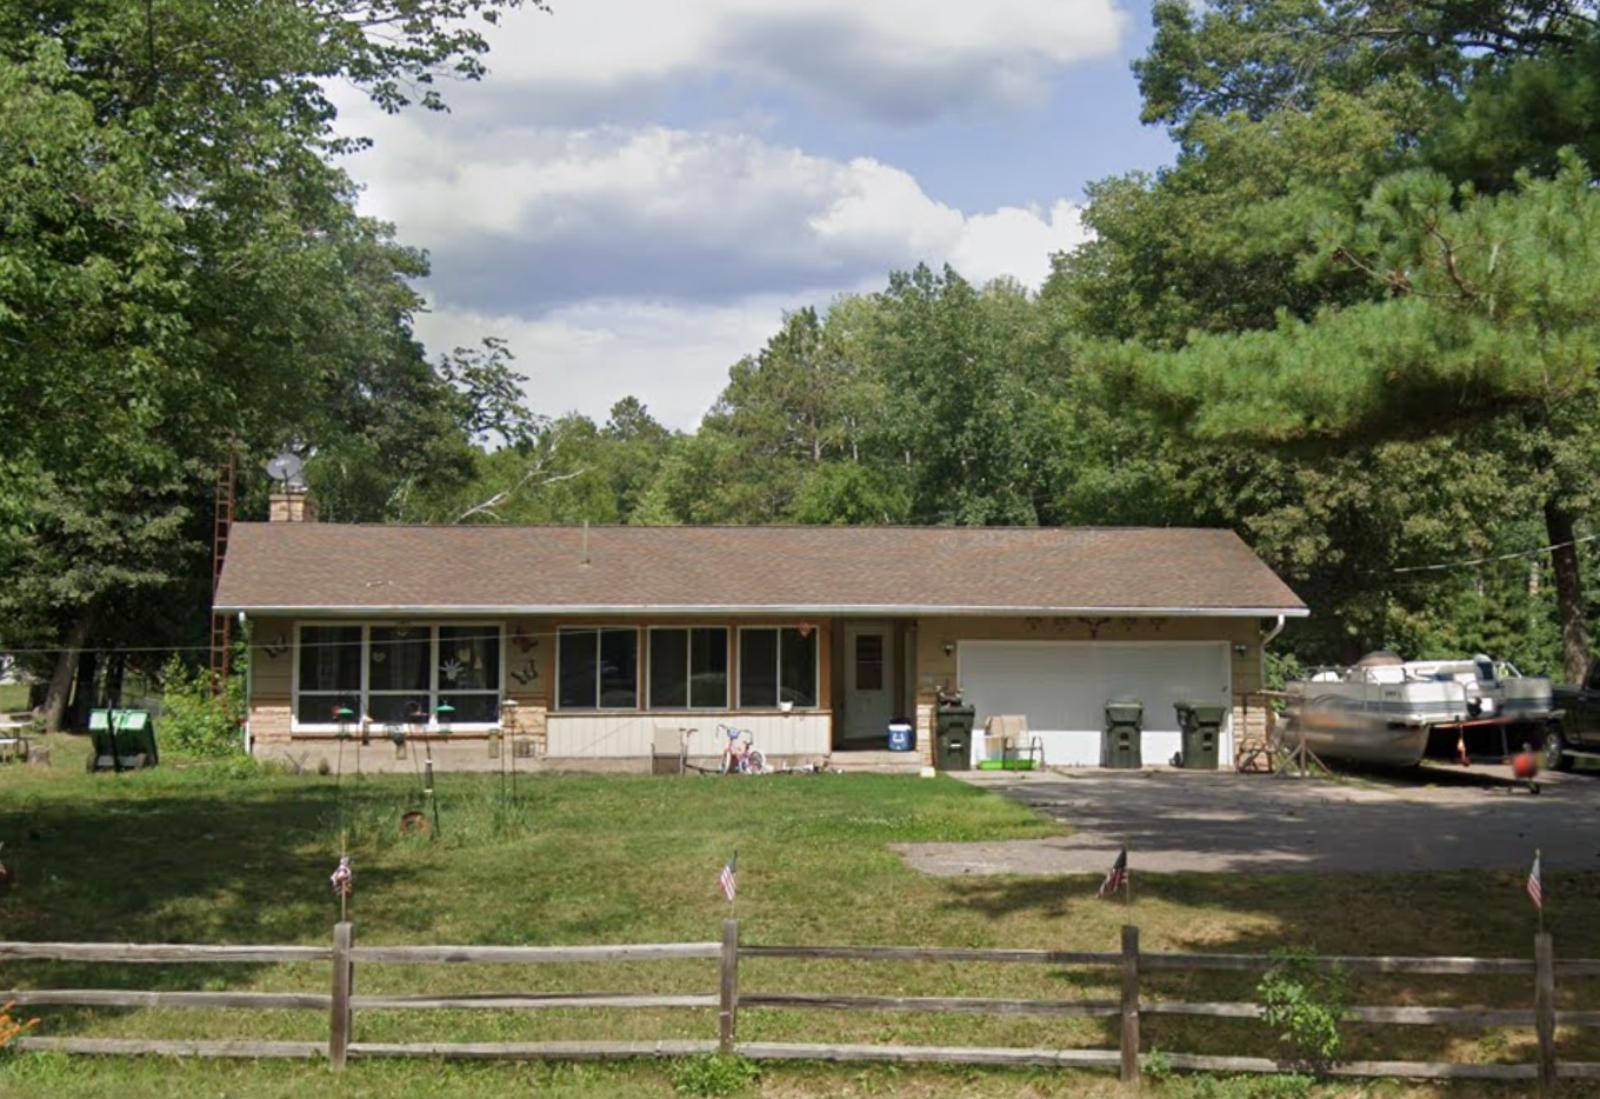
20. East Gull Lake – 116% Home Price Increase Since 2011
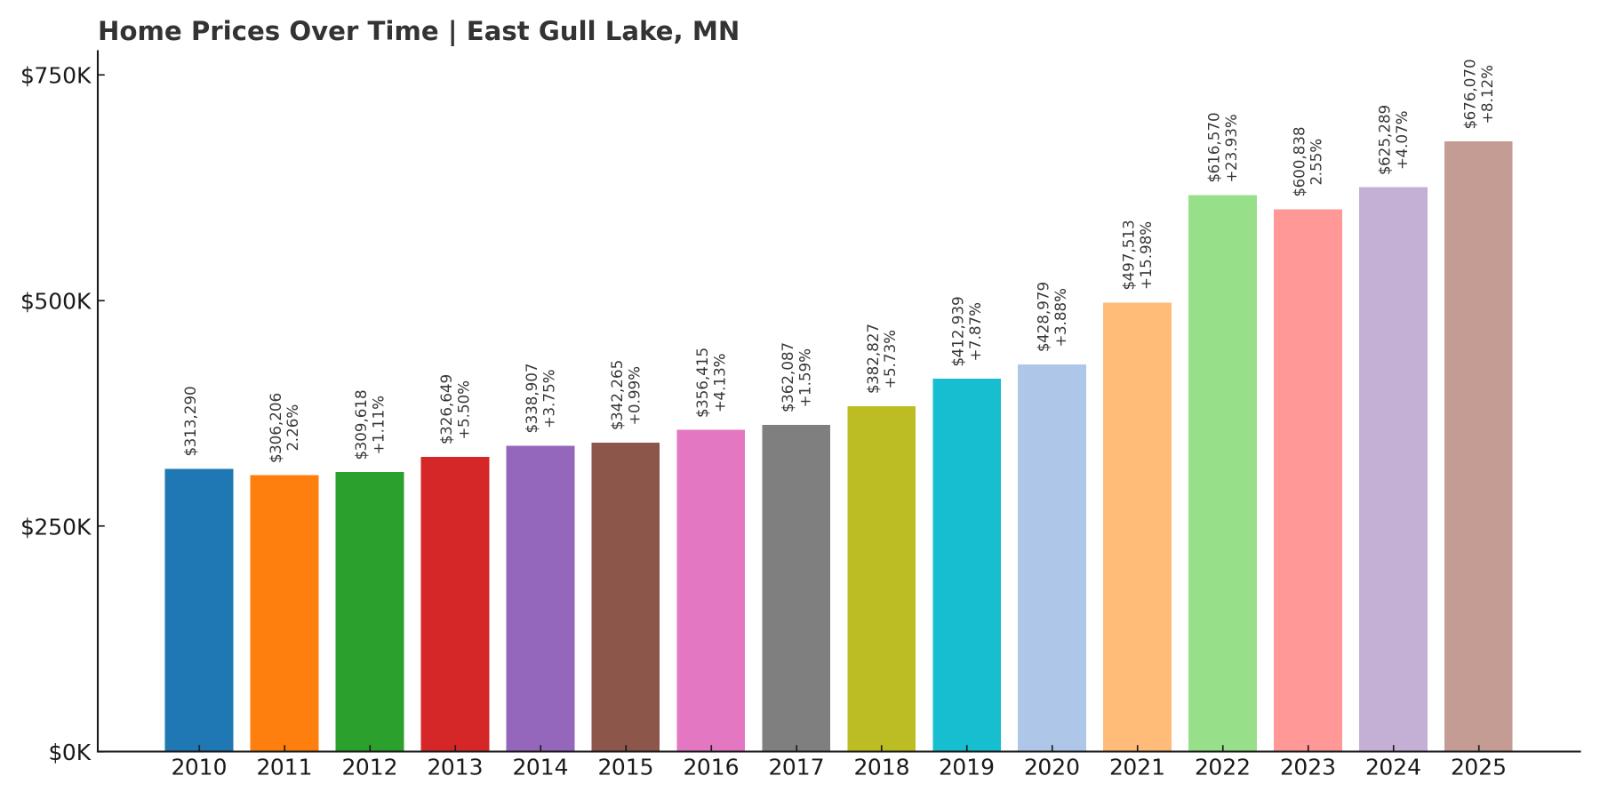
- 2010: $313,290
- 2011: $306,206 (−$7,084, −2.26% from previous year)
- 2012: $309,618 (+$3,412, +1.11% from previous year)
- 2013: $326,649 (+$17,031, +5.50% from previous year)
- 2014: $338,907 (+$12,258, +3.75% from previous year)
- 2015: $342,265 (+$3,358, +0.99% from previous year)
- 2016: $356,415 (+$14,150, +4.13% from previous year)
- 2017: $362,087 (+$5,672, +1.59% from previous year)
- 2018: $382,827 (+$20,740, +5.73% from previous year)
- 2019: $412,939 (+$30,112, +7.87% from previous year)
- 2020: $428,979 (+$16,040, +3.88% from previous year)
- 2021: $497,513 (+$68,534, +15.98% from previous year)
- 2022: $616,570 (+$119,057, +23.93% from previous year)
- 2023: $600,838 (−$15,732, −2.55% from previous year)
- 2024: $625,289 (+$24,451, +4.07% from previous year)
- 2025: $676,070 (+$50,781, +8.12% from previous year)
East Gull Lake has more than doubled in home value since 2011, climbing from just over $300,000 to more than $676,000 by May 2025. The town saw especially sharp growth during the pandemic-era boom, with an eye-catching 23.9% jump in 2022 alone. Though there was a slight dip in 2023, the trend quickly reversed, with strong gains continuing through 2025. The consistent upward momentum points to both demand and resilience in this lakeside market, where buyers appear willing to pay a premium.
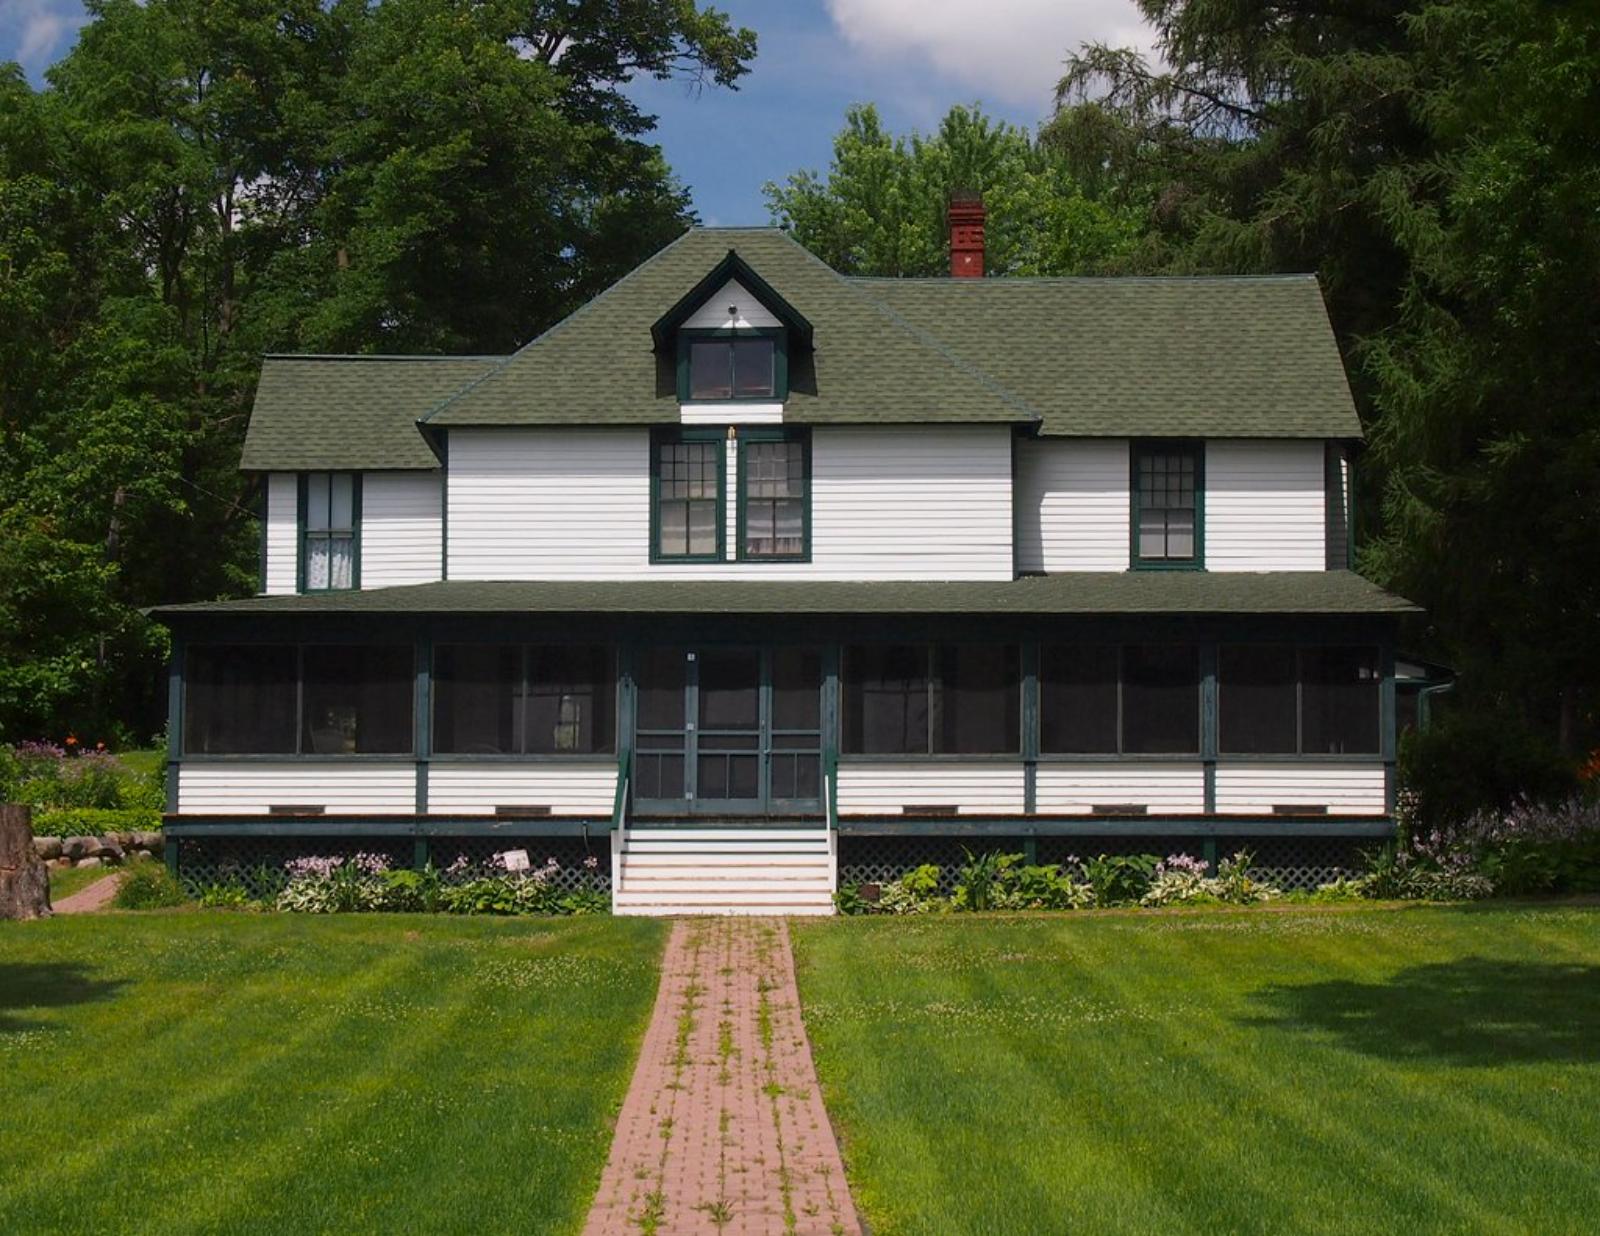
East Gull Lake – Luxury Living Along the Water
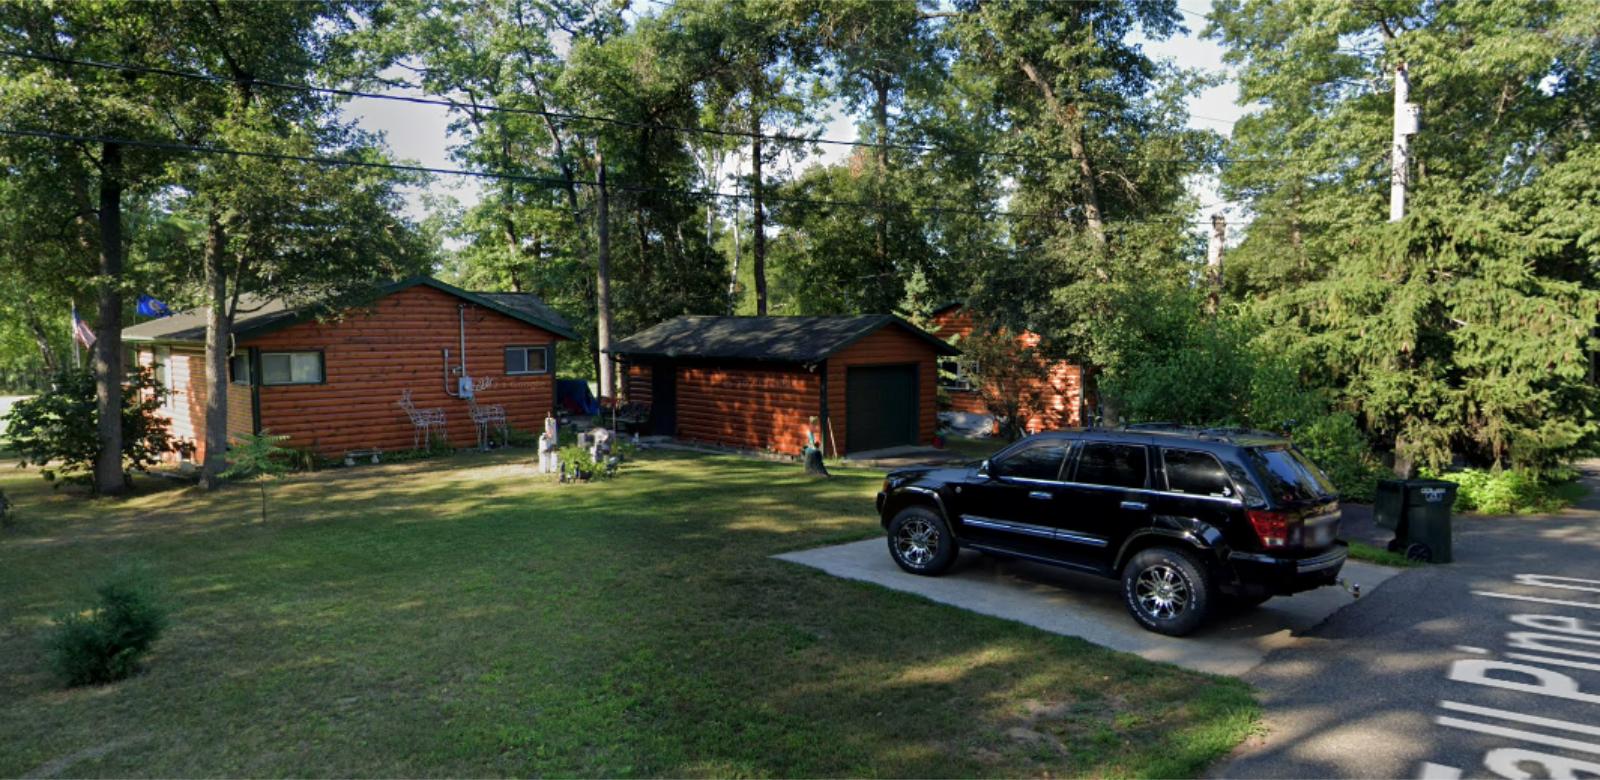
Nestled in Crow Wing County, East Gull Lake is known for its scenic beauty and lakeside properties. It’s a popular destination for both seasonal visitors and permanent residents looking for tranquility without sacrificing comfort. Proximity to Gull Lake and recreational amenities like golf resorts and fishing docks make this town attractive to high-end buyers. The growth in home prices is closely tied to its desirable waterfront setting and a limited housing supply that has struggled to keep up with demand.
While not a large town, East Gull Lake continues to draw affluent homebuyers who value privacy and nature. It’s also near Brainerd, which provides access to more urban conveniences while preserving the town’s secluded feel. The significant price increase since 2011 reflects both regional appeal and the national trend of lakefront properties gaining value. Despite a small drop in 2023, the local market remains robust, with 2025 prices posting strong year-over-year gains.
19. Minnetrista – 67% Home Price Increase Since 2012
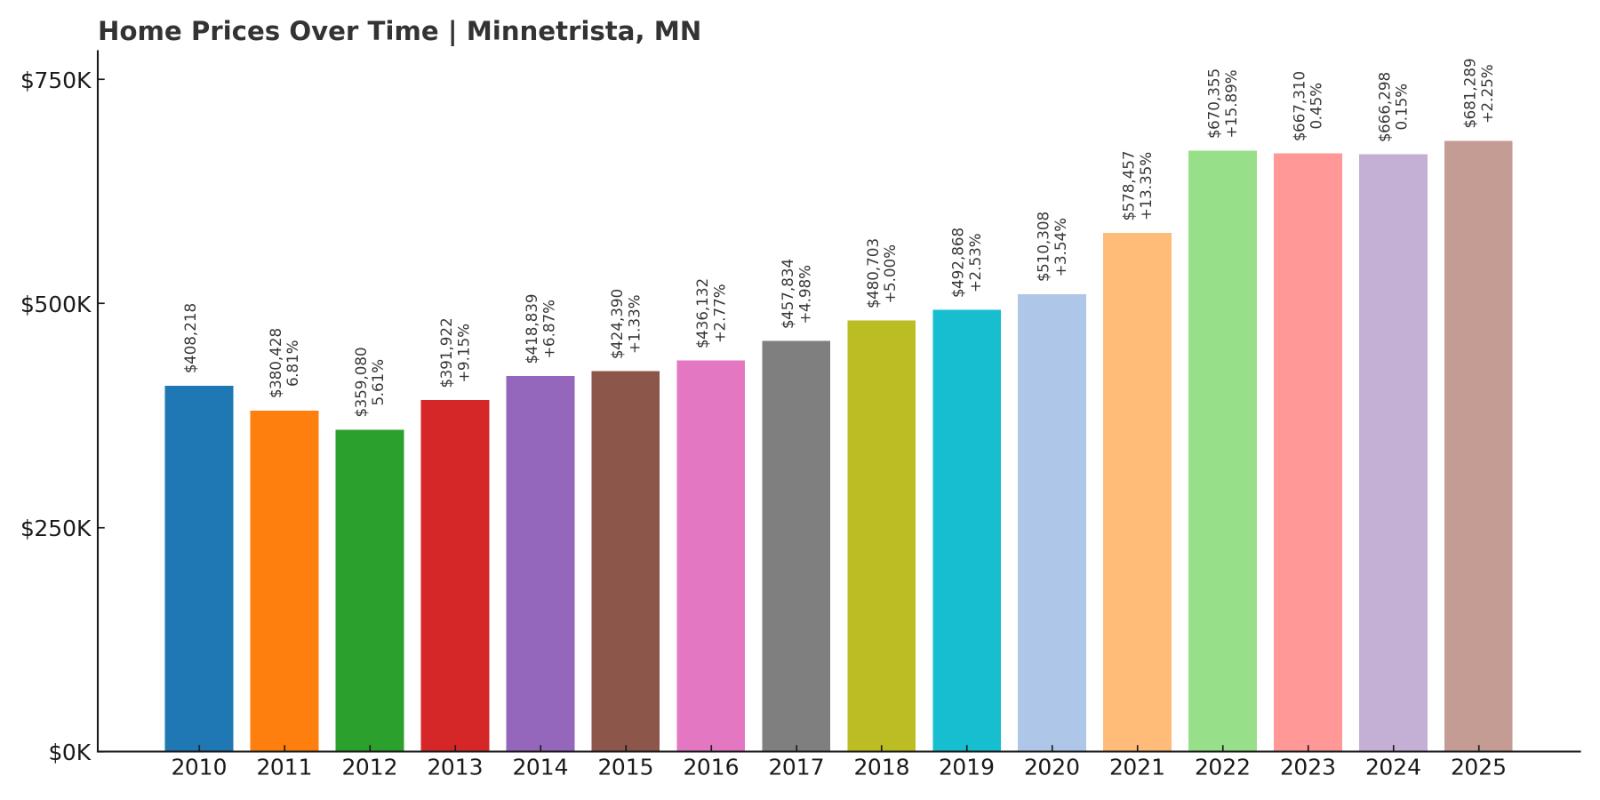
- 2010: $408,218
- 2011: $380,428 (−$27,790, −6.81% from previous year)
- 2012: $359,080 (−$21,348, −5.61% from previous year)
- 2013: $391,922 (+$32,842, +9.15% from previous year)
- 2014: $418,839 (+$26,917, +6.87% from previous year)
- 2015: $424,390 (+$5,551, +1.33% from previous year)
- 2016: $436,132 (+$11,742, +2.77% from previous year)
- 2017: $457,834 (+$21,702, +4.98% from previous year)
- 2018: $480,703 (+$22,869, +5.00% from previous year)
- 2019: $492,868 (+$12,165, +2.53% from previous year)
- 2020: $510,308 (+$17,440, +3.54% from previous year)
- 2021: $578,457 (+$68,149, +13.35% from previous year)
- 2022: $670,355 (+$91,898, +15.89% from previous year)
- 2023: $667,310 (−$3,045, −0.45% from previous year)
- 2024: $666,298 (−$1,012, −0.15% from previous year)
- 2025: $681,289 (+$14,991, +2.25% from previous year)
Minnetrista’s home prices hit a low point in 2012 at $359,080, but have since climbed steadily to $681,289 by 2025—a 67% increase over 13 years. The strongest momentum came during the years from 2020 to 2022, when home prices jumped nearly $160,000. Although growth plateaued in 2023 and 2024, the market returned to positive territory in 2025, showing slow but stable upward movement. For buyers and investors, this long-term trend signals steady appreciation with minimal volatility.
Minnetrista – Suburban Appeal With Space to Spare
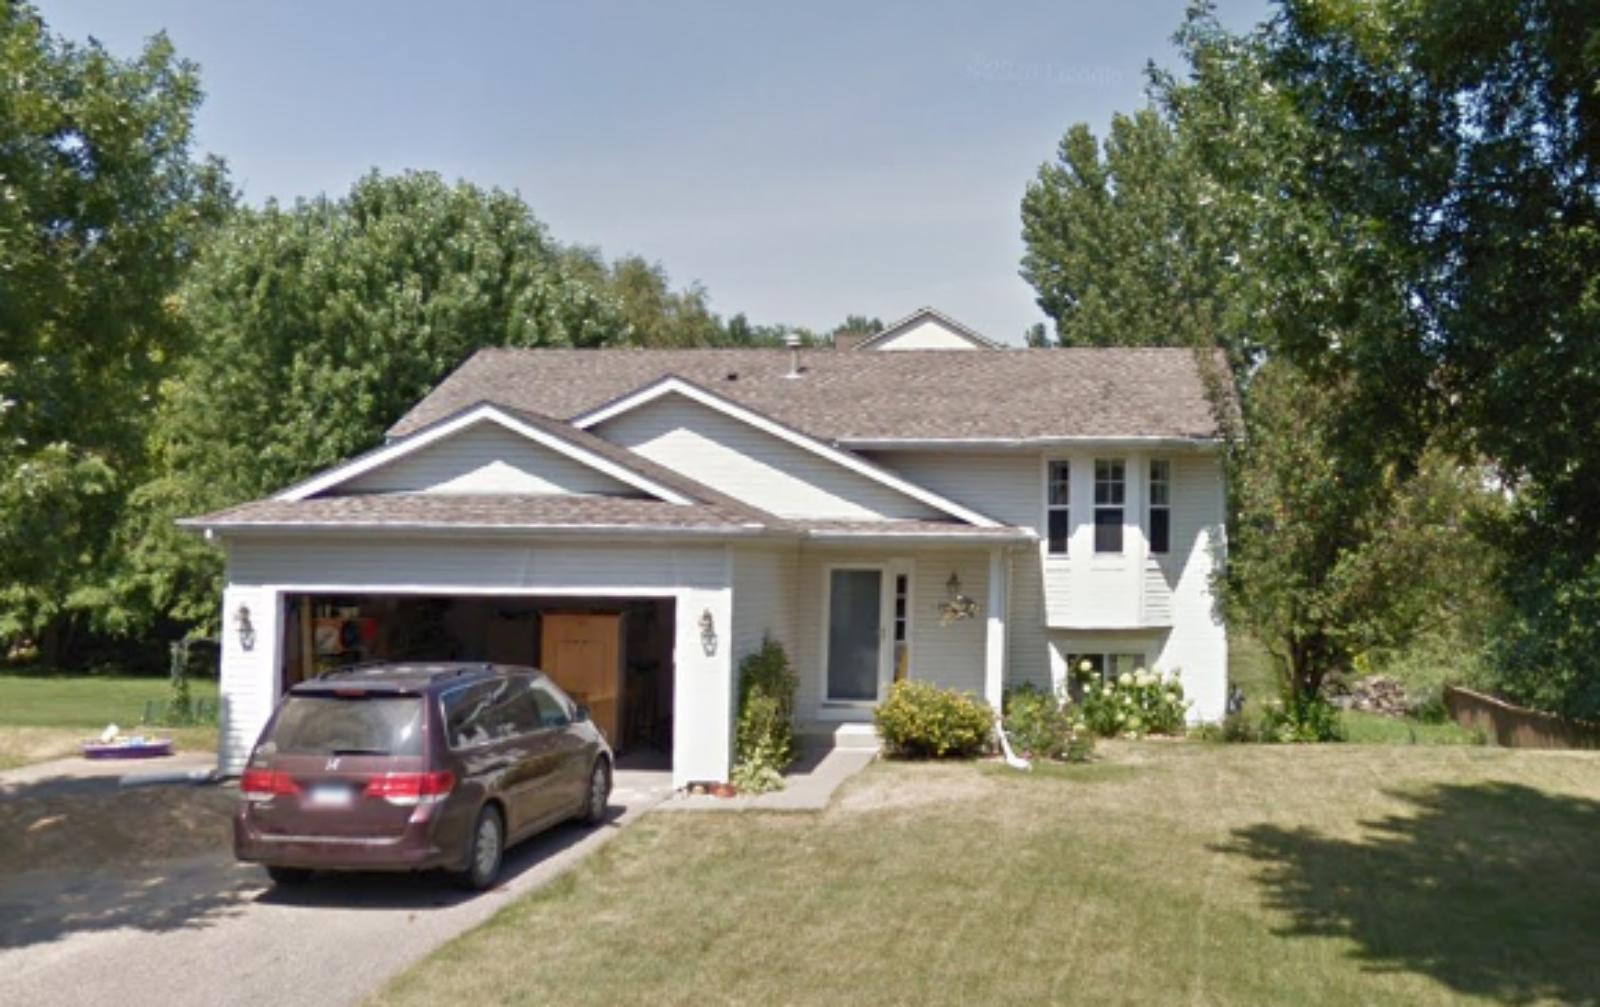
Located on the western edge of the Twin Cities metro, Minnetrista is prized for its blend of rural charm and suburban convenience. With Lake Minnetonka nearby and ample green space, it’s become a preferred spot for families seeking privacy without a long commute. The housing stock leans toward larger homes with bigger lots, catering to buyers who want both space and scenery. The area’s growth over the past decade reflects both local development and a strong regional housing market.
The significant appreciation since 2012 is closely tied to demographic shifts favoring more space and nature. Minnetrista’s affordability relative to nearby lakeside towns also helped fuel demand. Even during years when other markets saw dips, Minnetrista remained relatively stable. While the recent price plateau might suggest a cooling trend, the town’s fundamentals—location, quality of life, and lot sizes—make it a long-term contender in the premium housing market.
18. Grant – 99% Home Price Increase Since 2012
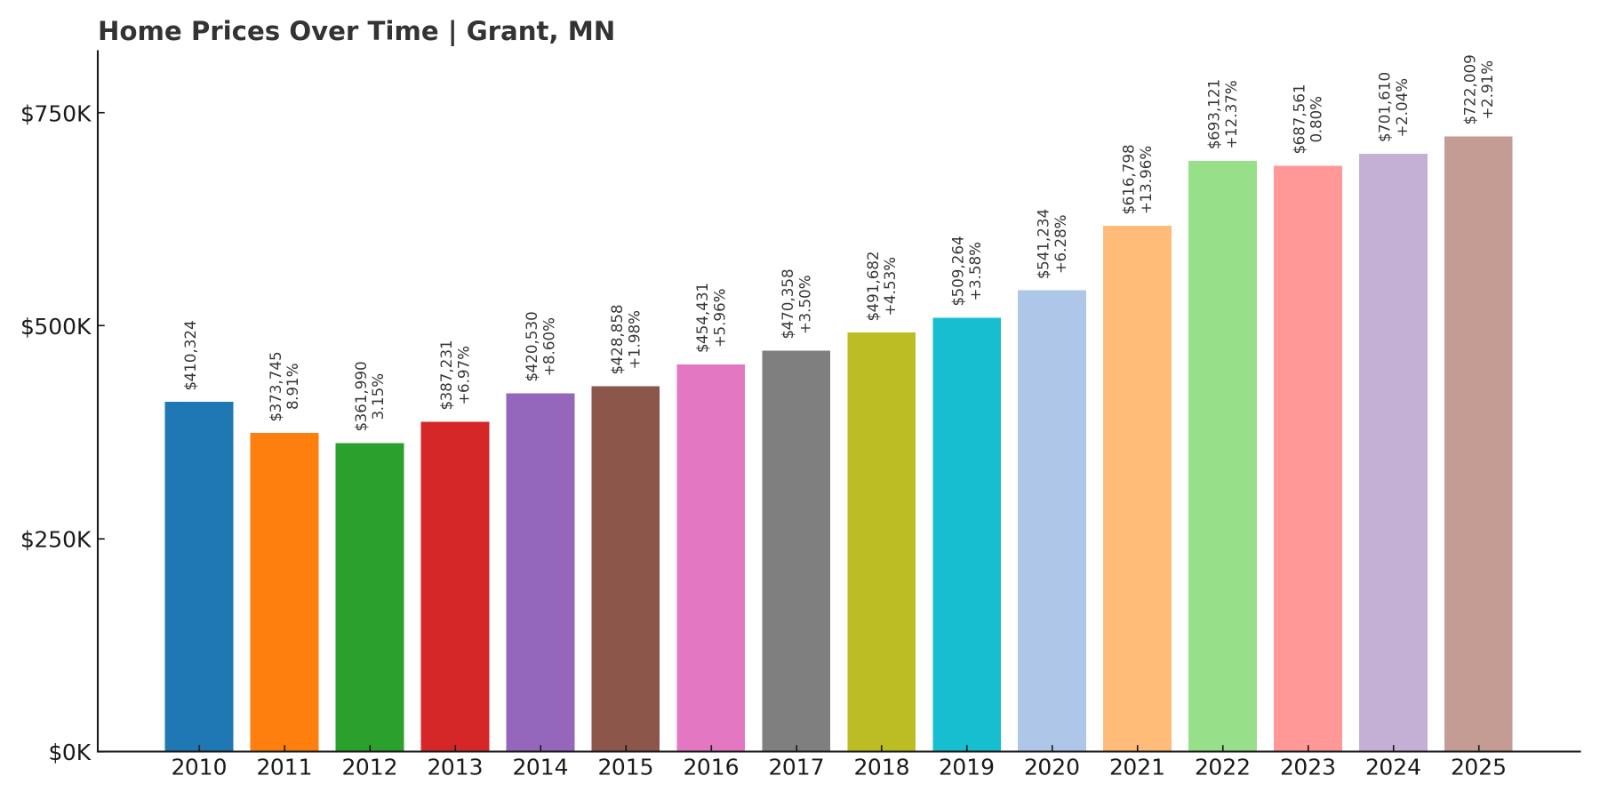
- 2010: $410,324
- 2011: $373,745 (−$36,579, −8.91% from previous year)
- 2012: $361,990 (−$11,755, −3.15% from previous year)
- 2013: $387,231 (+$25,241, +6.97% from previous year)
- 2014: $420,530 (+$33,299, +8.60% from previous year)
- 2015: $428,858 (+$8,328, +1.98% from previous year)
- 2016: $454,431 (+$25,573, +5.96% from previous year)
- 2017: $470,358 (+$15,927, +3.50% from previous year)
- 2018: $491,682 (+$21,324, +4.53% from previous year)
- 2019: $509,264 (+$17,582, +3.58% from previous year)
- 2020: $541,234 (+$31,970, +6.28% from previous year)
- 2021: $616,798 (+$75,564, +13.96% from previous year)
- 2022: $693,121 (+$76,323, +12.37% from previous year)
- 2023: $687,561 (−$5,560, −0.80% from previous year)
- 2024: $701,610 (+$14,049, +2.04% from previous year)
- 2025: $722,009 (+$20,399, +2.91% from previous year)
Grant’s home values have nearly doubled since 2012, rising from $361,990 to $722,009 by 2025. The town has experienced consistent year-over-year growth, with the exception of a very minor drop in 2023. Notably, prices surged from 2020 to 2022, when the market jumped more than $150,000 in just two years. Even before that, the town showed reliable appreciation, especially in the mid-2010s, reflecting strong demand and a tight housing inventory. The last three years have seen the market slow, but still remain positive, suggesting a more sustainable pace of growth as the market stabilizes. While 2023’s decline might seem concerning on paper, the very next year saw prices recover and even exceed previous highs. Overall, Grant’s long-term trend remains upward, making it a standout among Minnesota’s higher-end markets.
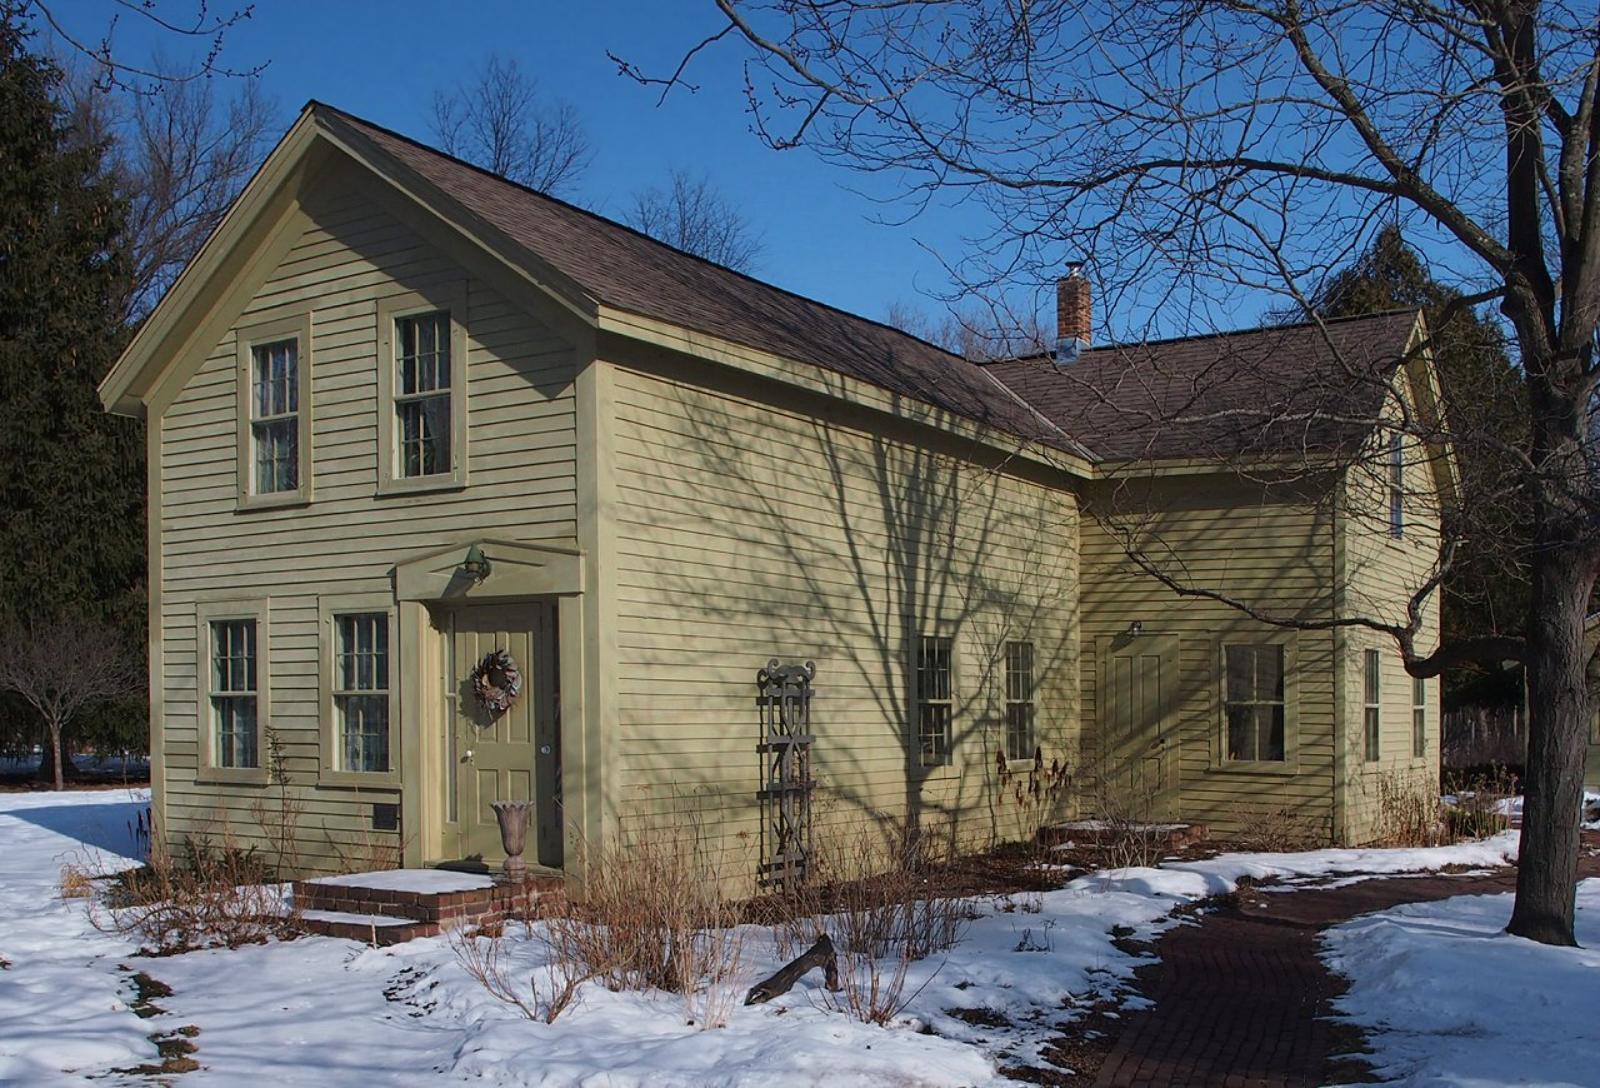
Grant – A Rural Retreat With Metro Proximity
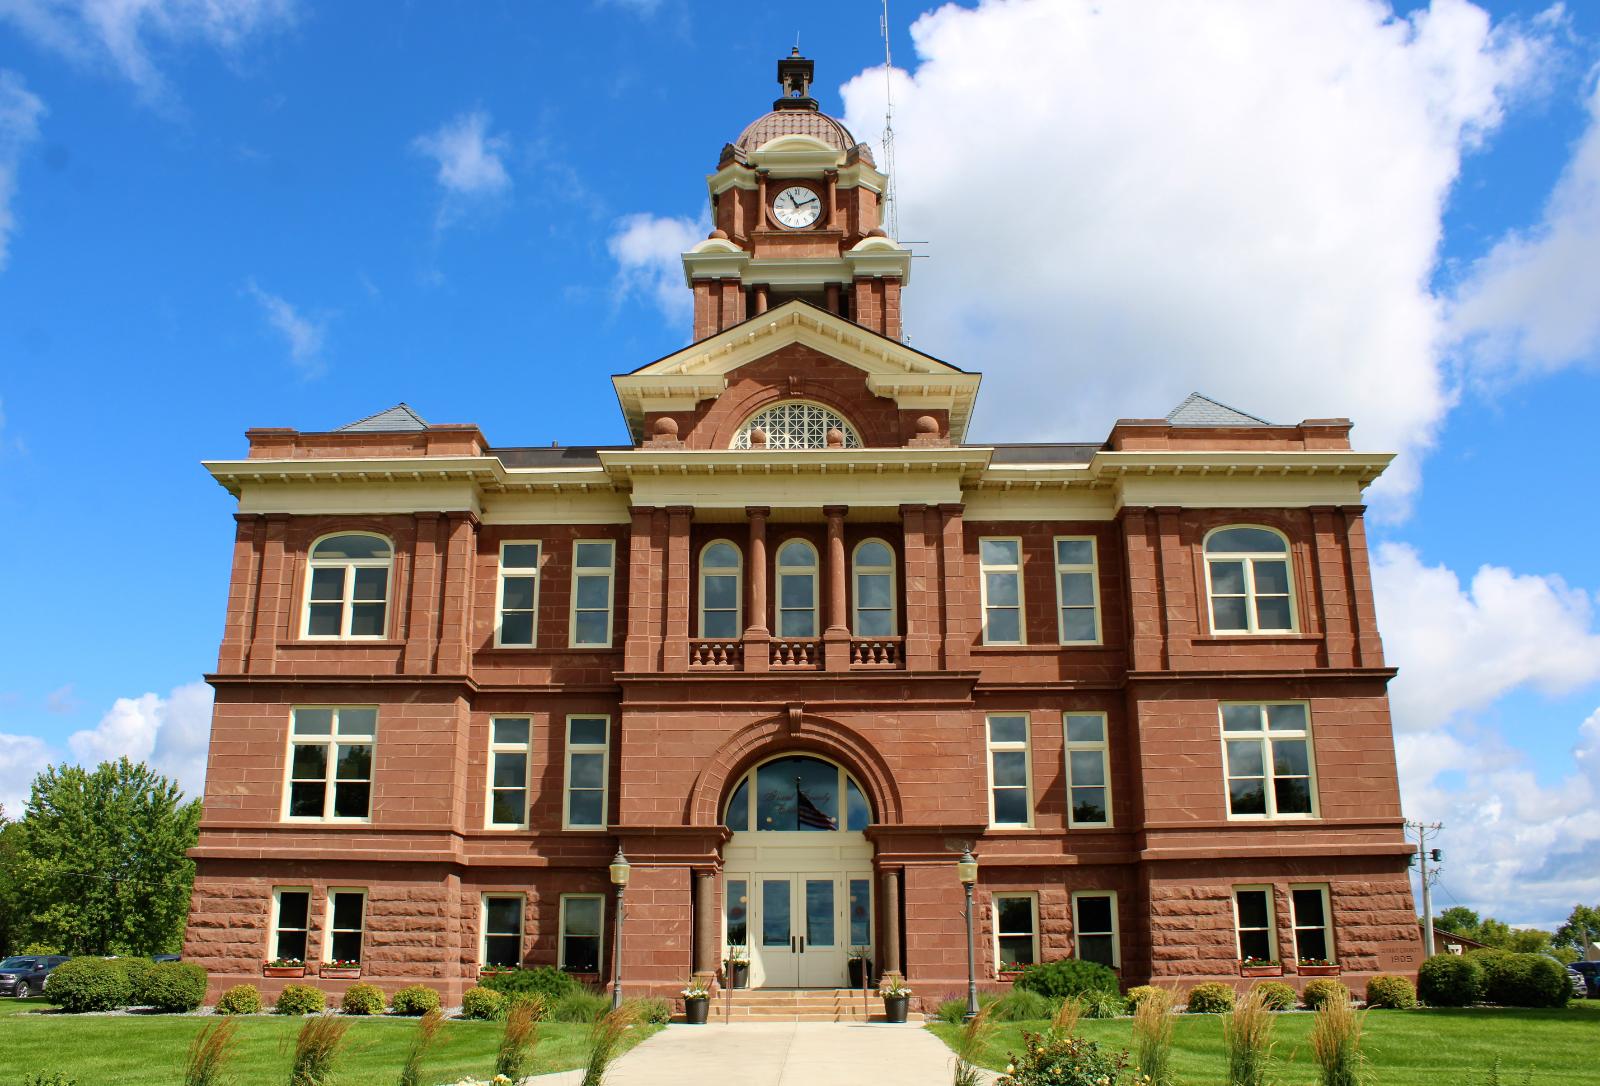
Grant sits in Washington County, northeast of the Twin Cities, and blends rural charm with easy access to major employment and shopping centers. The town is known for its large lots, open landscapes, and a strong preference for single-family homes. There’s very little commercial development within Grant, which helps preserve its quiet, pastoral setting — an intentional choice that has attracted a specific type of buyer over the years. Many residents choose Grant for its space and tranquility, often working remotely or commuting into Saint Paul or Minneapolis just 20–30 minutes away. The community is served by the well-rated Mahtomedi School District, which further boosts its appeal for families seeking an upscale lifestyle away from denser suburbs. Home styles range from modern custom builds to expansive country estates, often set back from the road and surrounded by trees. These characteristics make Grant’s housing stock both desirable and limited — and as demand continues to outweigh supply, home values have naturally trended upward. The town’s popularity with upper-income professionals and retirees alike keeps it firmly on the radar for buyers seeking space, privacy, and proximity.
In the wake of the 2020 pandemic, when many Minnesotans began valuing space and nature more than ever before, Grant saw a new wave of interest. The town benefited directly from that shift, with housing prices rising rapidly as more families looked for larger homes on bigger parcels of land. The strong rise from 2020 to 2022 reflects this behavioral change in buyer preferences. Even though 2023 saw a slight pullback, the local market corrected swiftly, and by 2025 prices were back up and growing again. Unlike areas where the rapid price hikes were followed by hard crashes, Grant’s recovery was stable and backed by continued interest. As long as families continue seeking out towns that offer both seclusion and access, Grant is likely to remain one of Minnesota’s most appealing premium communities. Its historical price path, current value, and sustained desirability suggest it’s a long-term investment market with strong fundamentals.
17. Afton – 107% Home Price Increase Since 2012

- 2010: $394,180
- 2011: $388,082 (−$6,098, −1.55% from previous year)
- 2012: $349,039 (−$39,043, −10.06% from previous year)
- 2013: $371,127 (+$22,088, +6.33% from previous year)
- 2014: $415,782 (+$44,655, +12.03% from previous year)
- 2015: $420,531 (+$4,749, +1.14% from previous year)
- 2016: $450,526 (+$29,995, +7.13% from previous year)
- 2017: $466,826 (+$16,300, +3.62% from previous year)
- 2018: $489,631 (+$22,805, +4.89% from previous year)
- 2019: $511,657 (+$22,026, +4.50% from previous year)
- 2020: $534,805 (+$23,148, +4.52% from previous year)
- 2021: $612,867 (+$78,062, +14.60% from previous year)
- 2022: $708,422 (+$95,555, +15.59% from previous year)
- 2023: $698,394 (−$10,028, −1.42% from previous year)
- 2024: $700,039 (+$1,645, +0.24% from previous year)
- 2025: $723,415 (+$23,376, +3.34% from previous year)
Afton’s real estate market tells a story of resilience and long-term growth. After bottoming out in 2012 at $349,039, home values more than doubled by 2025, reaching $723,415. The strongest upward movement occurred during the years 2020 through 2022, when prices leapt nearly $175,000 in just two years. While 2023 brought a minor price decline, it was quickly followed by a rebound, and the 2025 value surpassed all previous highs. This steady trend of long-term appreciation, punctuated by short periods of correction, suggests a healthy and maturing market. For a town with a relatively low housing density, Afton has seen an outsized price performance thanks to its strong local appeal. The consistent growth across more than a decade supports its place on this list of Minnesota’s top-tier housing markets.
Afton – Scenic Hills, River Views, and Lasting Appeal
Afton, located in Washington County along the scenic St. Croix River, is one of the state’s most picturesque small towns. Known for its rolling hills, wooded lots, and charming downtown, it has quietly become a favorite among high-income buyers seeking a mix of nature, privacy, and class. The town is home to Afton Alps, one of Minnesota’s largest ski areas, which brings in year-round visitors and helps support a vibrant local economy despite its small size. With strict zoning laws and a commitment to preserving green space, the housing supply in Afton is intentionally limited — which keeps demand high and competition stiff. Many homes here are custom builds or historic properties with unique architectural features and generous land. This exclusivity adds to the market’s upward pressure, contributing directly to the price gains seen in the past decade. And while it’s close enough to the Twin Cities to be commutable, Afton feels worlds away, offering a lifestyle that blends rural serenity with upscale living.
Another factor in Afton’s popularity is its access to outdoor recreation and protected natural areas, which have only grown more valuable in recent years. With many families re-evaluating lifestyle choices after the pandemic, buyers began to prioritize settings like Afton that offered open spaces, fresh air, and room to grow. The result was a rapid surge in demand between 2020 and 2022, mirroring what was seen in other rural-luxury markets nationwide. Unlike more volatile urban markets, Afton held onto its gains, even with a brief dip in 2023. Buyers appear undeterred, with 2025 showing renewed growth as the town reaffirms its long-term value. The combination of location, aesthetics, and land use policy continues to keep Afton firmly planted on the radar of buyers who want privacy and prestige without sacrificing natural beauty.
16. Lake Shore – 133% Home Price Increase Since 2011
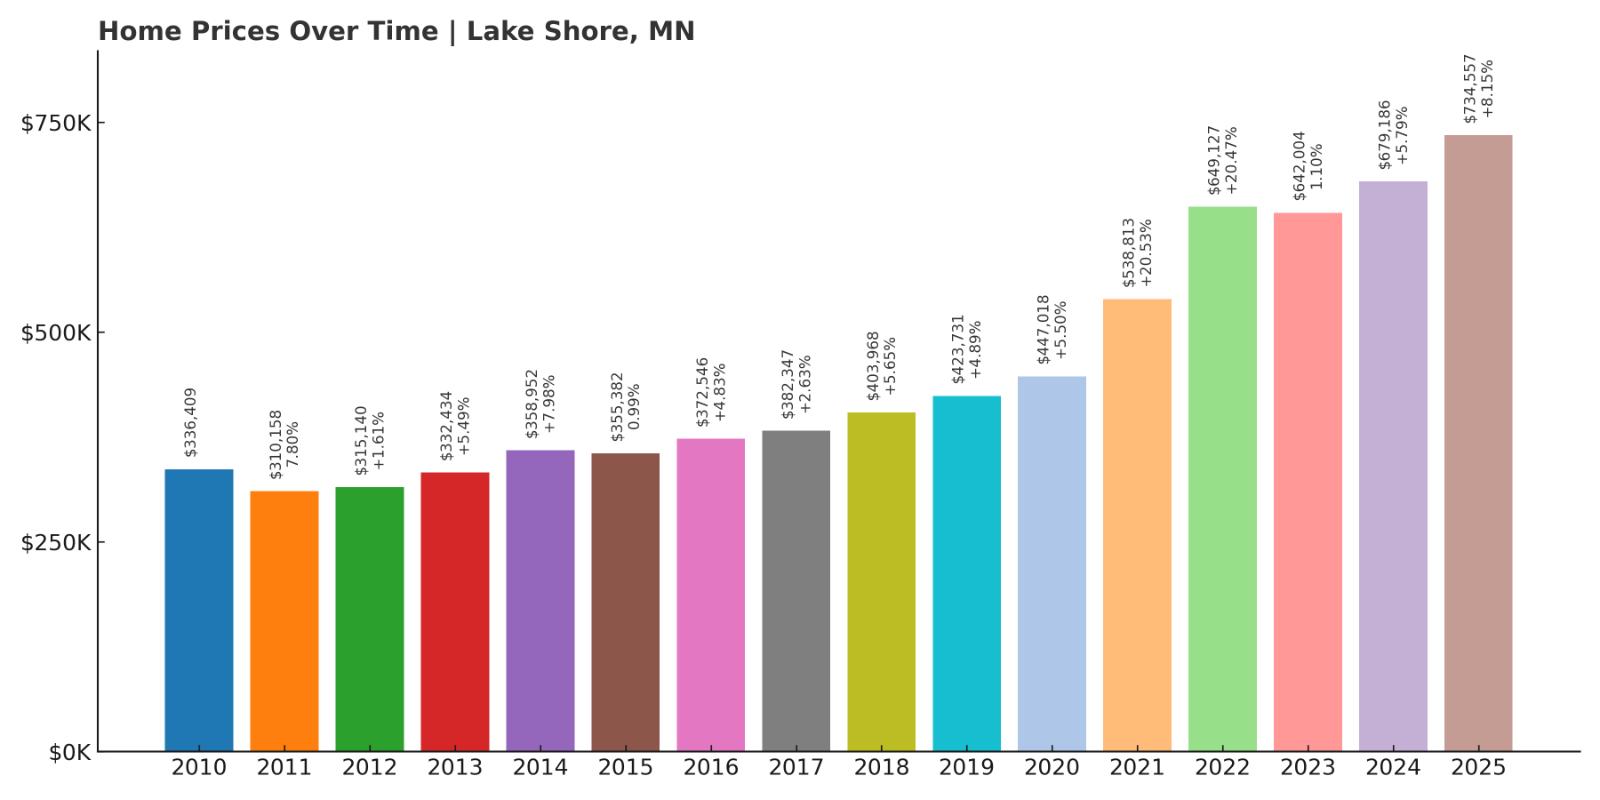
- 2010: $336,409
- 2011: $310,158 (−$26,251, −7.80% from previous year)
- 2012: $315,140 (+$4,982, +1.61% from previous year)
- 2013: $332,434 (+$17,294, +5.49% from previous year)
- 2014: $358,952 (+$26,518, +7.98% from previous year)
- 2015: $355,382 (−$3,570, −0.99% from previous year)
- 2016: $372,546 (+$17,164, +4.83% from previous year)
- 2017: $382,347 (+$9,801, +2.63% from previous year)
- 2018: $403,968 (+$21,621, +5.65% from previous year)
- 2019: $423,731 (+$19,763, +4.89% from previous year)
- 2020: $447,018 (+$23,287, +5.50% from previous year)
- 2021: $538,813 (+$91,795, +20.53% from previous year)
- 2022: $649,127 (+$110,314, +20.47% from previous year)
- 2023: $642,004 (−$7,123, −1.10% from previous year)
- 2024: $679,186 (+$37,182, +5.79% from previous year)
- 2025: $734,557 (+$55,371, +8.15% from previous year)
Lake Shore has experienced remarkable home value appreciation over the past 14 years, with prices increasing 133% since 2011. After a brief dip in 2015, the market rebounded and never looked back. Between 2020 and 2022, the town saw an explosive period of growth, with property values jumping over $200,000 in just two years. This intense upward trend was briefly interrupted in 2023, when prices dipped slightly, but the correction was mild and quickly reversed. In both 2024 and 2025, Lake Shore posted strong gains again, closing in on the $735,000 mark. This level of growth places it squarely in the ranks of Minnesota’s most elite housing markets. Even during periods of broader uncertainty, the long-term trend has remained overwhelmingly positive, underpinned by consistent buyer interest and the town’s premium lifestyle offering.
Lake Shore – Where Lakeside Living Commands a Premium
Located in Cass County near the popular Brainerd Lakes area, Lake Shore is a quiet, upscale lakeside community that has become a magnet for affluent buyers looking for scenic beauty and peaceful surroundings. The town’s real estate is dominated by waterfront homes, many of which offer private docks, panoramic views, and high-end finishes. Lake Shore’s setting on Gull Lake, one of Minnesota’s most desirable bodies of water, adds significant value to its housing stock. The town is close to several renowned resorts, golf courses, and trails, making it a haven for outdoor lovers who don’t want to sacrifice luxury. The homes here are often second properties for wealthier Minnesotans, but increasingly, buyers are choosing to relocate permanently thanks to flexible work-from-home options and a desire for a slower pace of life. This shift has contributed to the spike in values, especially since 2020.
What makes Lake Shore stand out in Minnesota’s real estate landscape is its combination of exclusivity and accessibility. While it’s tucked away enough to feel private, it’s still within a short drive to Brainerd for essentials, and regional airports provide straightforward access for seasonal homeowners. Strict land use policies and limited buildable lots also play a role in keeping inventory low and competition high. Demand for homes here continues to grow, especially among retirees and high-income professionals seeking weekend getaways or investment properties. In the years ahead, this dynamic is likely to intensify as more people look to invest in lifestyle-driven real estate. With values now well above $700,000 and momentum continuing in 2025, Lake Shore’s trajectory suggests continued gains for those already invested—and rising barriers for those still trying to break in.
15. Independence – 104% Home Price Increase Since 2012

- 2010: $435,710
- 2011: $387,468 (−$48,242, −11.07% from previous year)
- 2012: $375,825 (−$11,643, −3.00% from previous year)
- 2013: $405,071 (+$29,246, +7.78% from previous year)
- 2014: $437,327 (+$32,256, +7.96% from previous year)
- 2015: $445,605 (+$8,278, +1.89% from previous year)
- 2016: $459,201 (+$13,596, +3.05% from previous year)
- 2017: $476,513 (+$17,312, +3.77% from previous year)
- 2018: $516,084 (+$39,571, +8.30% from previous year)
- 2019: $529,280 (+$13,196, +2.56% from previous year)
- 2020: $543,413 (+$14,133, +2.67% from previous year)
- 2021: $620,544 (+$77,131, +14.19% from previous year)
- 2022: $720,741 (+$100,197, +16.15% from previous year)
- 2023: $730,297 (+$9,556, +1.33% from previous year)
- 2024: $745,342 (+$15,045, +2.06% from previous year)
- 2025: $765,793 (+$20,451, +2.74% from previous year)
Independence’s housing market has more than doubled in value since 2012, when home prices sat at $375,825. By 2025, prices had risen to $765,793—a 104% increase over thirteen years. The most dramatic spikes occurred between 2020 and 2022, when prices jumped by nearly $180,000 in just two years. Since then, price growth has continued, albeit at a more modest pace, suggesting a period of market consolidation rather than contraction. That consistency, especially in the face of broader market slowdowns, highlights Independence’s stability as a high-value residential market. While early 2010s pricing showed minor declines, the upward trajectory over the long run has remained intact. As of 2025, price appreciation continues, and homeowners who bought even five years ago have seen sizable gains. The town’s profile fits a growing trend among buyers looking to balance land, lifestyle, and long-term investment.
Independence – Open Land and Long-Term Growth Potential
Independence is located in western Hennepin County and is defined by its wide-open spaces, horse properties, and large custom homes. It’s the kind of place where long driveways, wooded lots, and quiet country roads come standard. While it may be just 25 miles west of Minneapolis, Independence feels far removed from city life—a major draw for buyers who want space without sacrificing metro access. The housing stock here is distinctly upscale but never cookie-cutter; many homes are built on multi-acre parcels, offering privacy that’s rare in suburban areas. Independence also benefits from its proximity to Lake Independence and several regional parks, reinforcing its identity as a rural escape for high-end buyers. The town has long appealed to those seeking hobby farms, equestrian facilities, or simply large estates, and that buyer profile has only expanded in recent years.
The pandemic era saw an influx of demand from urban dwellers seeking more room, and Independence fit the bill perfectly. The town’s relatively low housing density, scenic surroundings, and strong local reputation helped fuel the sharp price increases in 2021 and 2022. Unlike some markets that overheated and then cooled quickly, Independence’s price growth appears to be holding steady. That’s largely due to its unique position in the market—it offers land and luxury in a way few other Twin Cities suburbs can match. As developers tread cautiously around growth restrictions and infrastructure limits, the available housing supply remains tight. This scarcity, paired with high buyer demand for the town’s rural-suburban balance, means that Independence will likely continue to command high prices. For buyers, that means entering the market may get harder. For current homeowners, the long-term outlook looks strong.
14. Shorewood – 93% Home Price Increase Since 2012
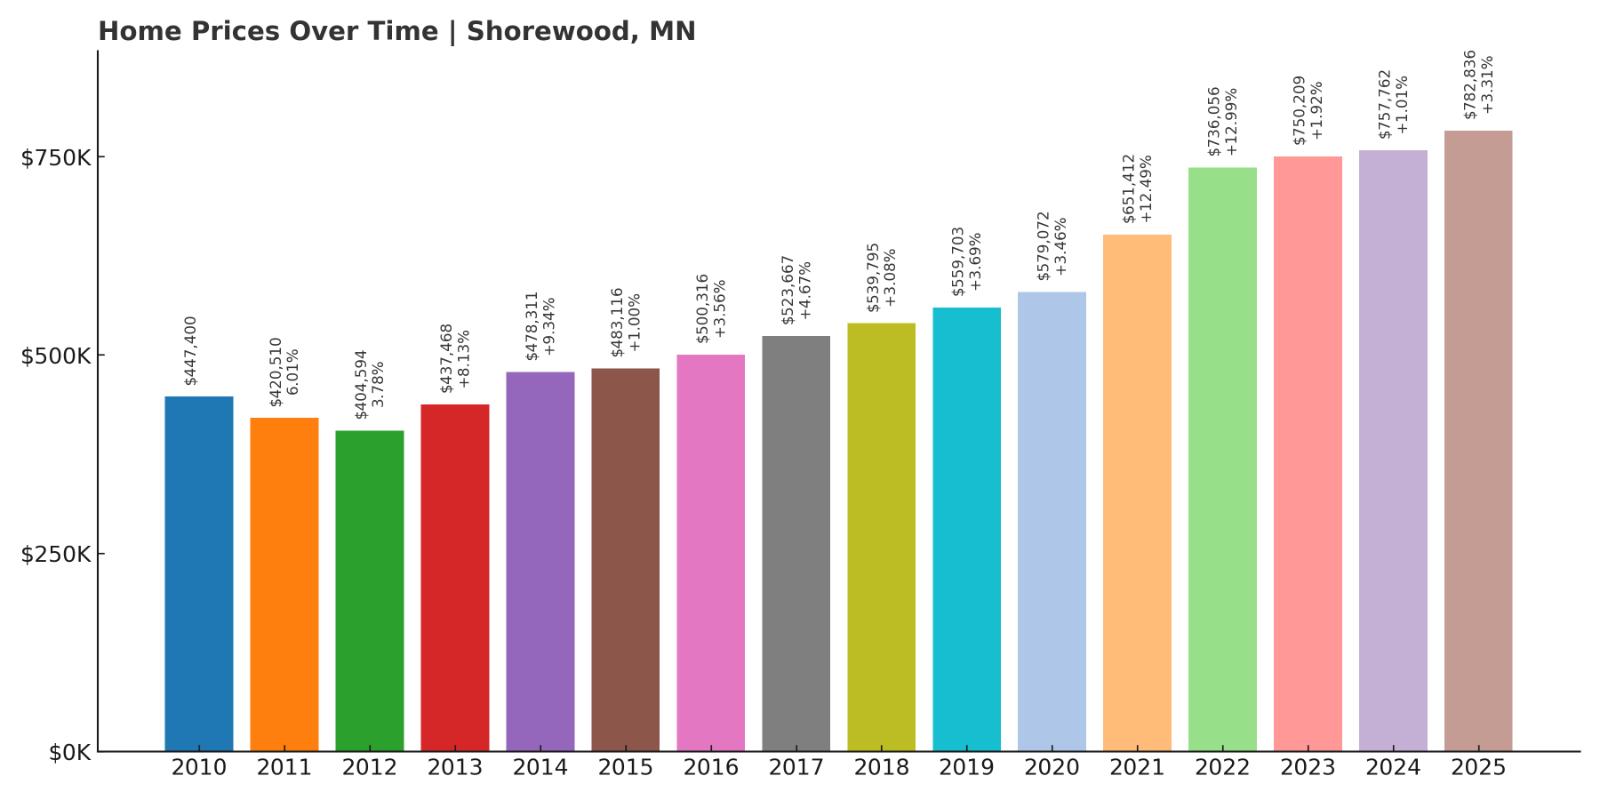
- 2010: $447,400
- 2011: $420,510 (−$26,890, −6.01% from previous year)
- 2012: $404,594 (−$15,916, −3.78% from previous year)
- 2013: $437,468 (+$32,874, +8.13% from previous year)
- 2014: $478,311 (+$40,843, +9.34% from previous year)
- 2015: $483,116 (+$4,805, +1.00% from previous year)
- 2016: $500,316 (+$17,200, +3.56% from previous year)
- 2017: $523,667 (+$23,351, +4.67% from previous year)
- 2018: $539,795 (+$16,128, +3.08% from previous year)
- 2019: $559,703 (+$19,908, +3.69% from previous year)
- 2020: $579,072 (+$19,369, +3.46% from previous year)
- 2021: $651,412 (+$72,340, +12.49% from previous year)
- 2022: $736,056 (+$84,644, +12.99% from previous year)
- 2023: $750,209 (+$14,153, +1.92% from previous year)
- 2024: $757,762 (+$7,553, +1.01% from previous year)
- 2025: $782,836 (+$25,074, +3.31% from previous year)
Shorewood has climbed steadily in value since 2012, when home prices averaged just over $400,000. By 2025, homes were approaching the $800,000 mark—a 93% increase that showcases consistent strength over more than a decade. Most of that growth came after 2016, with accelerated appreciation between 2020 and 2022. While gains tapered slightly in the last two years, the overall trajectory has remained positive. Even in a shifting market, Shorewood has not seen any year-over-year price drops since 2012. This sort of stability is rare, especially in luxury-adjacent housing markets. That consistency points to sustained buyer demand, strong resale potential, and a housing market that’s matured without overheating. For many buyers, Shorewood has become synonymous with both security and sophistication.
Shorewood – Refined Suburban Living Near the Lake
Shorewood sits on the southern edge of Lake Minnetonka and is part of one of Minnesota’s most prestigious suburban corridors. The town combines wooded neighborhoods, lake access, and proximity to top-performing school districts, making it a magnet for high-income households. Residents enjoy a strong sense of community, beautifully maintained parks, and convenient access to downtown Excelsior, a popular destination for dining and boutiques. Shorewood’s real estate landscape is shaped by a blend of historic properties and newer luxury homes, many of which come with lake views or deeded access. Zoning in the area tends to favor low-density development, which helps maintain the town’s quiet character and high property values. The town has positioned itself as a stable, high-quality choice for families looking for premium housing with minimal compromise.
Shorewood also benefits from its connectivity—just a 30-minute drive from Minneapolis, yet worlds away in terms of atmosphere. Its location within the Minnetonka School District adds to the draw for families, while the proximity to Lake Minnetonka offers recreation and prestige year-round. The town hasn’t needed to rely on dramatic development to stay relevant; instead, it has grown through consistent demand and tight inventory. Homes tend to move quickly and command high prices, especially those with any water access or updated features. As housing costs across the metro continue to climb, Shorewood has remained a steady leader among affluent buyers who want space, quality, and reliable long-term value. Its near 100% appreciation since 2012 is more than just a number—it’s a reflection of a town that continues to meet the expectations of its selective buyer base.
13. Medina – 82% Home Price Increase Since 2012
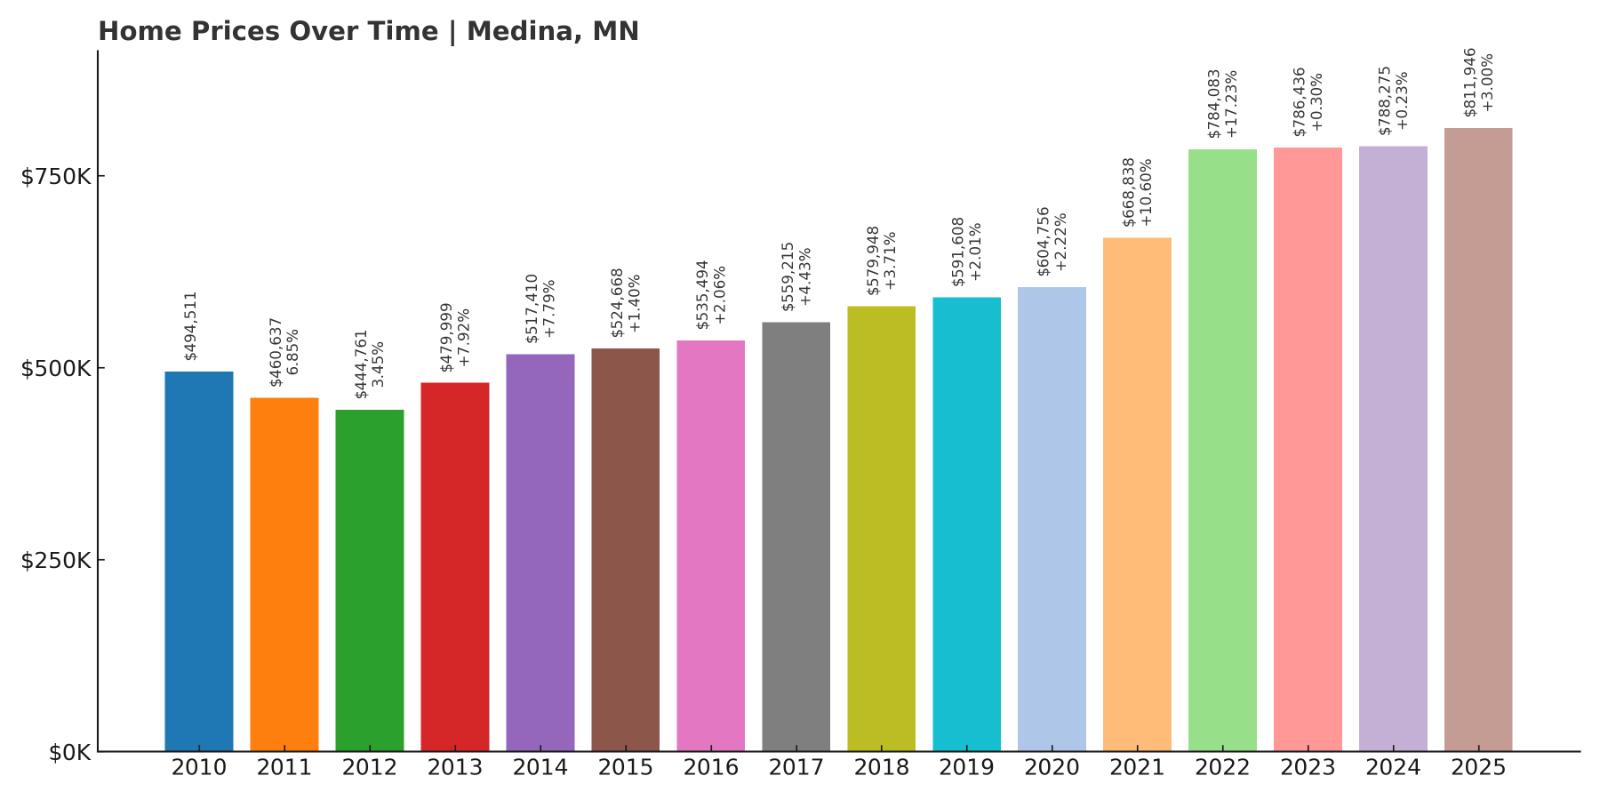
- 2010: $494,511
- 2011: $460,637 (−$33,874, −6.85% from previous year)
- 2012: $444,761 (−$15,876, −3.45% from previous year)
- 2013: $479,999 (+$35,238, +7.92% from previous year)
- 2014: $517,410 (+$37,411, +7.79% from previous year)
- 2015: $524,668 (+$7,258, +1.40% from previous year)
- 2016: $535,494 (+$10,826, +2.06% from previous year)
- 2017: $559,215 (+$23,721, +4.43% from previous year)
- 2018: $579,948 (+$20,733, +3.71% from previous year)
- 2019: $591,608 (+$11,660, +2.01% from previous year)
- 2020: $604,756 (+$13,148, +2.22% from previous year)
- 2021: $668,838 (+$64,082, +10.60% from previous year)
- 2022: $784,083 (+$115,245, +17.23% from previous year)
- 2023: $786,436 (+$2,353, +0.30% from previous year)
- 2024: $788,275 (+$1,839, +0.23% from previous year)
- 2025: $811,946 (+$23,671, +3.00% from previous year)
Medina’s housing market has climbed steadily since 2012, when average home prices hovered around $444,761. By 2025, the typical home was worth $811,946—an 82% increase that reflects both steady demand and the town’s strong position within the western suburbs. Most of the acceleration happened between 2020 and 2022, when the market leapt nearly $180,000 in value. While the pace has cooled since then, the fact that Medina continues to post gains even in a tighter market speaks volumes. Unlike towns that saw significant pullbacks after pandemic-era surges, Medina’s values have held firm. The town’s consistently rising floor price, year after year, has given both residents and investors confidence. Buyers who entered the market a decade ago have more than doubled their home equity, while recent buyers continue to compete in a tight and highly sought-after market.
Medina – Upscale Suburban Living With Rural Roots
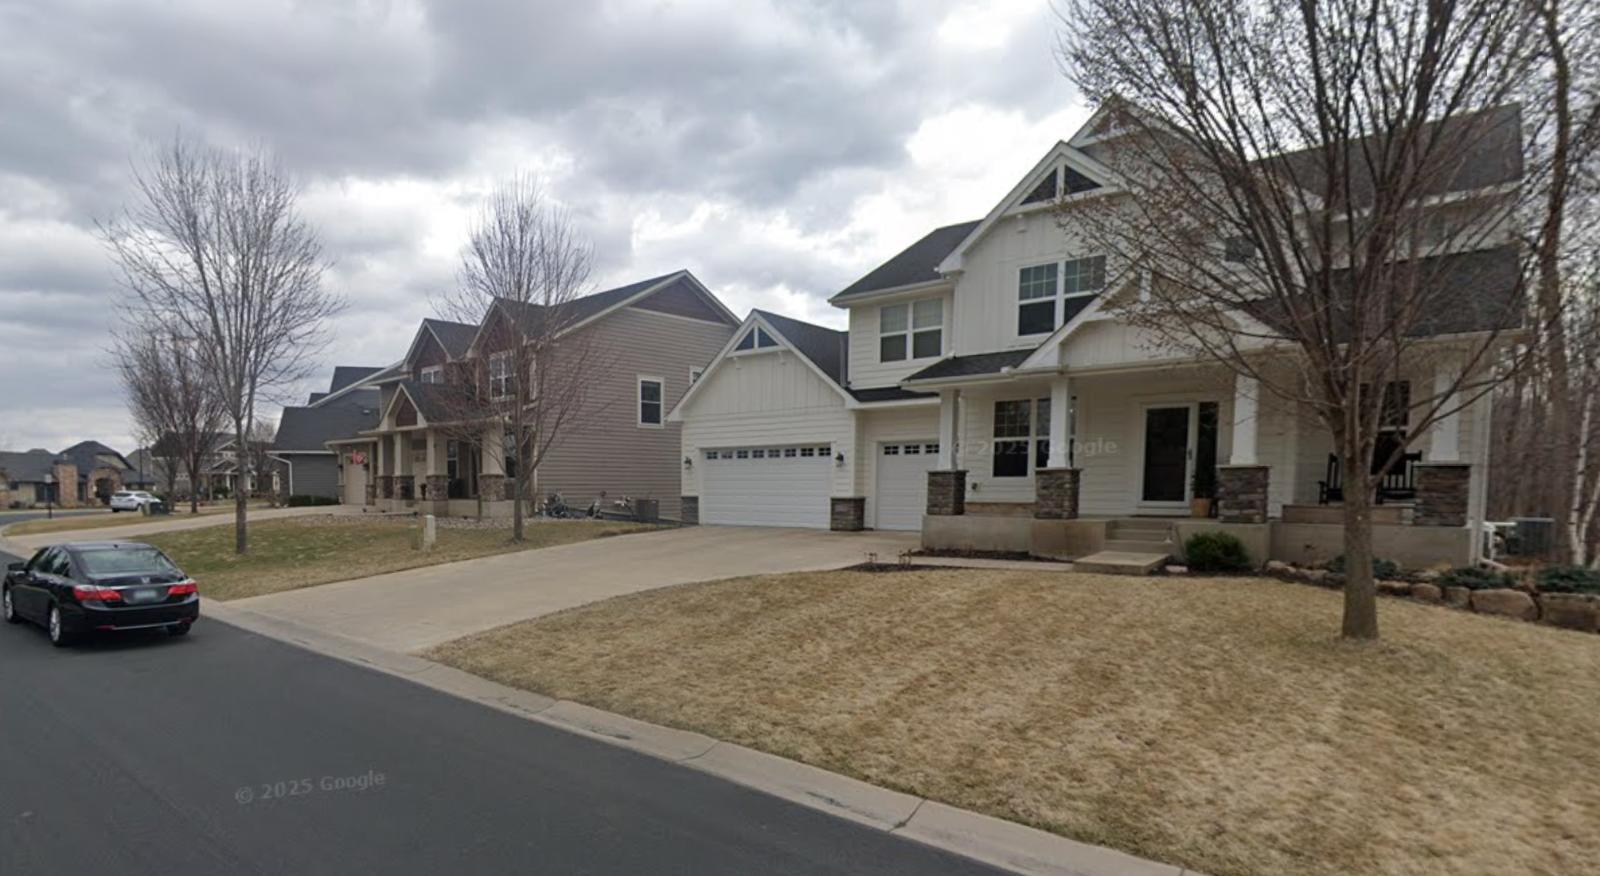
Medina is one of the most affluent communities in Hennepin County, known for its wide-open landscapes, executive estates, and balance of pastoral charm with modern luxury. Though located just 20 miles west of downtown Minneapolis, Medina feels distinctly rural thanks to its rolling farmland, horse properties, and low-density neighborhoods. Yet it’s also home to luxury developments like The Enclave and Medina Highlands, offering newer construction with upscale amenities. The area attracts high-income professionals looking for privacy and space without sacrificing proximity to city jobs or top-tier schools. Orono and Wayzata school districts serve much of the area, further boosting property demand and prices. Medina also houses the headquarters of Polaris Industries, adding economic stability and some corporate real estate interest. These combined elements have helped maintain steady interest and sustained home price growth, even as other markets began to wobble post-2022.
Unlike trend-driven markets, Medina’s appeal lies in its fundamentals: large lots, exceptional school zones, strong municipal services, and a peaceful setting that remains close to the metro. Its land use policies have generally favored single-family zoning, which helps preserve the area’s spacious and quiet character while keeping supply limited. Buyers are often looking for homes in the $700K to $1M+ range, and many are willing to wait for the right listing rather than compromise. Even during economic lulls, inventory remains tight, and sellers typically hold firm on price. That behavior reflects the high confidence among owners and reinforces the price floor. In 2025, Medina continues to outperform expectations—proving that high-end real estate doesn’t need to be flashy to be strong. For those who can afford it, Medina offers one of the most stable long-term investments in the greater Twin Cities region.
12. Excelsior – 87% Home Price Increase Since 2012
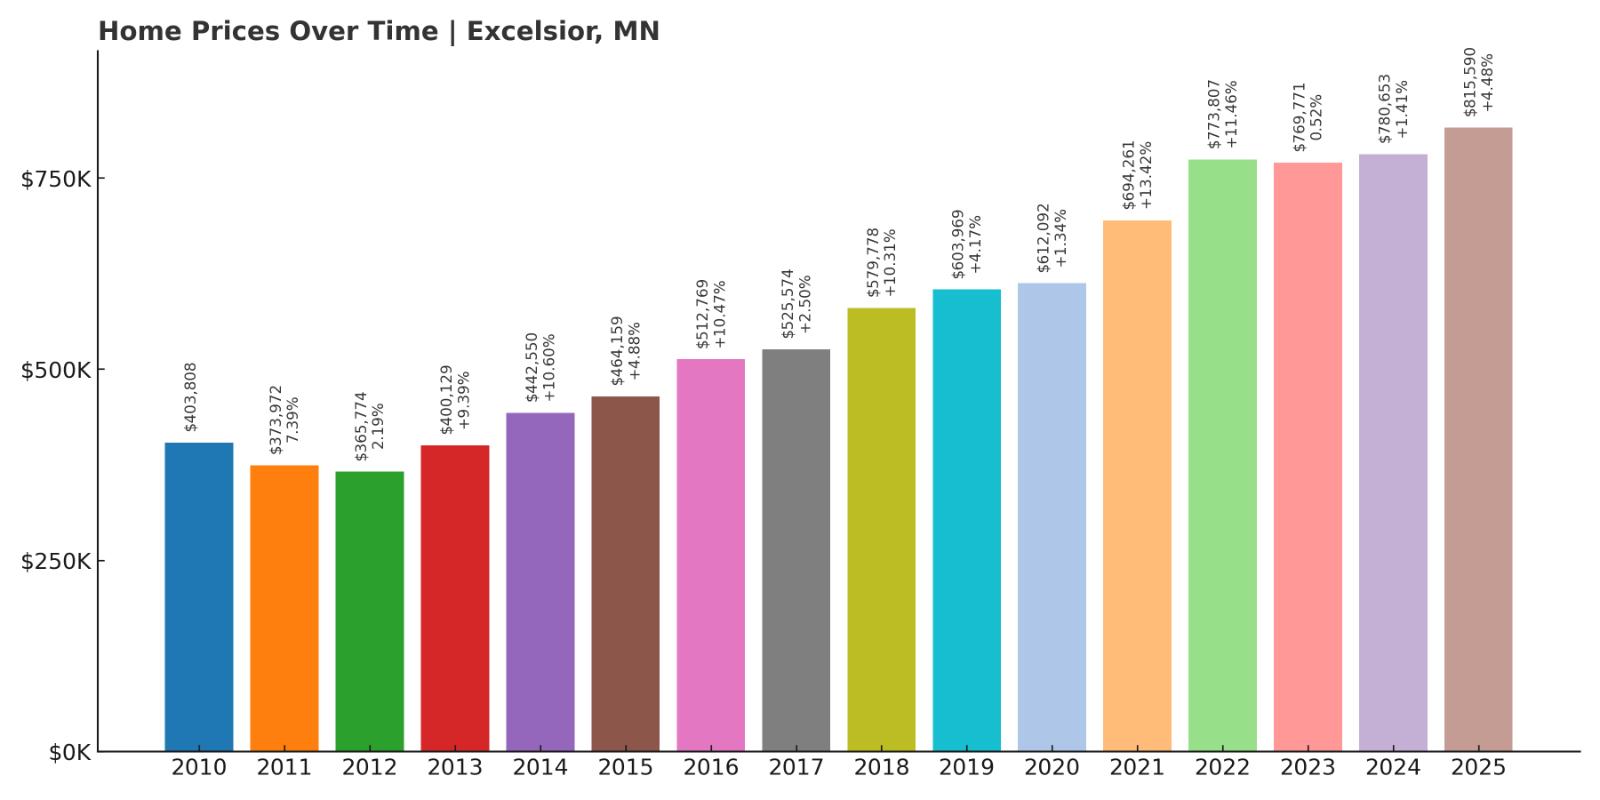
- 2010: $403,808
- 2011: $373,972 (−$29,836, −7.39% from previous year)
- 2012: $365,774 (−$8,198, −2.19% from previous year)
- 2013: $400,129 (+$34,355, +9.39% from previous year)
- 2014: $442,550 (+$42,421, +10.60% from previous year)
- 2015: $464,159 (+$21,609, +4.88% from previous year)
- 2016: $512,769 (+$48,610, +10.47% from previous year)
- 2017: $525,574 (+$12,805, +2.50% from previous year)
- 2018: $579,778 (+$54,204, +10.31% from previous year)
- 2019: $603,969 (+$24,191, +4.17% from previous year)
- 2020: $612,092 (+$8,123, +1.34% from previous year)
- 2021: $694,261 (+$82,169, +13.42% from previous year)
- 2022: $773,807 (+$79,546, +11.46% from previous year)
- 2023: $769,771 (−$4,036, −0.52% from previous year)
- 2024: $780,653 (+$10,882, +1.41% from previous year)
- 2025: $815,590 (+$34,937, +4.48% from previous year)
Excelsior’s housing market has climbed 87% since 2012, rising from $365,774 to $815,590 as of 2025. Much of that growth occurred in bursts, particularly between 2016 and 2018 and again from 2020 to 2022. Even as prices briefly dipped in 2023, they quickly bounced back, with the 2025 figure representing a new all-time high. What makes Excelsior’s pricing especially notable is how resilient it has been despite being one of the smaller towns on this list. The combination of tight inventory, historical charm, and premium location has made Excelsior a consistent outperformer in the upper-tier housing market. Buyers are not only willing to pay a premium—they’re often entering bidding wars for the chance to own property in this coveted lakeside town.
Excelsior – Historic Charm on the Shores of Lake Minnetonka
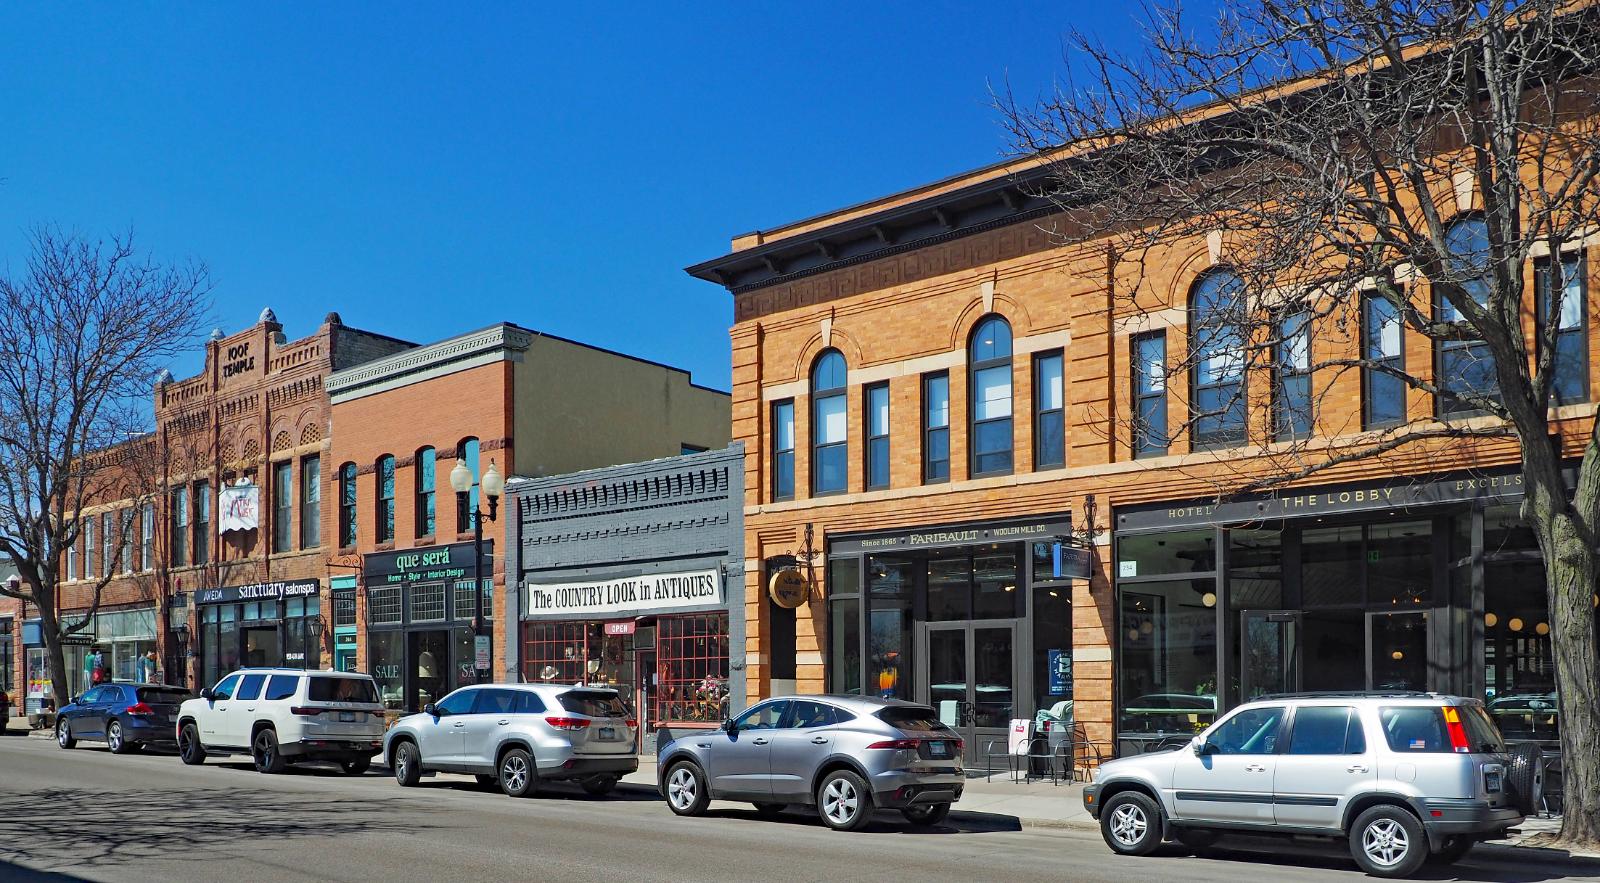
Excelsior is one of the most iconic towns along Lake Minnetonka, steeped in history and brimming with character. Its walkable downtown is filled with local boutiques, cafés, and historic storefronts that give the town a distinctly timeless appeal. Originally a popular summer destination in the 19th and early 20th centuries, Excelsior has evolved into a year-round upscale community, while still preserving its lakeside resort-town roots. The town offers marina access, public beaches, and a popular regional trail that runs straight through its center—making it one of the few places in Minnesota where small-town charm meets high walkability. It’s this blend of authenticity and accessibility that draws both long-time Minnesotans and out-of-state buyers alike.
Real estate in Excelsior is highly limited, with a small footprint and few new developments. This has created a competitive market, where even modest-sized homes can command premium prices. The area’s rich architectural variety—ranging from century-old cottages to modern renovations—adds to its allure, as does its inclusion in the top-ranked Minnetonka School District. Homes here tend to sell quickly, especially anything with proximity to the lake or within walking distance of Water Street, the town’s lively commercial hub. As lifestyle-driven real estate continues to thrive, Excelsior stands out as a unique market that offers both investment potential and daily livability. In 2025, with home prices well above $800,000 and climbing, the town is proving that small places can still deliver big when it comes to real estate growth.
11. Wayzata – 99% Home Price Increase Since 2012
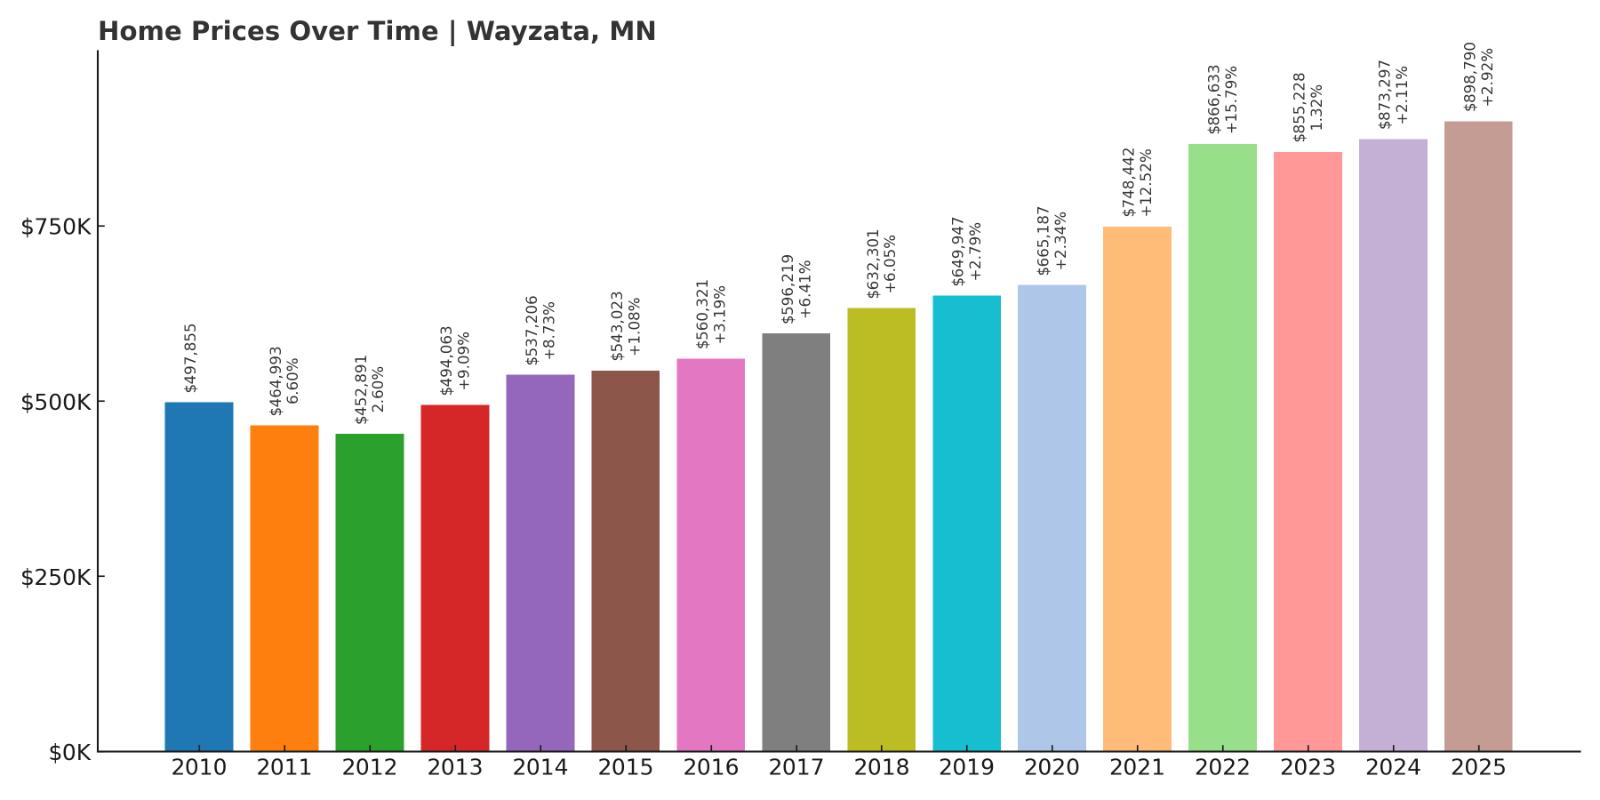
- 2010: $497,855
- 2011: $464,993 (−$32,862, −6.60% from previous year)
- 2012: $452,891 (−$12,102, −2.60% from previous year)
- 2013: $494,063 (+$41,172, +9.09% from previous year)
- 2014: $537,206 (+$43,143, +8.73% from previous year)
- 2015: $543,023 (+$5,817, +1.08% from previous year)
- 2016: $560,321 (+$17,298, +3.19% from previous year)
- 2017: $596,219 (+$35,898, +6.41% from previous year)
- 2018: $632,301 (+$36,082, +6.05% from previous year)
- 2019: $649,947 (+$17,646, +2.79% from previous year)
- 2020: $665,187 (+$15,240, +2.34% from previous year)
- 2021: $748,442 (+$83,255, +12.52% from previous year)
- 2022: $866,633 (+$118,191, +15.79% from previous year)
- 2023: $855,228 (−$11,405, −1.32% from previous year)
- 2024: $873,297 (+$18,069, +2.11% from previous year)
- 2025: $898,790 (+$25,493, +2.92% from previous year)
Wayzata’s real estate market has seen a near doubling in home prices since 2012, when the average home value was $452,891. As of 2025, the typical home is priced at $898,790—marking a 99% increase. The town’s market performed exceptionally well during the housing surge of 2021 and 2022, when prices spiked by over $200,000 in just two years. While there was a slight retreat in 2023, the following years rebounded strongly, continuing Wayzata’s long-standing trend of steady appreciation. This market isn’t known for wild swings—it’s driven by consistent demand, limited supply, and strong fundamentals. As one of the most recognizable luxury towns in the Twin Cities metro, Wayzata continues to deliver high returns to longtime homeowners, and it’s increasingly difficult for new buyers to find entry points.
Wayzata – Premier Luxury on Lake Minnetonka’s North Shore
Wayzata has long held a reputation as one of Minnesota’s most prestigious addresses. Located on the northern shore of Lake Minnetonka, this town is a hub of lakeside affluence, known for its designer boutiques, high-end dining, and luxury condominiums that overlook the water. Despite its small geographic footprint, Wayzata offers a dense mix of amenities and cultural cachet that make it incredibly appealing to both local elites and out-of-state relocators. The downtown area, recently revitalized with streetscaping and new development, is anchored by the lakefront promenade—a destination that draws residents and tourists alike. Properties here, whether historic homes or modern penthouses, come with significant price tags, and the demand rarely falters. The town’s walkability and access to the lake are its strongest assets, attracting a demographic that values both lifestyle and location.
Adding to Wayzata’s appeal is its inclusion in the nationally recognized Wayzata School District, one of the best-performing in the state. This makes the town attractive to wealthy families who want quality education without sacrificing convenience or aesthetics. With excellent freeway access to downtown Minneapolis, professionals can commute easily while enjoying the serenity of lake life. Home inventory is tightly held, with many properties remaining in families for generations. As a result, turnover is low, and competition remains high for any new listings. Over the years, Wayzata has evolved from a lakeside resort town to a full-fledged luxury enclave. Its nearly 100% increase in home prices since 2012 reflects more than inflation—it reflects the premium that buyers are willing to pay for one of Minnesota’s most iconic real estate markets.
10. Dellwood – 87% Home Price Increase Since 2012
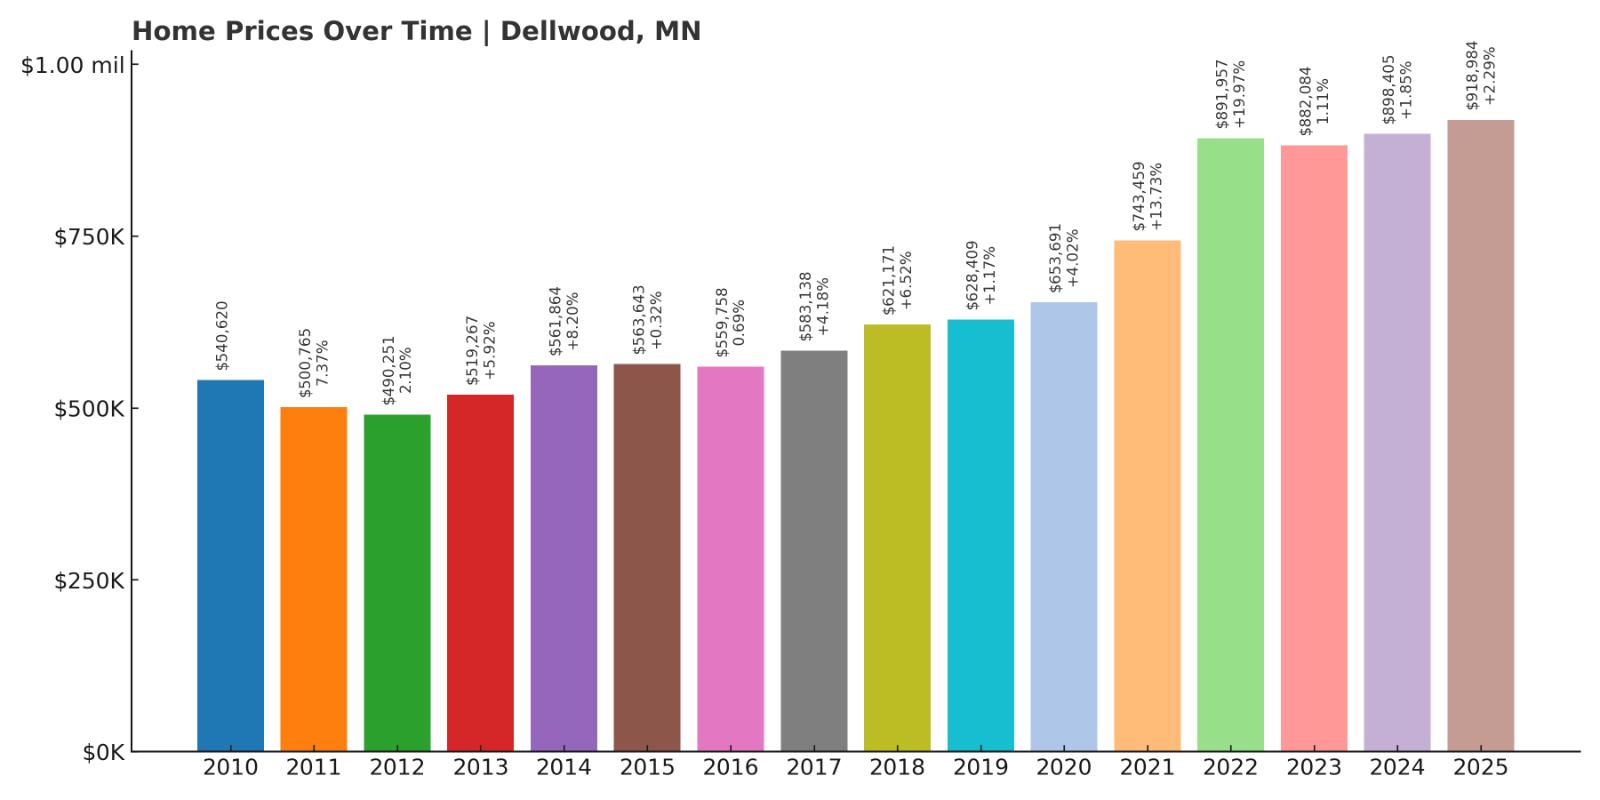
- 2010: $540,620
- 2011: $500,765 (−$39,855, −7.37% from previous year)
- 2012: $490,251 (−$10,514, −2.10% from previous year)
- 2013: $519,267 (+$29,016, +5.92% from previous year)
- 2014: $561,864 (+$42,597, +8.20% from previous year)
- 2015: $563,643 (+$1,779, +0.32% from previous year)
- 2016: $559,758 (−$3,885, −0.69% from previous year)
- 2017: $583,138 (+$23,380, +4.18% from previous year)
- 2018: $621,171 (+$38,033, +6.52% from previous year)
- 2019: $628,409 (+$7,238, +1.17% from previous year)
- 2020: $653,691 (+$25,282, +4.02% from previous year)
- 2021: $743,459 (+$89,768, +13.73% from previous year)
- 2022: $891,957 (+$148,498, +19.97% from previous year)
- 2023: $882,084 (−$9,873, −1.11% from previous year)
- 2024: $898,405 (+$16,321, +1.85% from previous year)
- 2025: $918,984 (+$20,579, +2.29% from previous year)
Dellwood’s home prices have risen nearly 90% since 2012, growing from $490,251 to $918,984 by 2025. Most of the significant appreciation occurred between 2020 and 2022, when values jumped by nearly $240,000 in just two years. The momentum slowed slightly after that, but prices remain on an upward track and hit another high in 2025. What’s especially telling is the strength of the market even after a brief dip in 2023—a sign of a high-confidence, high-demand locality. Dellwood’s mix of exclusivity, natural beauty, and limited housing supply has helped sustain both its price floor and its long-term growth curve. Compared to more volatile markets, Dellwood has proven to be a reliable stronghold for upper-tier homebuyers who value stability as much as they value scenery.
Dellwood – Quiet Wealth in the Forests of Washington County
Tucked just north of White Bear Lake, Dellwood is one of Minnesota’s wealthiest towns—and one of its most discreet. It’s not flashy, but that’s exactly the point. This is a place where homes are often hidden behind trees and gates, where residents prize privacy over status displays. The town features large custom homes, often on multi-acre wooded lots, and backs up to golf courses, lakes, and protected lands. Dellwood has long been home to executives, entrepreneurs, and even a few local celebrities seeking a place that offers prestige without pretense. The housing stock is predominantly high-end, with a heavy emphasis on traditional architecture and timeless finishes. New construction is rare, which keeps the inventory low and prices strong.
Dellwood’s appeal is rooted in its serene, upscale atmosphere and the sense of permanence it offers. Unlike other luxury towns that have seen booms and busts, Dellwood’s housing market has grown steadily over the years, powered by a consistent buyer base that values land, location, and seclusion. Its zoning laws are strict, which has helped prevent overdevelopment and maintained the town’s quiet character. Residents enjoy access to nearby nature trails, lakeside amenities, and the esteemed Dellwood Country Club—all just 30 minutes from downtown St. Paul. In 2025, the town continues to attract affluent buyers despite broader economic uncertainty. With home values nearing $1 million and still climbing, Dellwood remains one of Minnesota’s most desirable destinations for those seeking understated luxury in a natural setting.
9. North Oaks – 77% Home Price Increase Since 2012
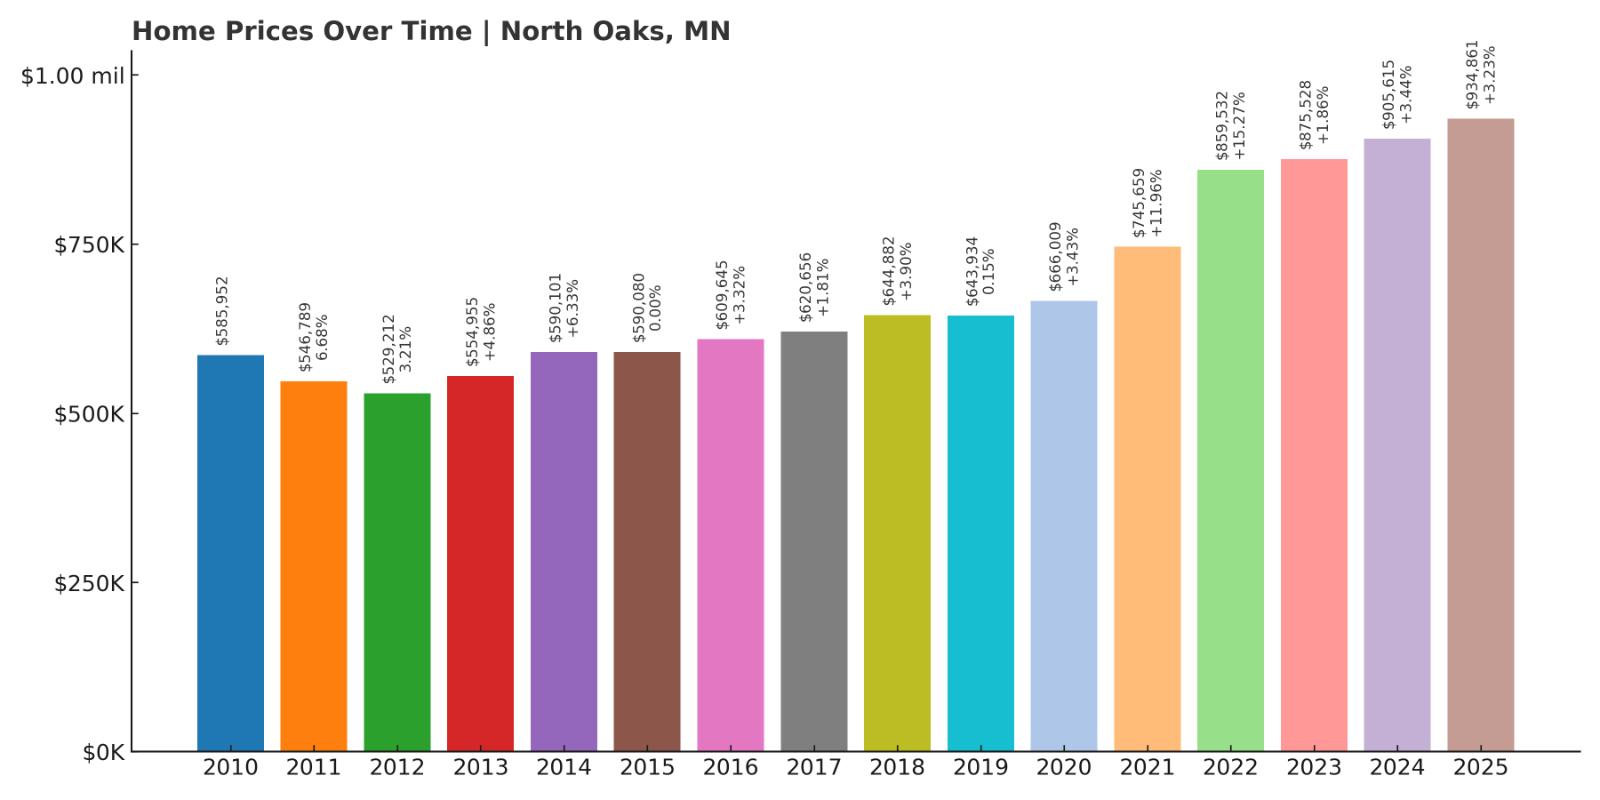
- 2010: $585,952
- 2011: $546,789 (−$39,163, −6.68% from previous year)
- 2012: $529,212 (−$17,577, −3.21% from previous year)
- 2013: $554,955 (+$25,743, +4.86% from previous year)
- 2014: $590,101 (+$35,146, +6.33% from previous year)
- 2015: $590,080 (−$21, −0.00% from previous year)
- 2016: $609,645 (+$19,565, +3.32% from previous year)
- 2017: $620,656 (+$11,011, +1.81% from previous year)
- 2018: $644,882 (+$24,226, +3.90% from previous year)
- 2019: $643,934 (−$948, −0.15% from previous year)
- 2020: $666,009 (+$22,075, +3.43% from previous year)
- 2021: $745,659 (+$79,650, +11.96% from previous year)
- 2022: $859,532 (+$113,873, +15.27% from previous year)
- 2023: $875,528 (+$15,996, +1.86% from previous year)
- 2024: $905,615 (+$30,087, +3.44% from previous year)
- 2025: $934,861 (+$29,246, +3.23% from previous year)
North Oaks has enjoyed a solid 77% increase in home prices since 2012, rising from $529,212 to $934,861 by 2025. The town’s value growth was particularly strong in the early 2020s, with back-to-back double-digit increases in 2021 and 2022. That explosive growth gave way to a more modest climb in recent years, yet the market remains highly stable. Even during broader market uncertainty, North Oaks has avoided the sharp price drops seen in less insulated areas. The town’s housing values continue to move upward, thanks in large part to low turnover, large-lot zoning, and high buyer demand. In a region full of desirable communities, North Oaks still stands out as one of the most consistently high-performing.
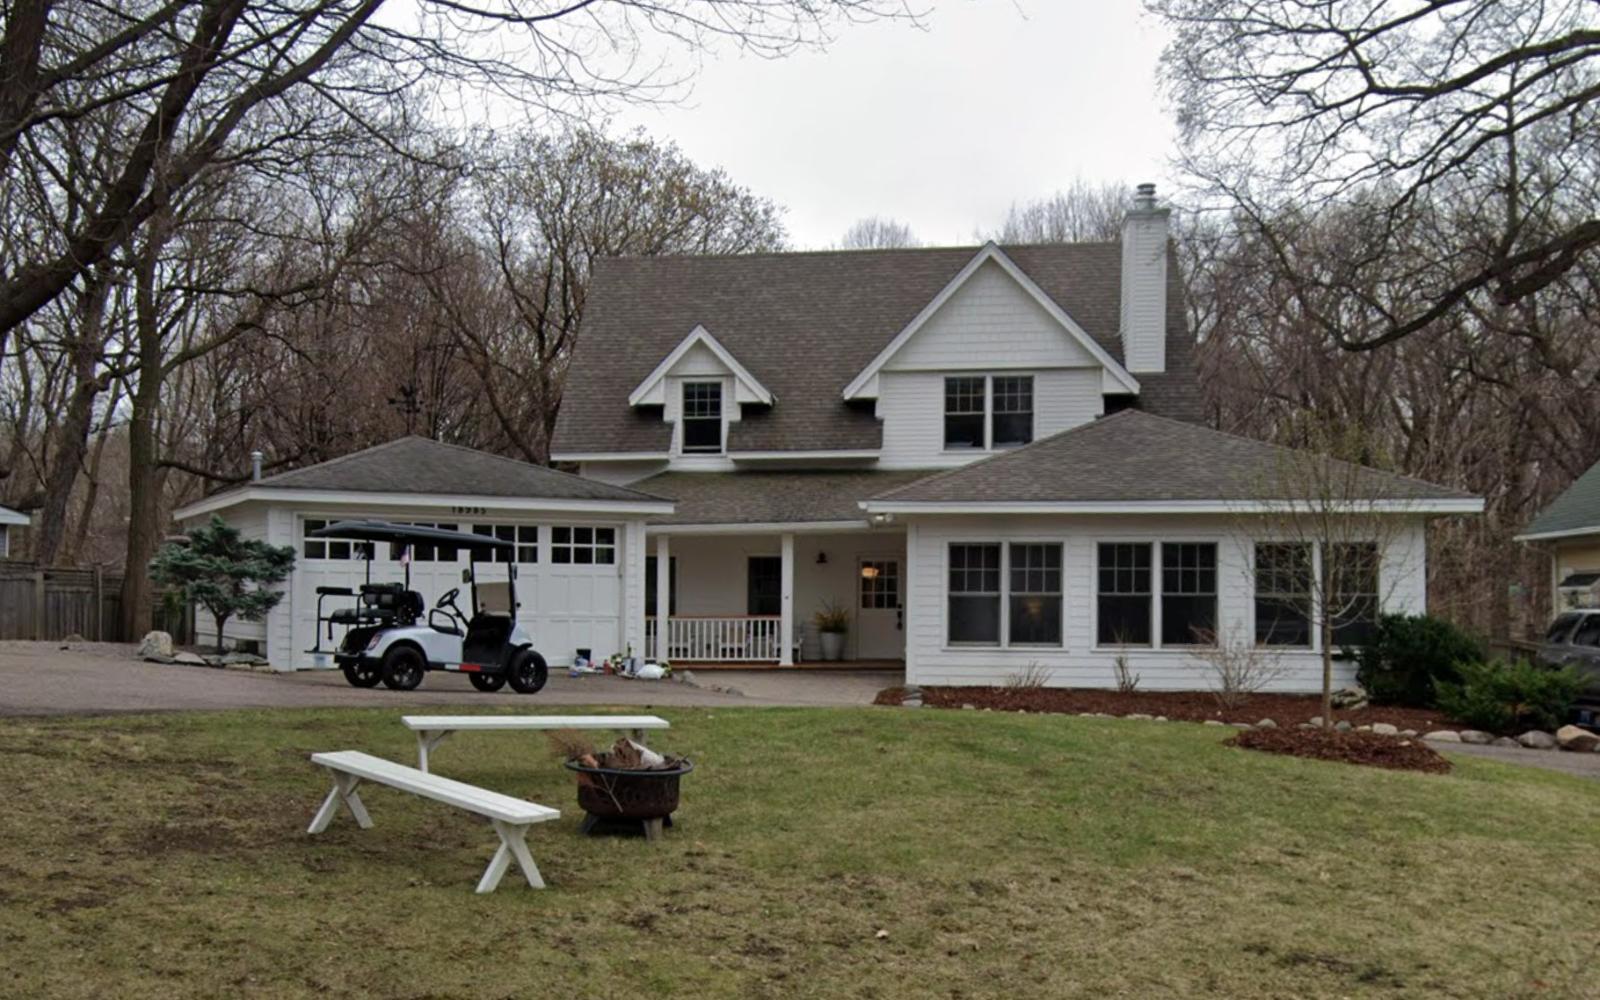
North Oaks – A Gated Community With Natural Appeal
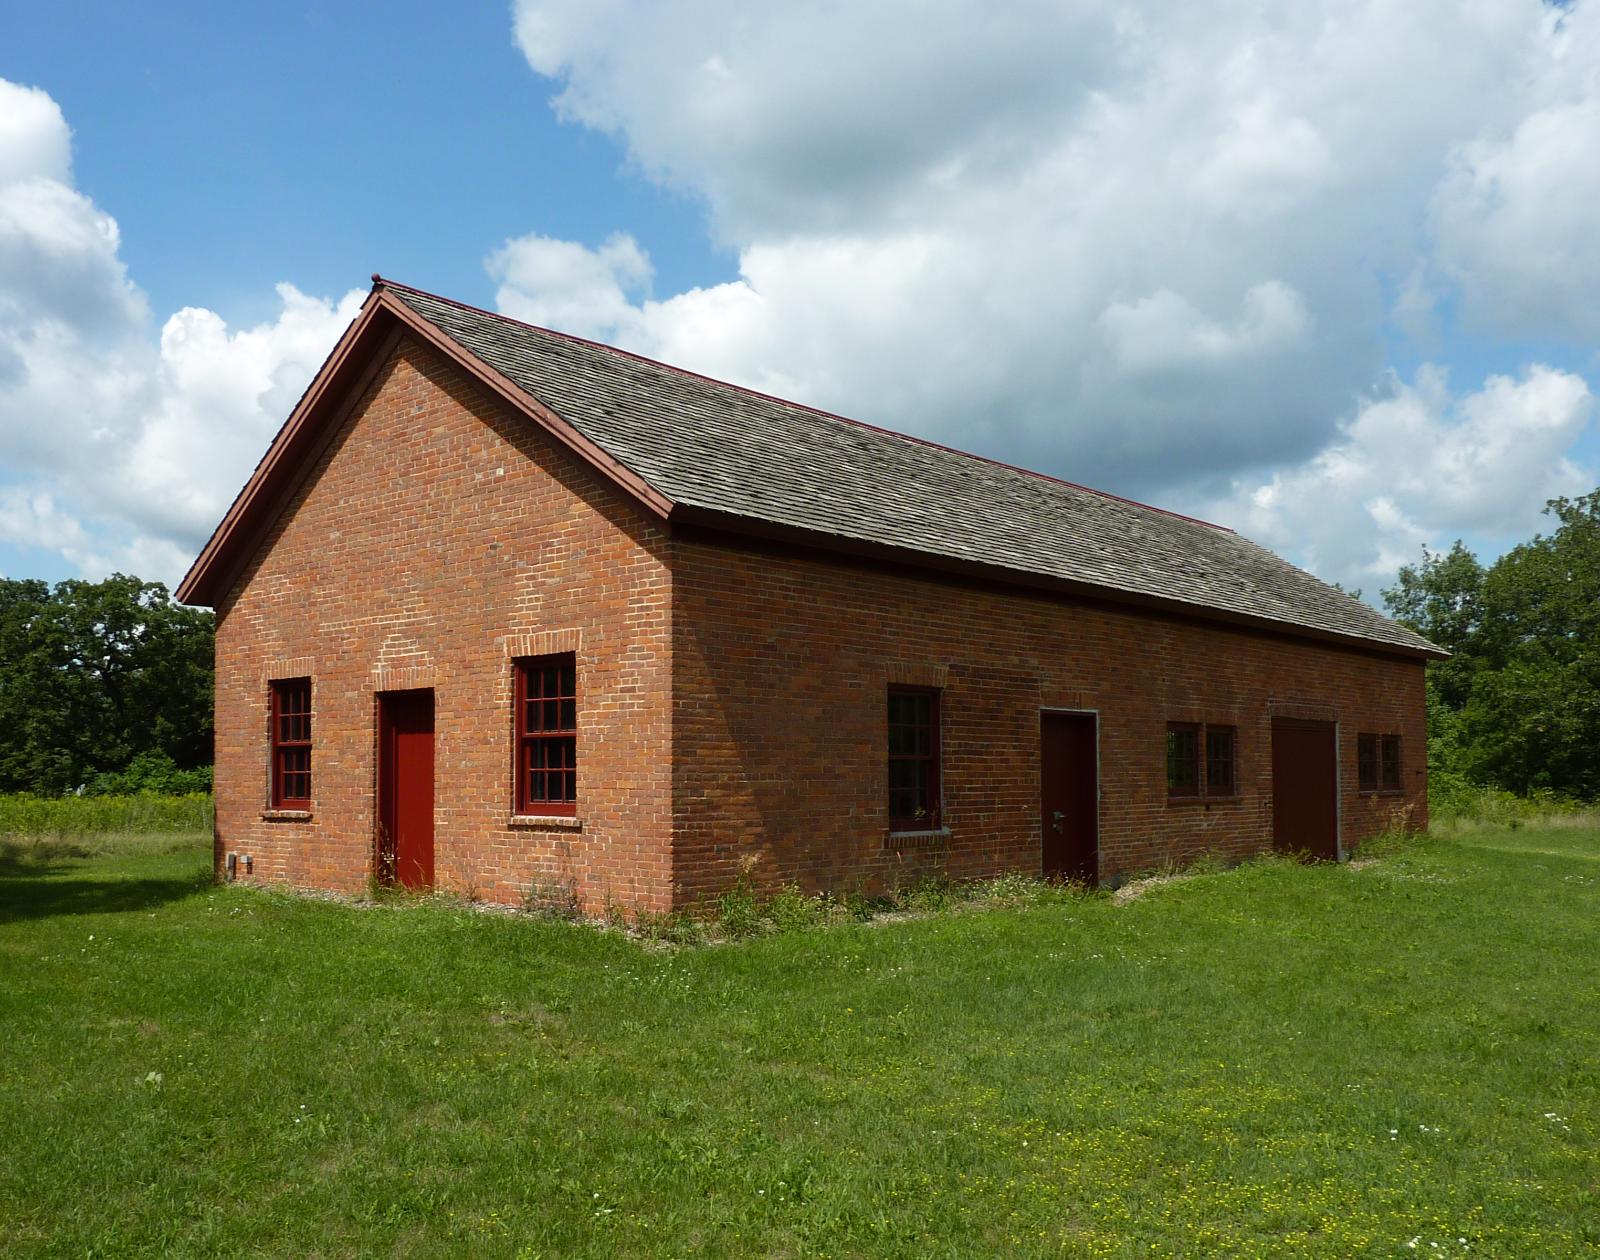
North Oaks is one of the most distinctive towns in Minnesota, and perhaps in the entire Midwest. Originally developed as a private estate by railroad magnate James J. Hill, North Oaks remains entirely private to this day. The town is made up of winding roads, dense woodlands, and custom-built luxury homes that are tucked away from public view. Residents collectively own the roads, parks, and trails, and no public traffic is allowed. This high degree of privacy and exclusivity has long been part of the town’s draw, making it a magnet for executives, professionals, and families seeking a truly secluded suburban lifestyle. Properties often include multi-acre lots, private lakeshore access, and direct trail connections to protected conservation lands.
Beyond its privacy, North Oaks is known for excellent schools (primarily through the Mounds View and White Bear Lake districts), top-tier community associations, and proximity to downtown Saint Paul. The town sits just north of the metro but feels like a hidden enclave far from urban congestion. Restrictions on commercial development and tight architectural standards help preserve its character—and its home values. That stability is reflected in the data: even during turbulent periods in the real estate market, North Oaks has remained one of the safest bets for long-term investment. With prices approaching the $950,000 mark in 2025 and steady demand from a high-income buyer pool, the town continues to thrive as one of Minnesota’s most desirable private communities.
8. Deephaven – 95% Home Price Increase Since 2012

- 2010: $522,948
- 2011: $479,957 (−$42,991, −8.22% from previous year)
- 2012: $473,024 (−$6,933, −1.44% from previous year)
- 2013: $515,964 (+$42,940, +9.08% from previous year)
- 2014: $570,147 (+$54,183, +10.50% from previous year)
- 2015: $588,996 (+$18,849, +3.31% from previous year)
- 2016: $614,666 (+$25,670, +4.36% from previous year)
- 2017: $642,812 (+$28,146, +4.58% from previous year)
- 2018: $665,321 (+$22,509, +3.50% from previous year)
- 2019: $686,515 (+$21,194, +3.19% from previous year)
- 2020: $687,961 (+$1,446, +0.21% from previous year)
- 2021: $790,247 (+$102,286, +14.87% from previous year)
- 2022: $934,248 (+$144,001, +18.22% from previous year)
- 2023: $961,921 (+$27,673, +2.96% from previous year)
- 2024: $998,460 (+$36,539, +3.80% from previous year)
- 2025: $1,027,169 (+$28,709, +2.88% from previous year)
Deephaven’s home prices have surged nearly 95% since 2012, growing from $473,024 to over $1 million in 2025. The sharpest gains occurred during 2021 and 2022, when the average home value jumped more than $250,000. Since then, the market has continued to grow—albeit at a steadier pace—pushing the town into the seven-figure tier. Unlike some towns that have seen cooling trends, Deephaven’s pricing has remained resilient. Each year has brought new increases, no matter how small, and the 2025 figure represents yet another record high. This sustained appreciation, coupled with continued buyer demand, reflects Deephaven’s elite status among Lake Minnetonka communities.
Deephaven – Lakeside Sophistication With a Neighborhood Feel
Deephaven sits on the southeastern edge of Lake Minnetonka and is defined by its winding roads, towering trees, and peaceful lakeshore views. While it shares the prestige of other lakefront towns, Deephaven has a more residential, less commercialized feel, offering buyers a quiet retreat that still feels connected. The town is prized for its public beaches, small parks, and historic homes—many of which date back over a century and have been lovingly maintained or renovated. Deephaven’s zoning supports large lots and protects its lush landscape, meaning the community has retained a low-density charm even as values have soared. Schools are another draw: the town is served by the acclaimed Minnetonka School District, making it a top choice for families who want excellence in both academics and environment.
For those looking to buy in Deephaven, opportunities are limited. The town has a relatively small housing stock, and most properties are custom-built or architecturally unique, which adds even more value and competition. The combination of water access, school quality, and community character has created a lasting appeal that shows no signs of slowing down. In 2025, average home prices are well above $1 million, driven not just by location, but by the consistency of demand across buyer demographics—from retirees to young professionals with growing families. While surrounding towns continue to grow and develop, Deephaven remains comfortably anchored in its identity: elegant, established, and quietly one of the most desirable places to own property in Minnesota.
7. Tonka Bay – 115% Home Price Increase Since 2012
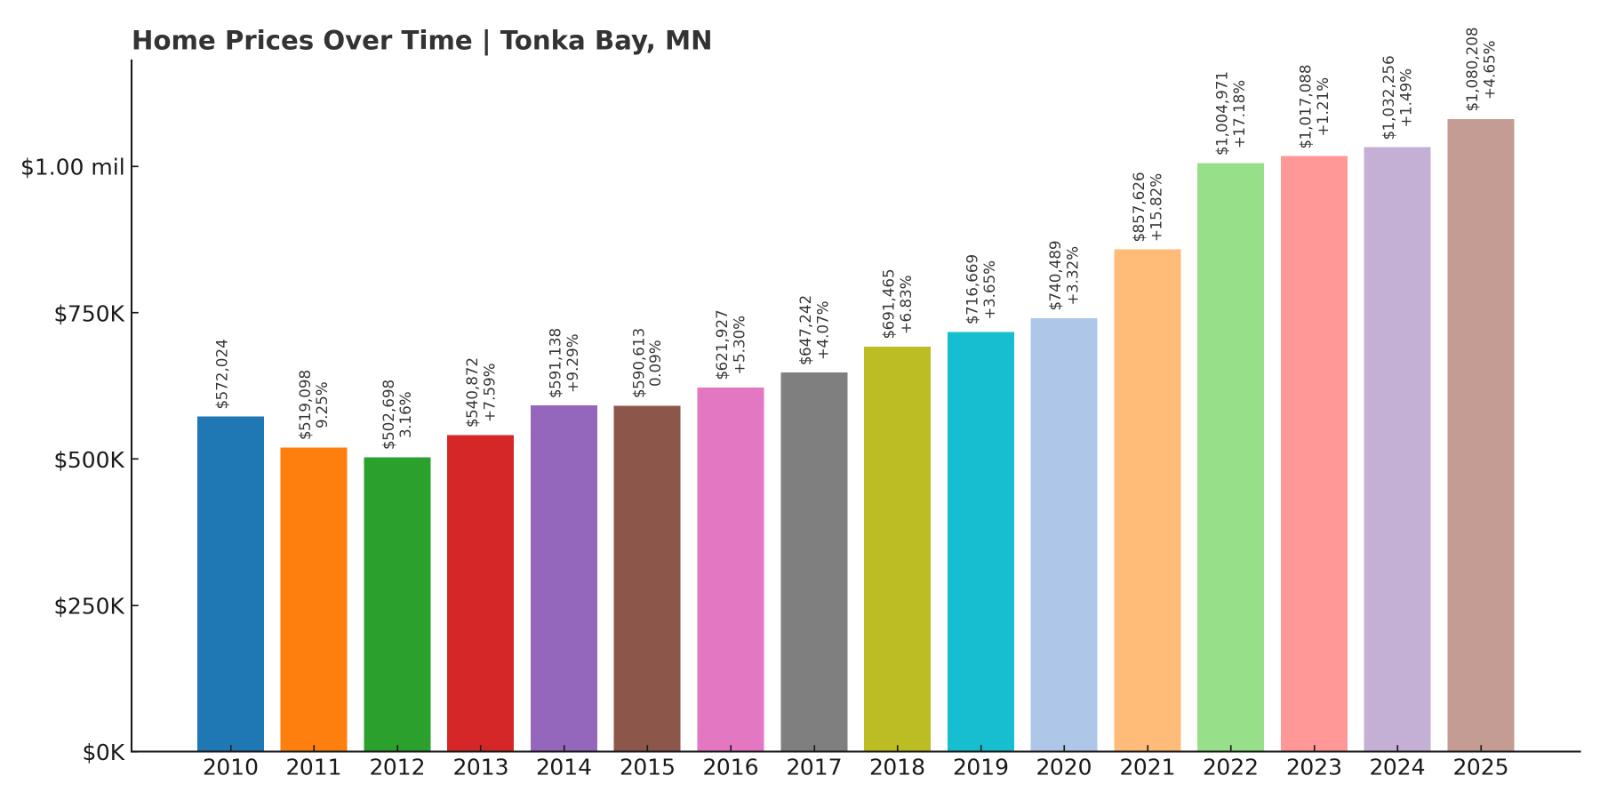
- 2010: $572,024
- 2011: $519,098 (−$52,926, −9.25% from previous year)
- 2012: $502,698 (−$16,400, −3.16% from previous year)
- 2013: $540,872 (+$38,174, +7.59% from previous year)
- 2014: $591,138 (+$50,266, +9.29% from previous year)
- 2015: $590,613 (−$525, −0.09% from previous year)
- 2016: $621,927 (+$31,314, +5.30% from previous year)
- 2017: $647,242 (+$25,315, +4.07% from previous year)
- 2018: $691,465 (+$44,223, +6.83% from previous year)
- 2019: $716,669 (+$25,204, +3.65% from previous year)
- 2020: $740,489 (+$23,820, +3.32% from previous year)
- 2021: $857,626 (+$117,137, +15.82% from previous year)
- 2022: $1,004,971 (+$147,345, +17.18% from previous year)
- 2023: $1,017,088 (+$12,117, +1.21% from previous year)
- 2024: $1,032,256 (+$15,168, +1.49% from previous year)
- 2025: $1,080,208 (+$47,952, +4.65% from previous year)
Tonka Bay’s housing market has more than doubled in value since 2012, with average home prices rising from $502,698 to $1,080,208 by 2025—a 115% increase. That puts it firmly in the luxury tier, with very few signs of slowing down. The biggest leap came between 2020 and 2022, when the market added over $260,000 in just two years. While the growth moderated in 2023 and 2024, prices continued climbing, and 2025 marked yet another all-time high. Even with its small footprint, Tonka Bay has consistently ranked among the most expensive towns in Minnesota. Tight inventory, strong lakefront demand, and upscale housing stock have made it one of the most resilient and rewarding markets in the state.
Tonka Bay – Lake Minnetonka Prestige in a Compact Package
Tonka Bay may be small, but it delivers big when it comes to location and desirability. Nestled on a narrow peninsula of Lake Minnetonka, the town offers a uniquely intimate lakeside living experience with exceptional waterfront access. Nearly every home in Tonka Bay is within walking distance to the water—or directly on it. That geographic advantage, combined with the area’s lush green canopy and tucked-away feel, gives Tonka Bay an exclusive charm that rivals much larger towns. Homes here range from mid-century modern renovations to multimillion-dollar estates with private docks, boat houses, and panoramic lake views. With limited commercial development and highly controlled zoning, the town maintains its serene, residential character while still offering easy access to nearby Excelsior and Minnetonka.
Tonka Bay is part of the Minnetonka School District, which ranks among the best in Minnesota, making it particularly attractive to families who want both scenic beauty and educational quality. The city also boasts several small parks, marinas, and trails, creating a close-knit community atmosphere. But make no mistake: this is one of the priciest zip codes in the state, and it’s getting more expensive each year. Inventory is notoriously tight, and new construction opportunities are scarce, which has pushed prices consistently upward. Many properties are off-market or sold privately, contributing to the town’s reputation for exclusivity. With home values now over $1 million and showing no signs of reversing course, Tonka Bay remains one of the most coveted slices of lakefront property in Minnesota.
6. Orono – 105% Home Price Increase Since 2012
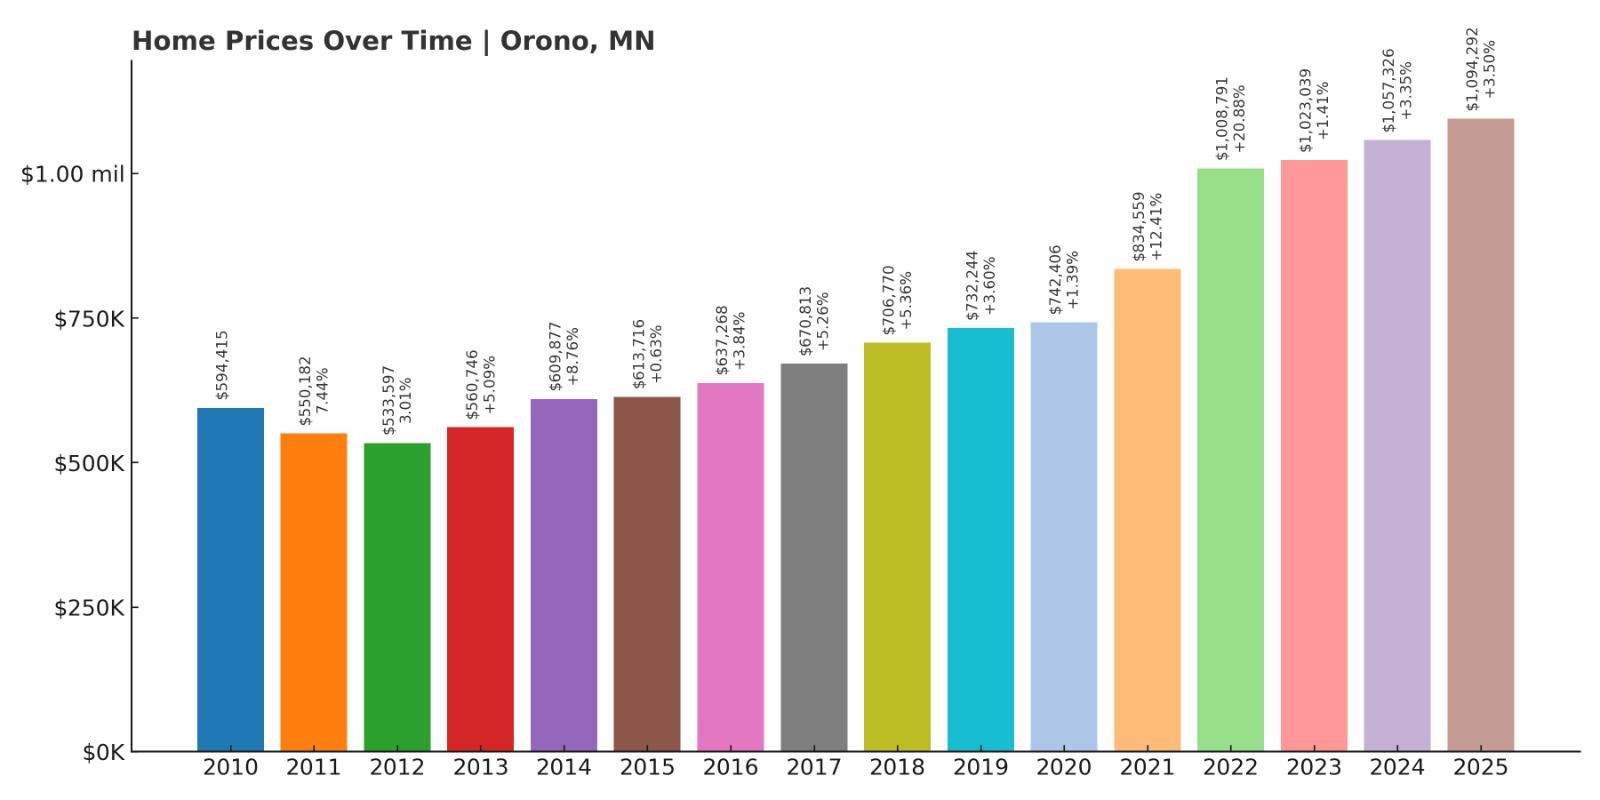
- 2010: $594,415
- 2011: $550,182 (−$44,233, −7.44% from previous year)
- 2012: $533,597 (−$16,585, −3.01% from previous year)
- 2013: $560,746 (+$27,149, +5.09% from previous year)
- 2014: $609,877 (+$49,131, +8.76% from previous year)
- 2015: $613,716 (+$3,839, +0.63% from previous year)
- 2016: $637,268 (+$23,552, +3.84% from previous year)
- 2017: $670,813 (+$33,545, +5.26% from previous year)
- 2018: $706,770 (+$35,957, +5.36% from previous year)
- 2019: $732,244 (+$25,474, +3.60% from previous year)
- 2020: $742,406 (+$10,162, +1.39% from previous year)
- 2021: $834,559 (+$92,153, +12.41% from previous year)
- 2022: $1,008,791 (+$174,232, +20.88% from previous year)
- 2023: $1,023,039 (+$14,248, +1.41% from previous year)
- 2024: $1,057,326 (+$34,287, +3.35% from previous year)
- 2025: $1,094,292 (+$36,966, +3.50% from previous year)
Orono’s home prices have climbed by 105% since 2012, soaring from $533,597 to $1,094,292 in 2025. The most explosive gains occurred in 2021 and 2022, where values leapt more than $260,000—driven by surging demand for space, luxury, and access to Lake Minnetonka. Even as the broader market slowed down after 2022, Orono’s growth continued, with prices steadily increasing year after year. The consistency in its appreciation and its ability to maintain value during market corrections have made Orono one of the strongest-performing luxury towns in the state. With the million-dollar mark well behind it, the town continues to attract high-end buyers looking for both investment security and upscale living.
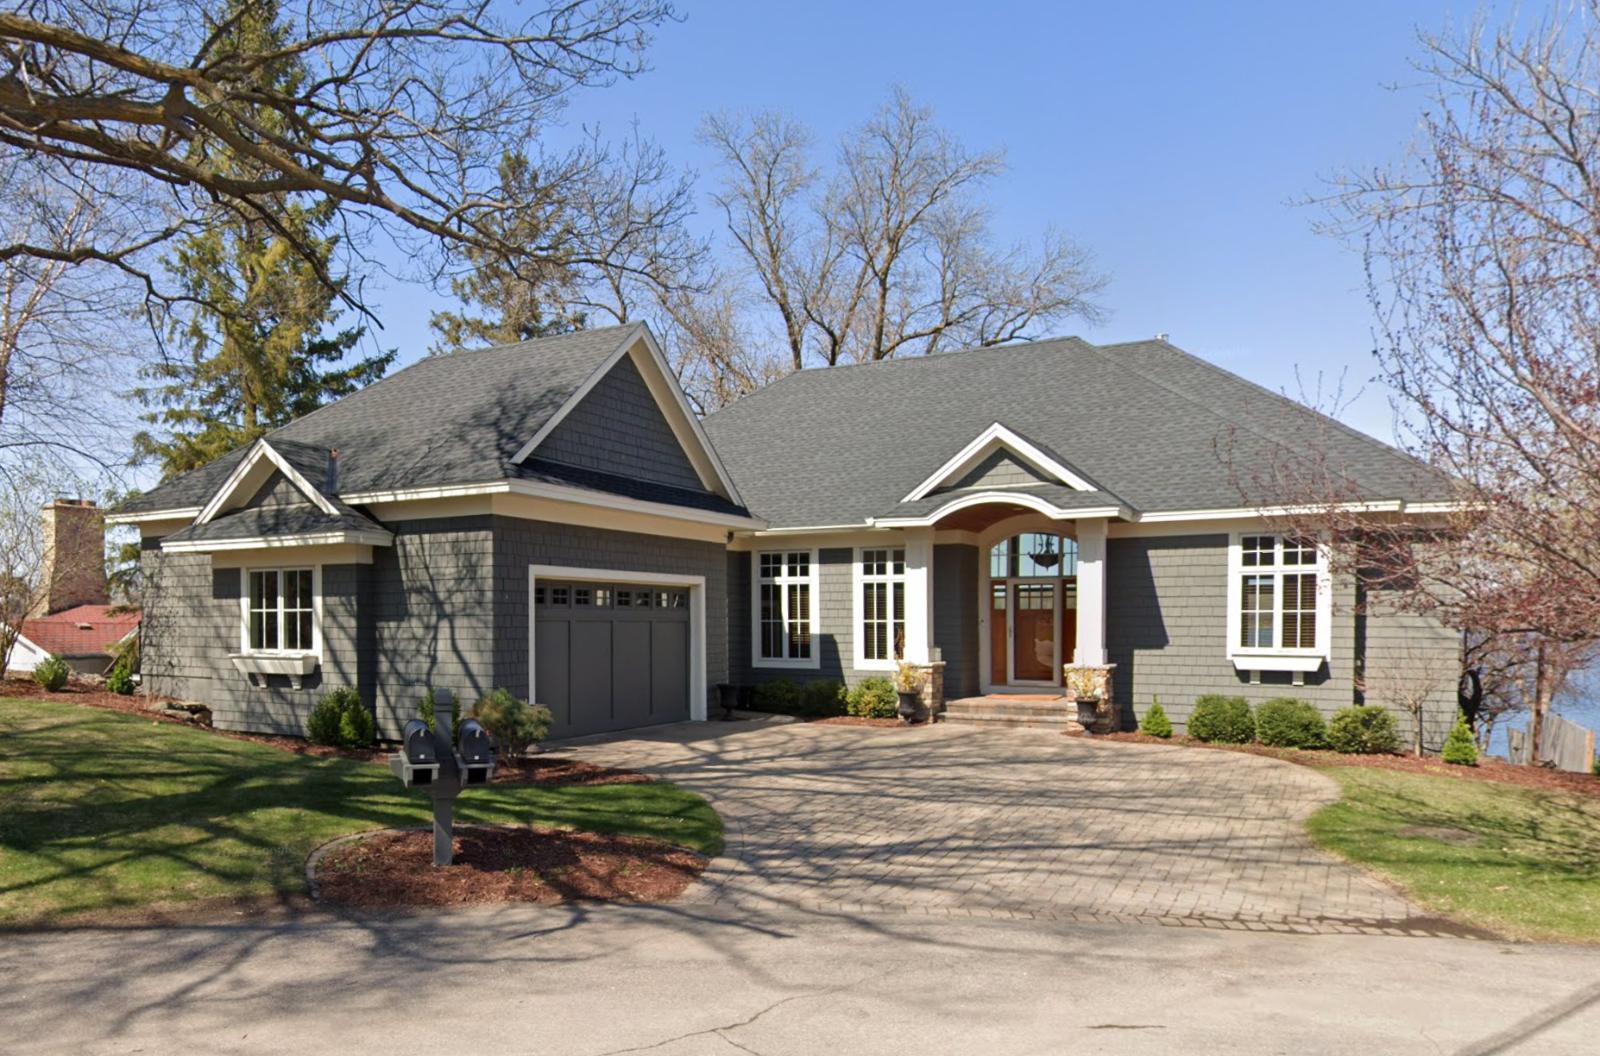
Orono – Luxury Meets Land on the Lake’s North Shore
Located on the north and west shores of Lake Minnetonka, Orono is a sprawling community known for its large estates, wooded acreage, and commanding views of the water. What sets Orono apart is its unique blend of natural beauty and sheer scale—properties here often span several acres and feature private lake access, guest houses, and gated entries. The town has long been favored by business leaders, professional athletes, and others seeking privacy without isolation. It also features some of the most stunning lakefront real estate in Minnesota, often priced well into the multi-million-dollar range. Orono’s thoughtful land-use planning prioritizes space and green cover, with minimal commercial intrusion and a strong focus on residential quality.
Orono is served by its namesake school district, consistently ranked among the best in the state, and offers quick access to both downtown Wayzata and Minneapolis via Highway 12. While many buyers are drawn to the lake, just as many are attracted to the area’s blend of woods, trails, and parks. The community also includes private golf courses, yacht clubs, and some of the most exclusive gated developments in the Twin Cities metro. Its stability over the past decade, combined with enormous equity growth during the early 2020s, has made Orono a go-to market for high-net-worth individuals seeking homes that offer both prestige and peace. With home prices nearing $1.1 million in 2025 and rising steadily, Orono continues to dominate the western metro’s luxury segment.
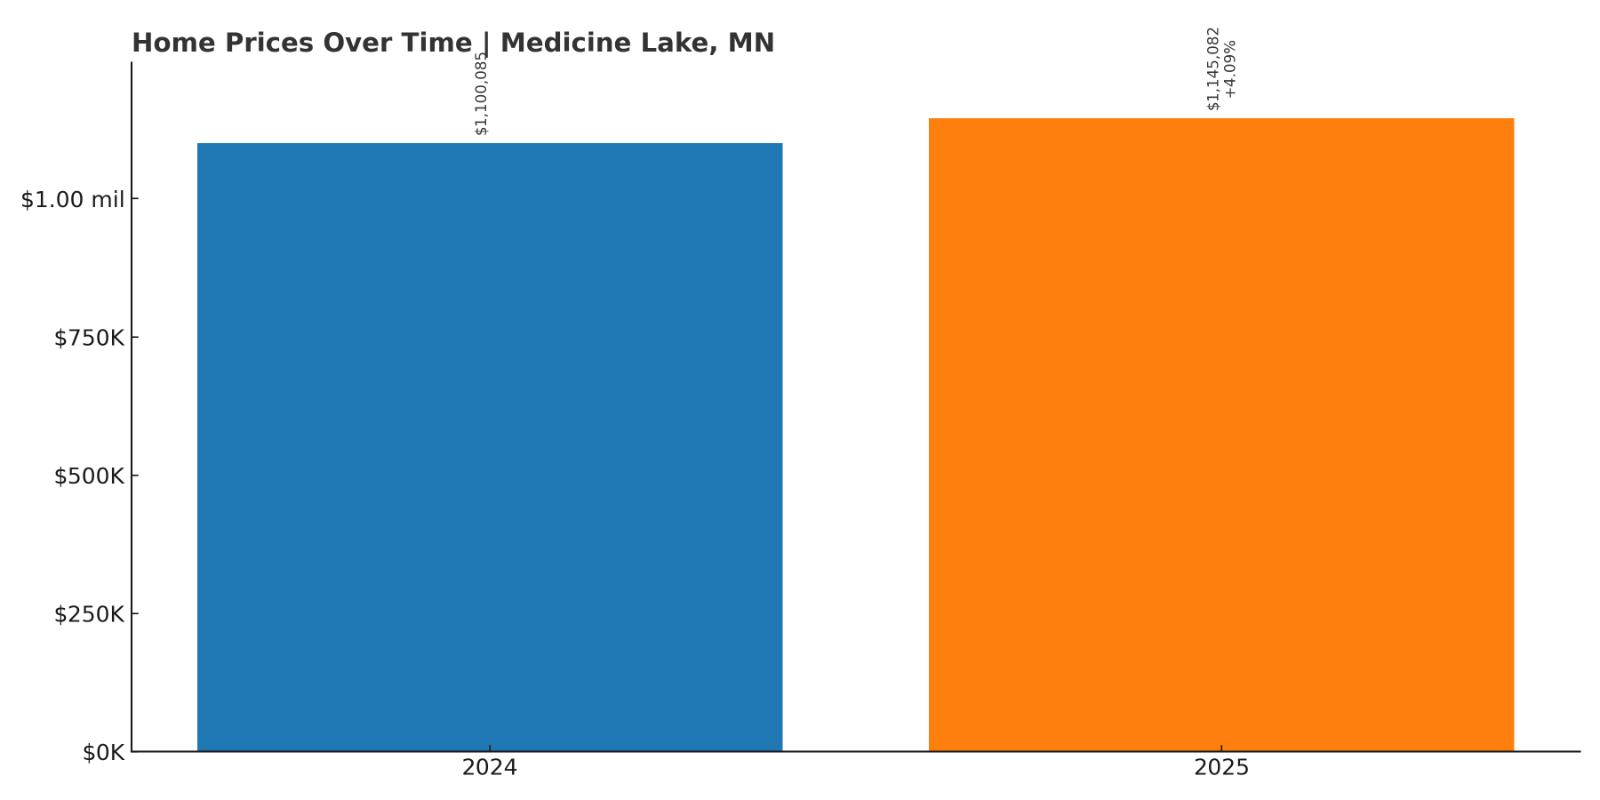
5. Medicine Lake – N/A% Home Price Increase (Data Available Since 2024)
- 2010: N/A
- 2011: N/A
- 2012: N/A
- 2013: N/A
- 2014: N/A
- 2015: N/A
- 2016: N/A
- 2017: N/A
- 2018: N/A
- 2019: N/A
- 2020: N/A
- 2021: N/A
- 2022: N/A
- 2023: N/A
- 2024: $1,100,085
- 2025: $1,145,082 (+$44,997, +4.09% from previous year)
Medicine Lake entered the available dataset in 2024, with a high starting home value of $1.1 million—immediately placing it among Minnesota’s most expensive towns. Though earlier data is not available, the town’s location and housing profile suggest that it has long been a luxury enclave. The available figures show a 4.09% year-over-year increase in 2025, which is a healthy growth rate for a market already operating in the seven-figure range. In a time when many luxury towns have seen market plateaus or slight corrections, Medicine Lake’s rise suggests both active demand and market confidence. Its small size and exclusive feel likely play a significant role in keeping prices high and inventory limited. While we can’t compare long-term trends like in other towns, the most recent numbers are more than enough to demonstrate its elite status in Minnesota real estate.
Medicine Lake – An Ultra-Exclusive Enclave With Lakefront Prestige
Medicine Lake is one of the smallest and most exclusive towns in Hennepin County, tucked between Plymouth and Golden Valley on the shores of its namesake lake. It spans just over one square mile and is home to only a few hundred residents, which makes every property highly coveted. The homes here are primarily custom-built and many feature direct lake access, with large lots and mature trees offering both privacy and natural beauty. There’s virtually no commercial development within the town limits, helping to preserve its quiet, residential character. What sets Medicine Lake apart is its hidden-in-plain-sight feel—just minutes from downtown Minneapolis, yet it feels like a secluded retreat. For those who can secure a home here, it offers the kind of privacy and lakeside living usually reserved for much larger estates far outside the metro.
Because the town is so small and so little inventory changes hands, home sales tend to occur quietly, often through word of mouth or private listings. That rarity factor is a big reason for the $1.1 million average home price recorded in 2024, which has already climbed modestly in 2025. Homes here aren’t just expensive—they’re rarely available, and that exclusivity drives up demand. The town’s appeal is further amplified by its convenient access to top public and private schools, as well as quick routes to downtown, the North Loop, and other commercial hubs. With very few parcels ever hitting the market and no room for expansion, Medicine Lake is likely to remain a quiet stronghold of wealth just west of the city—perfect for buyers who want luxury, seclusion, and a lakefront lifestyle without leaving the metro behind.
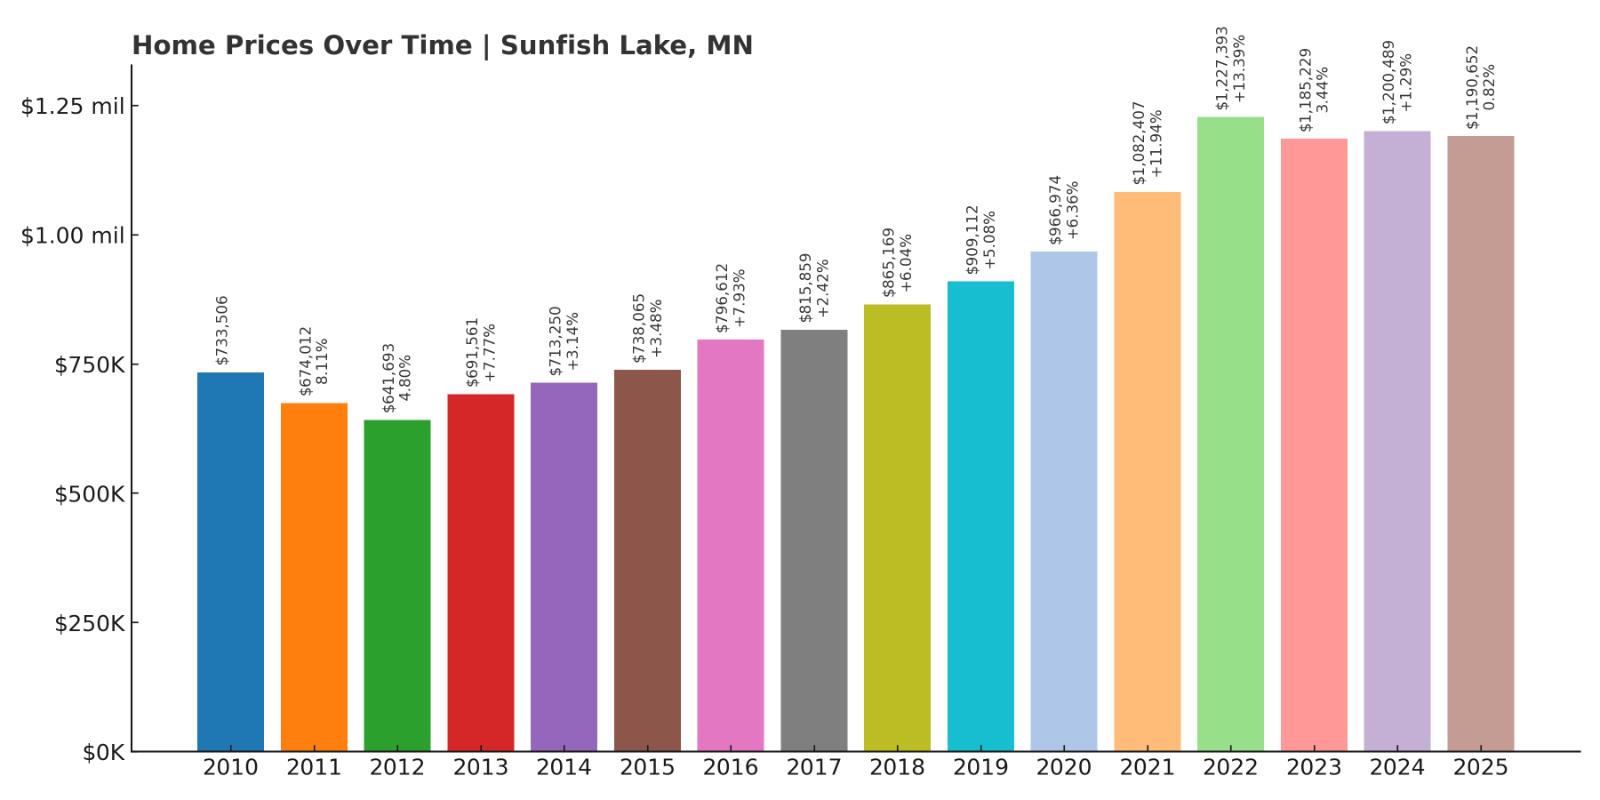
4. Sunfish Lake – 85% Home Price Increase Since 2012
- 2010: $733,506
- 2011: $674,012 (−$59,494, −8.11% from previous year)
- 2012: $641,693 (−$32,319, −4.80% from previous year)
- 2013: $691,561 (+$49,868, +7.77% from previous year)
- 2014: $713,250 (+$21,689, +3.14% from previous year)
- 2015: $738,065 (+$24,815, +3.48% from previous year)
- 2016: $796,612 (+$58,547, +7.93% from previous year)
- 2017: $815,859 (+$19,247, +2.42% from previous year)
- 2018: $865,169 (+$49,310, +6.04% from previous year)
- 2019: $909,112 (+$43,943, +5.08% from previous year)
- 2020: $966,974 (+$57,862, +6.36% from previous year)
- 2021: $1,082,407 (+$115,433, +11.94% from previous year)
- 2022: $1,227,393 (+$144,986, +13.39% from previous year)
- 2023: $1,185,229 (−$42,164, −3.44% from previous year)
- 2024: $1,200,489 (+$15,260, +1.29% from previous year)
- 2025: $1,190,652 (−$9,837, −0.82% from previous year)
Sunfish Lake has seen an 85% home price increase since 2012, climbing from $641,693 to $1,190,652 in 2025. While the town experienced a brief market correction between 2023 and 2025, those dips followed a stretch of aggressive growth that saw home prices climb by over $400,000 in just five years. Despite the recent softening, Sunfish Lake remains one of the priciest zip codes in Minnesota. With a starting point well above average and a multi-year history of double-digit annual gains, the market here is still strong in the broader context. The slight year-over-year losses in the past two years are better viewed as a leveling off than a downturn. In elite housing markets like this, plateaus are often followed by renewed growth, and the fundamentals in Sunfish Lake remain sound.
Sunfish Lake – Forested Luxury Just Minutes From Saint Paul
Sunfish Lake is unlike any other city in the metro area. Located just south of West Saint Paul, this heavily wooded town is home to some of the most expensive—and private—real estate in the Twin Cities. With strict zoning laws that require a minimum of 2.5 acres per lot, the city has intentionally limited development to preserve its natural environment. The result is a tranquil, semi-rural setting filled with winding roads, dense tree cover, and architecturally distinct homes tucked behind long driveways. Residents prize the town’s quiet elegance, and its proximity to both downtown Saint Paul and the airport makes it uniquely convenient for high-level professionals. Homes here rarely come on the market, and when they do, they often sell for well over seven figures.
Despite recent price softening, Sunfish Lake remains a deeply desirable address. The slight declines in 2023 and 2025 reflect broader luxury market slowdowns rather than any local weakness. In fact, Sunfish Lake’s appeal is more rooted in lifestyle and location than market trends. It’s one of the few places in the metro where you can find secluded estates with full wooded privacy, lake access, and proximity to major job centers. Buyers here are not just looking for a house—they’re seeking long-term value in an environment that’s unlikely to change. With conservation easements, low turnover, and a reputation for exclusivity, Sunfish Lake continues to command some of the highest real estate prices in the state. Even as markets shift, it remains a haven for those who value space, serenity, and status.
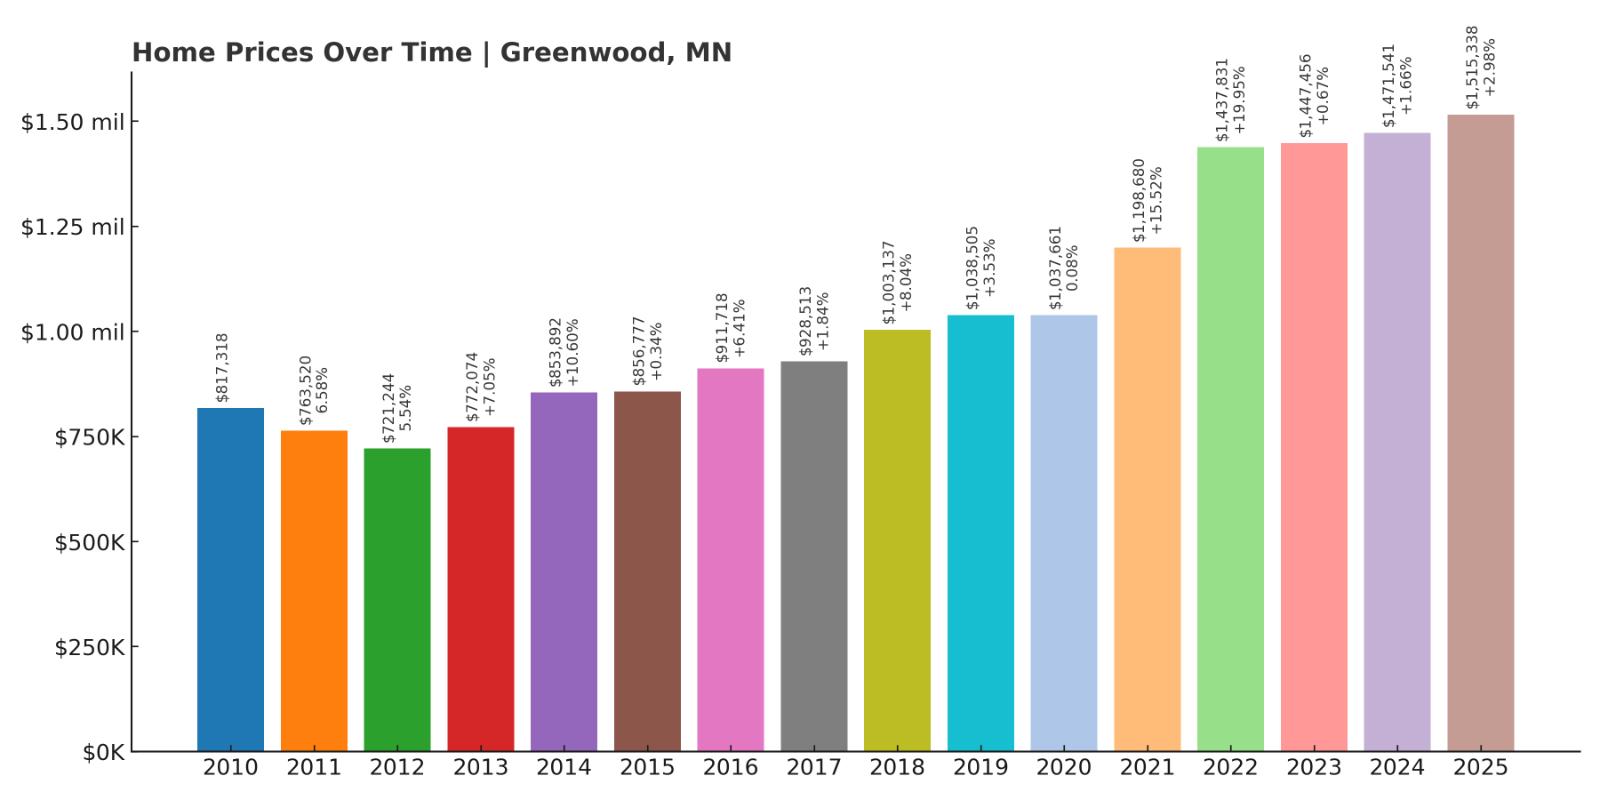
3. Greenwood – 110% Home Price Increase Since 2012
- 2010: $817,318
- 2011: $763,520 (−$53,798, −6.58% from previous year)
- 2012: $721,244 (−$42,276, −5.54% from previous year)
- 2013: $772,074 (+$50,830, +7.05% from previous year)
- 2014: $853,892 (+$81,818, +10.60% from previous year)
- 2015: $856,777 (+$2,885, +0.34% from previous year)
- 2016: $911,718 (+$54,941, +6.41% from previous year)
- 2017: $928,513 (+$16,795, +1.84% from previous year)
- 2018: $1,003,137 (+$74,624, +8.04% from previous year)
- 2019: $1,038,505 (+$35,368, +3.53% from previous year)
- 2020: $1,037,661 (−$844, −0.08% from previous year)
- 2021: $1,198,680 (+$161,019, +15.52% from previous year)
- 2022: $1,437,831 (+$239,151, +19.95% from previous year)
- 2023: $1,447,456 (+$9,625, +0.67% from previous year)
- 2024: $1,471,541 (+$24,085, +1.66% from previous year)
- 2025: $1,515,338 (+$43,797, +2.98% from previous year)
Greenwood’s home prices have climbed an impressive 110% since 2012, rising from $721,244 to $1,515,338 by 2025. This lakeside town saw particularly sharp growth during 2021 and 2022, with values jumping over $400,000 in that short span alone. While growth slowed somewhat in the last two years, the momentum remained positive, with new price highs set in 2025. Unlike some luxury markets that experienced steeper corrections, Greenwood’s appreciation has been more gradual in recent years—suggesting buyer demand is still strong but more measured. With home values now firmly in the $1.5 million range, Greenwood ranks among the elite in Minnesota’s high-end housing market.
Greenwood – A Tiny Jewel With Big Price Tags
Greenwood is one of the smallest towns on Lake Minnetonka, but its real estate ranks among the most valuable in the state. Located just south of Excelsior, it spans barely half a square mile—yet nearly every home enjoys proximity to the lake, many with sweeping shoreline views or private docks. The town’s exclusivity is partly due to geography: it’s almost entirely surrounded by water, meaning available land is extremely limited. Homes here are often architect-designed, and the market consists of multimillion-dollar estates that are seldom listed publicly. Greenwood also boasts a peaceful, tucked-away feel, but with quick access to Excelsior’s shops, restaurants, and marina—offering the best of both privacy and convenience. This combination of location and scarcity has made Greenwood a perennial favorite among elite buyers.
Greenwood’s zoning preserves its low-density, residential-only vibe, with no commercial buildings and very little traffic. That atmosphere has made it a magnet for high-net-worth individuals who want a lakeside retreat that feels more private than nearby tourist destinations. The homes are some of the finest on Lake Minnetonka, with features like expansive lakefront lawns, stone boathouses, and multi-slip docks. Buyers come here knowing that properties are rare and prices are premium—and that’s exactly what keeps values high. Even during economic slowdowns, Greenwood holds its place at the top of the market. With home prices now surpassing $1.5 million and a reputation for quiet luxury, Greenwood is a perfect example of how small-town scale can deliver massive real estate value.
2. Woodland – 105% Home Price Increase Since 2012
- 2010: $968,658
- 2011: $908,514 (−$60,144, −6.21% from previous year)
- 2012: $886,839 (−$21,675, −2.39% from previous year)
- 2013: $943,051 (+$56,212, +6.34% from previous year)
- 2014: $1,014,881 (+$71,830, +7.62% from previous year)
- 2015: $1,022,666 (+$7,785, +0.77% from previous year)
- 2016: $1,040,009 (+$17,343, +1.70% from previous year)
- 2017: $1,065,285 (+$25,276, +2.43% from previous year)
- 2018: $1,091,610 (+$26,325, +2.47% from previous year)
- 2019: $1,130,171 (+$38,561, +3.53% from previous year)
- 2020: $1,120,569 (−$9,602, −0.85% from previous year)
- 2021: $1,324,553 (+$203,984, +18.20% from previous year)
- 2022: $1,568,452 (+$243,899, +18.41% from previous year)
- 2023: $1,587,088 (+$18,636, +1.19% from previous year)
- 2024: $1,579,243 (−$7,845, −0.49% from previous year)
- 2025: $1,675,925 (+$96,682, +6.12% from previous year)
Woodland has more than doubled in value since 2012, rising from $886,839 to $1,675,925 in 2025. That 105% increase includes massive surges in 2021 and 2022, when prices rose by nearly half a million dollars across just two years. While 2024 saw a minor dip, prices quickly rebounded in 2025 with a strong 6% gain, pushing values to a new all-time high. The long-term trend is unmistakably upward, and it positions Woodland as one of the most exclusive residential areas in Minnesota. Its homes consistently rank among the state’s highest-priced, and its stability even during high market volatility reflects both its scarcity and desirability.
Woodland – Privacy, Prestige, and Protected Land
Woodland is perhaps the most hidden of all the high-end Lake Minnetonka communities. Tucked along the lake’s eastern shore, this tiny city is enveloped by trees, winding roads, and stately mansions, most of which are barely visible from the street. Its small size and forested terrain give it a country estate feel, even though it’s only about 20 minutes from downtown Minneapolis. Homes here often come with extensive private frontage, multi-acre lots, and architectural styles that range from European-inspired estates to sleek contemporary builds. With no commercial district and strict zoning, Woodland offers pure residential living with almost no public access—ideal for those seeking seclusion and exclusivity. This scarcity has helped maintain sky-high prices even when neighboring areas experienced downturns.
The city’s identity is centered on quiet luxury and land preservation. Many properties include conservation easements or are adjacent to protected shoreline, which ensures that the area’s natural character remains intact. The appeal isn’t just the homes—it’s the lifestyle: woodland walking paths, lake access without crowds, and neighbors who value privacy as much as aesthetics. Woodland shares borders with Wayzata and Deephaven, but it remains distinct in its near-total lack of through traffic or commercial encroachment. For high-net-worth buyers, Woodland offers something rare—a genuine retreat within commuting distance of the Twin Cities. Its $1.67 million average price in 2025 reflects not just market trends, but a level of exclusivity and appeal that is nearly unmatched statewide.
1. Minnetonka Beach – 150% Home Price Increase Since 2012
- 2010: $916,096
- 2011: $858,801 (−$57,295, −6.25% from previous year)
- 2012: $828,367 (−$30,434, −3.54% from previous year)
- 2013: $877,140 (+$48,773, +5.89% from previous year)
- 2014: $956,759 (+$79,619, +9.08% from previous year)
- 2015: $983,106 (+$26,347, +2.75% from previous year)
- 2016: $1,098,529 (+$115,423, +11.74% from previous year)
- 2017: $1,158,387 (+$59,858, +5.45% from previous year)
- 2018: $1,275,588 (+$117,201, +10.12% from previous year)
- 2019: $1,344,825 (+$69,237, +5.43% from previous year)
- 2020: $1,326,876 (−$17,949, −1.33% from previous year)
- 2021: $1,588,572 (+$261,696, +19.72% from previous year)
- 2022: $1,932,926 (+$344,354, +21.68% from previous year)
- 2023: $1,994,845 (+$61,919, +3.20% from previous year)
- 2024: $1,998,087 (+$3,242, +0.16% from previous year)
- 2025: $2,071,222 (+$73,135, +3.66% from previous year)
Minnetonka Beach tops the list with an extraordinary 150% home price increase since 2012, skyrocketing from $828,367 to $2,071,222 in 2025. That figure makes it the most expensive housing market in the entire state. Its steepest climb came during the 2020–2022 boom, when values rose by nearly $600,000 in just two years. While growth has moderated since then, prices have continued to edge upward, adding more than $73,000 in 2025 alone. This market has proven incredibly resilient, with a price floor well above $2 million. Its long-term strength and limited inventory make Minnetonka Beach a textbook example of how location, exclusivity, and consistent demand can propel real estate values to record-breaking highs.
Minnetonka Beach – The Crown Jewel of Minnesota Real Estate
Minnetonka Beach is the undisputed pinnacle of luxury living in Minnesota. Located on a narrow peninsula in the heart of Lake Minnetonka, the town is surrounded by water on nearly all sides, offering incredible views and maximum privacy. The community is extremely small—fewer than 200 households—but what it lacks in size, it more than makes up for in stature. Nearly every home is lakefront or steps from the water, and many feature private docks, boathouses, and resort-style landscaping. The town is home to Lafayette Club, one of the state’s premier private social and golf clubs, and sits just minutes from Wayzata’s upscale dining and shopping district. From grand estates to custom contemporary builds, Minnetonka Beach properties are both rare and consistently in demand.
With such a limited number of homes and near-zero turnover, inventory in Minnetonka Beach is scarce—and that’s exactly why prices have climbed so sharply. The town has become a symbol of success and exclusivity, appealing to CEOs, legacy families, and buyers relocating from coastal luxury markets. It offers the serenity of lakeside living with the cachet of a truly elite zip code. Zoning and land use rules help preserve its open character, while top-tier schools and proximity to downtown Minneapolis only add to its appeal. For those lucky enough to buy here, Minnetonka Beach represents more than just a place to live—it’s a long-term investment in prestige, privacy, and waterfront perfection.