
Arizona’s luxury housing market has gone full throttle. According to the Zillow Home Value Index, these 19 towns now rank as the most expensive places to own property in the state. From soaring desert retreats to high-altitude hotspots, prices in many of these areas have more than doubled since the early 2010s—some have even tripled. While the sharpest jumps came during the pandemic boom, values in most of these towns haven’t just held—they’ve kept rising.
Whether driven by retirees, remote workers, or second-home buyers, demand in these markets shows no sign of slowing. These aren’t just expensive towns—they’re the ones where wealth, location, and lifestyle converge, and where owning property puts you in Arizona’s top housing tier.
19. Greer – N/A% Home Price Increase Since 2023
- 2010: N/A
- 2011: N/A
- 2012: N/A
- 2013: N/A
- 2014: N/A
- 2015: N/A
- 2016: N/A
- 2017: N/A
- 2018: N/A
- 2019: N/A
- 2020: N/A
- 2021: N/A
- 2022: N/A
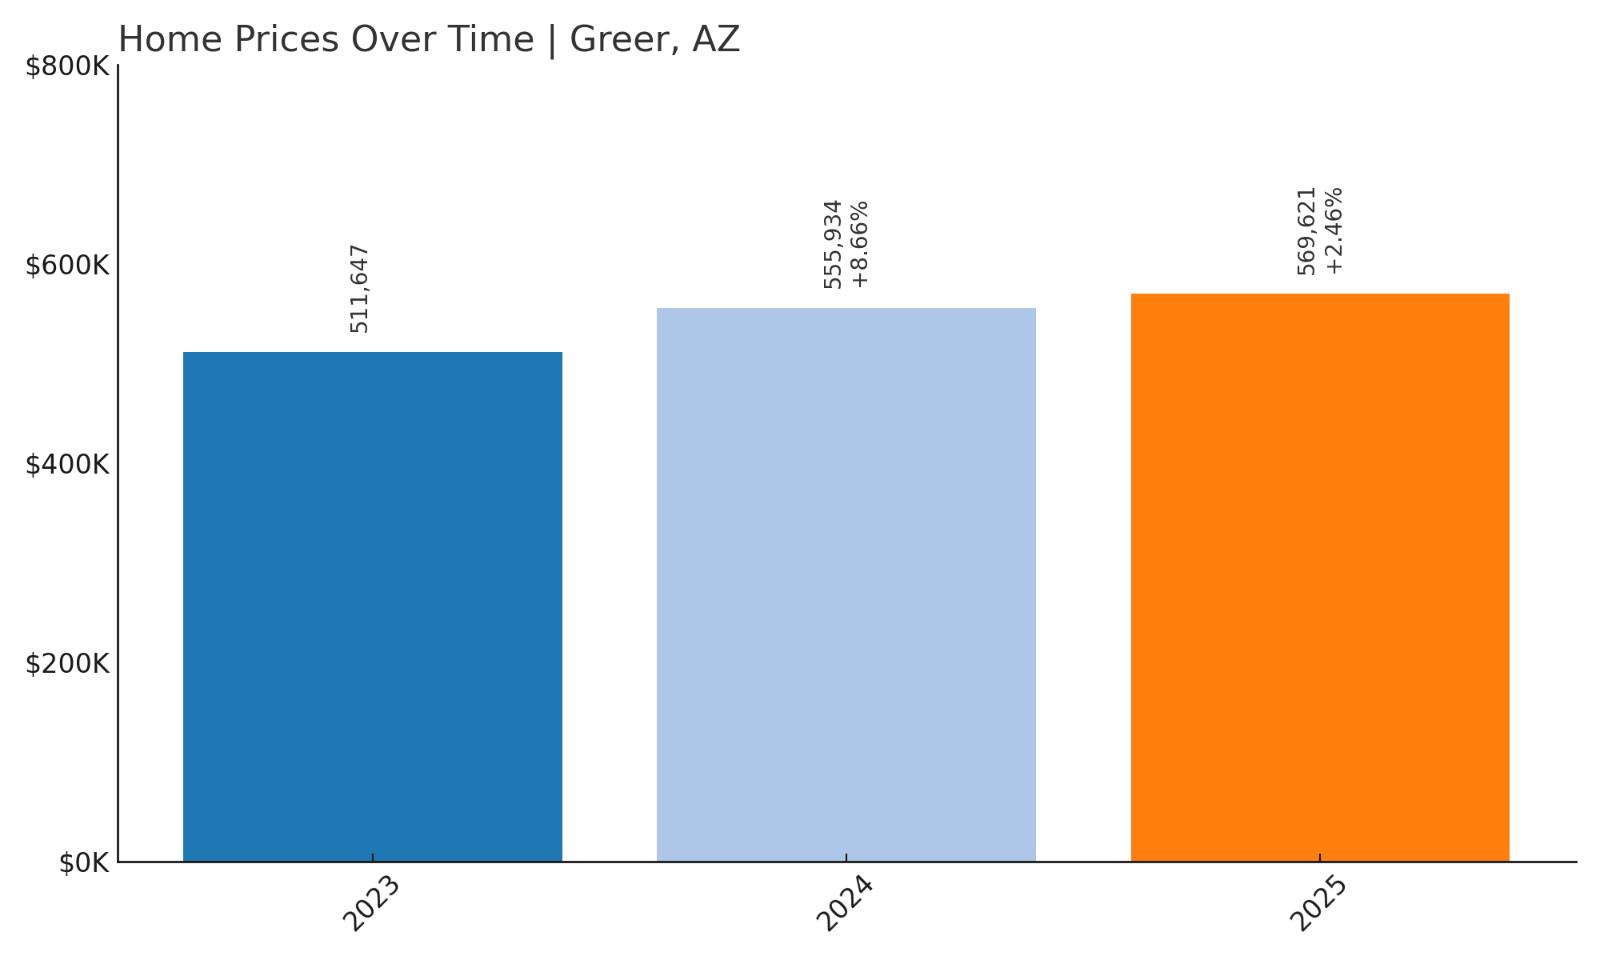
- 2023: $511,647
- 2024: $555,934 (+$44,287, +8.66% from previous year)
- 2025: $569,621 (+$13,686, +2.46% from previous year)
Greer doesn’t have a long home price history available on Zillow, but the three most recent years already paint a revealing picture. From 2023 to 2025, home values in this remote mountain town rose from $511,647 to $569,621 — a two-year increase of about 11.3%. The most significant jump came in 2024 with an 8.66% rise, followed by a modest gain of 2.46% in 2025. This kind of upward momentum, especially in a town with limited available data and presumably tight inventory, often signals a concentrated demand surge in a very specific kind of market. Even without earlier years to compare, it’s clear that Greer is seeing rising buyer interest in the current cycle, likely driven by its location and lifestyle appeal.
Greer – A Remote Alpine Village With Rapid Appeal
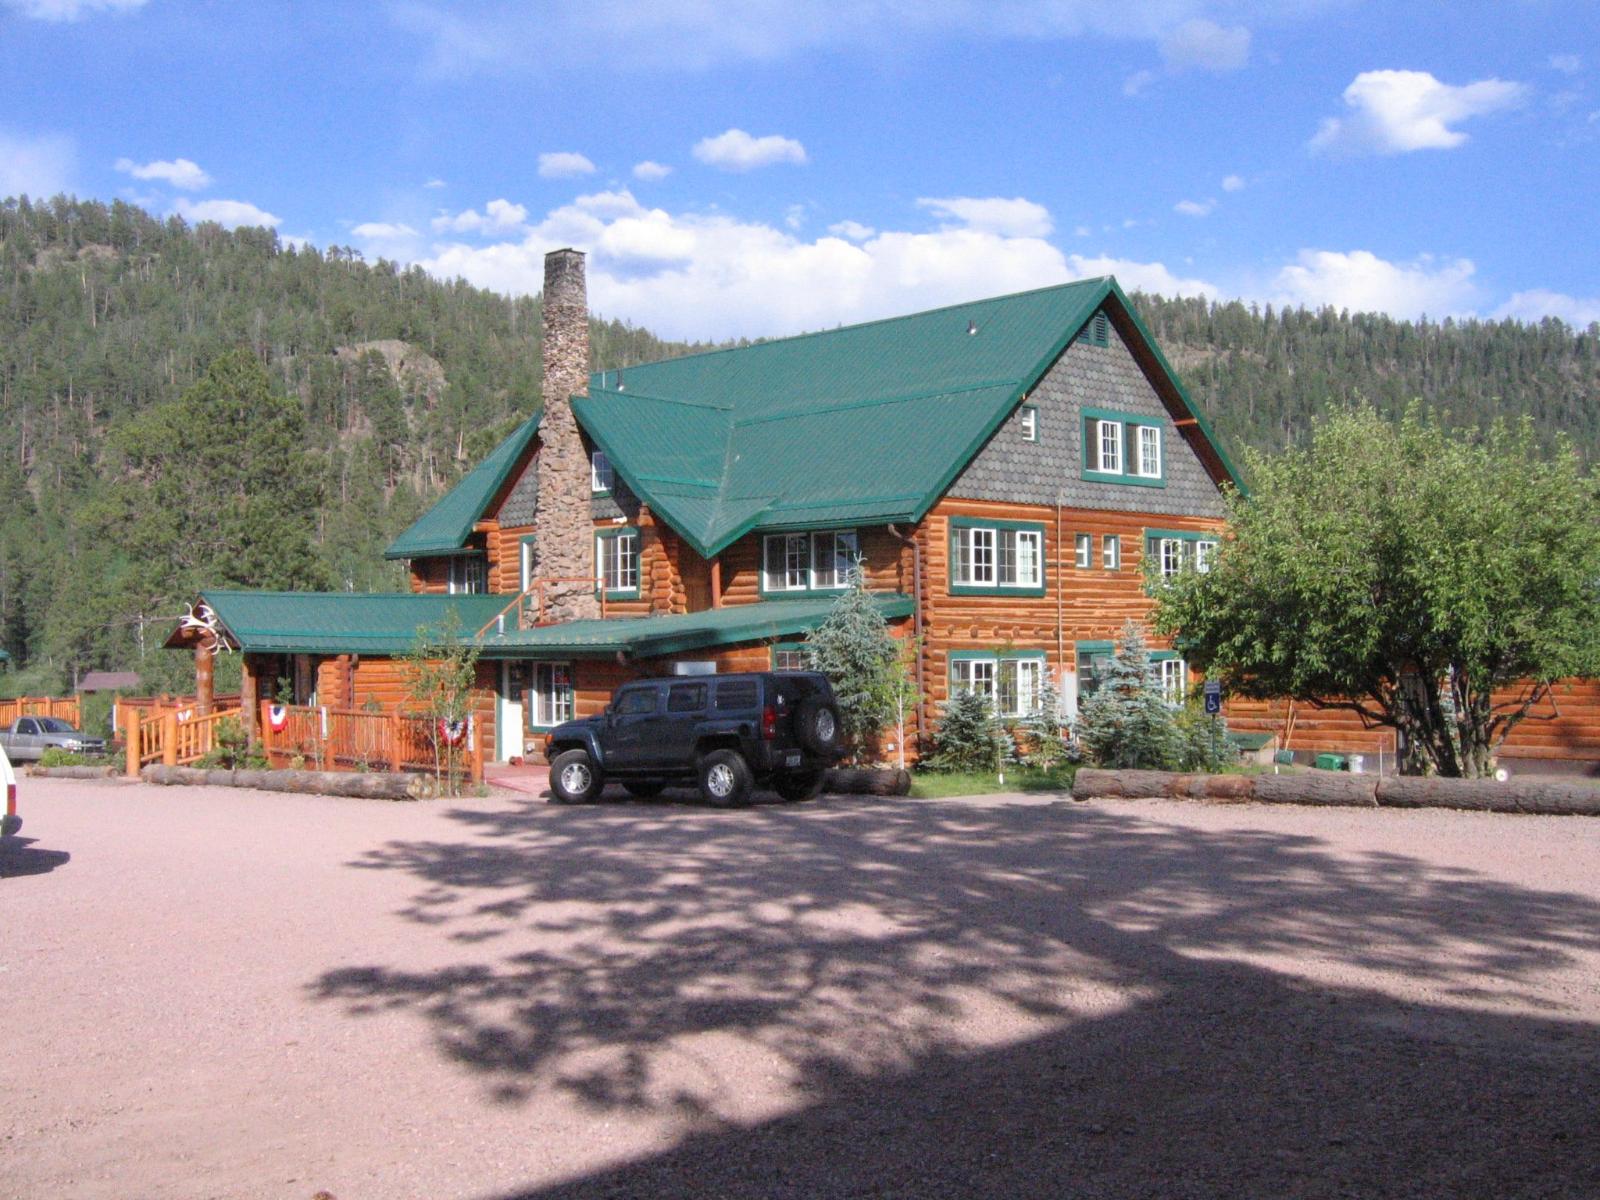
Greer is nestled high in Arizona’s White Mountains at over 8,500 feet elevation, offering a cooler, greener alternative to the rest of the state’s desert climate. Unlike most of Arizona’s expensive markets that surround Phoenix or Tucson, Greer is rural, remote, and heavily oriented toward recreation, cabin retreats, and scenic living. The area is surrounded by the Apache-Sitgreaves National Forest, and nearby attractions like Sunrise Park Resort and the Little Colorado River draw in visitors all year. There are no big-box stores, no major development corridors, and no urban sprawl — and that’s exactly why it appeals to a niche but motivated group of buyers. Second-home purchasers, retirees looking for peace and quiet, and investors eyeing seasonal short-term rentals are all helping push prices up in this tightly held area.
Because Greer has very little housing inventory and very few new builds, even a small increase in demand can significantly impact pricing. The sharp 2024 gain likely reflects a wave of cash buyers seeking out private, forested properties far from population centers, especially in a post-pandemic world where solitude has more value than ever. The 2025 price increase was more modest but still suggests continued strength in this small mountain submarket. With limited space for expansion and a community intent on preserving its wilderness character, Greer is unlikely to ever become a large or fast-growing town — but that’s part of the reason it commands such a premium. It remains one of the rare places in Arizona where you can still find snowfall in winter, trout fishing in summer, and relative real estate quiet compared to the heat and sprawl of metro Phoenix.
18. Gilbert – 214% Home Price Increase Since 2011
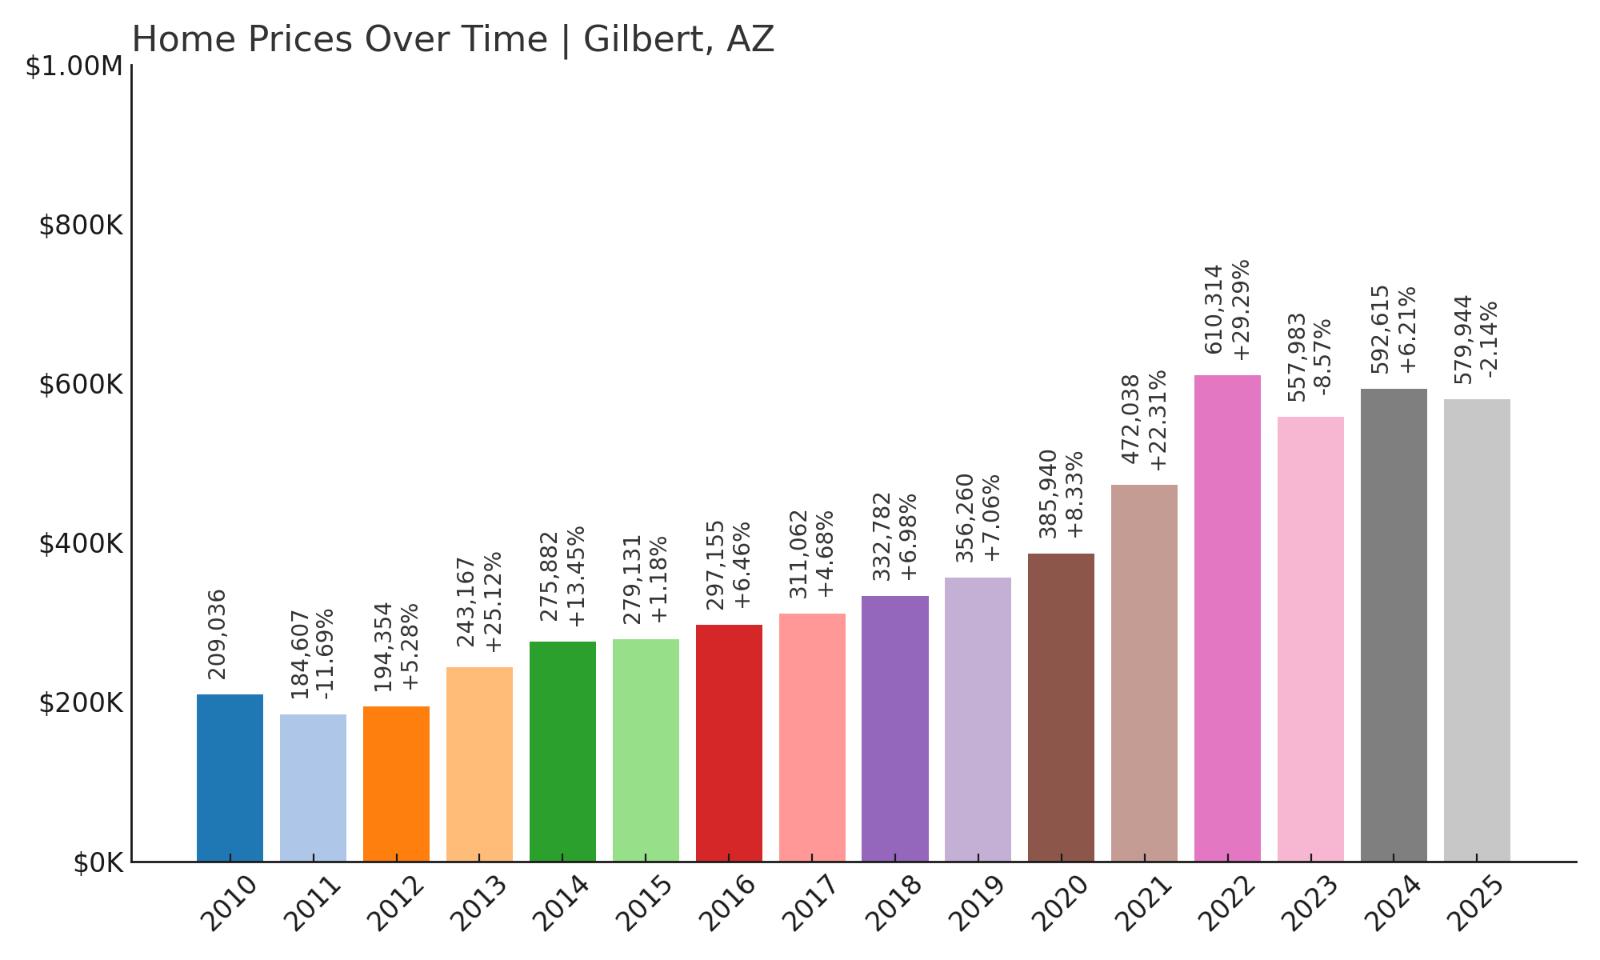
- 2010: $209,036
- 2011: $184,607 (-$24,429, -11.69% from previous year)
- 2012: $194,354 (+$9,747, +5.28% from previous year)
- 2013: $243,167 (+$48,813, +25.12% from previous year)
- 2014: $275,882 (+$32,715, +13.45% from previous year)
- 2015: $279,131 (+$3,249, +1.18% from previous year)
- 2016: $297,155 (+$18,024, +6.46% from previous year)
- 2017: $311,062 (+$13,907, +4.68% from previous year)
- 2018: $332,782 (+$21,720, +6.98% from previous year)
- 2019: $356,260 (+$23,479, +7.06% from previous year)
- 2020: $385,940 (+$29,679, +8.33% from previous year)
- 2021: $472,038 (+$86,098, +22.31% from previous year)
- 2022: $610,314 (+$138,276, +29.29% from previous year)
- 2023: $557,983 (-$52,330, -8.57% from previous year)
- 2024: $592,615 (+$34,632, +6.21% from previous year)
- 2025: $579,944 (-$12,671, -2.14% from previous year)
Gilbert has seen home prices more than triple since hitting a low of $184,607 in 2011, reaching $579,944 by 2025 — a 214% increase over 14 years. After a rapid rise from 2012 through 2022, including a standout jump of nearly 30% in 2022 alone, the market cooled slightly in 2023 and again in 2025. Even so, values remain dramatically higher than a decade ago. The data shows that Gilbert’s housing market has remained resilient, with consistent year-over-year gains except during brief correction periods. This trajectory suggests long-term strength in buyer demand and continued desirability within the Phoenix metro area.
Gilbert – A High-Growth Suburb With Staying Power
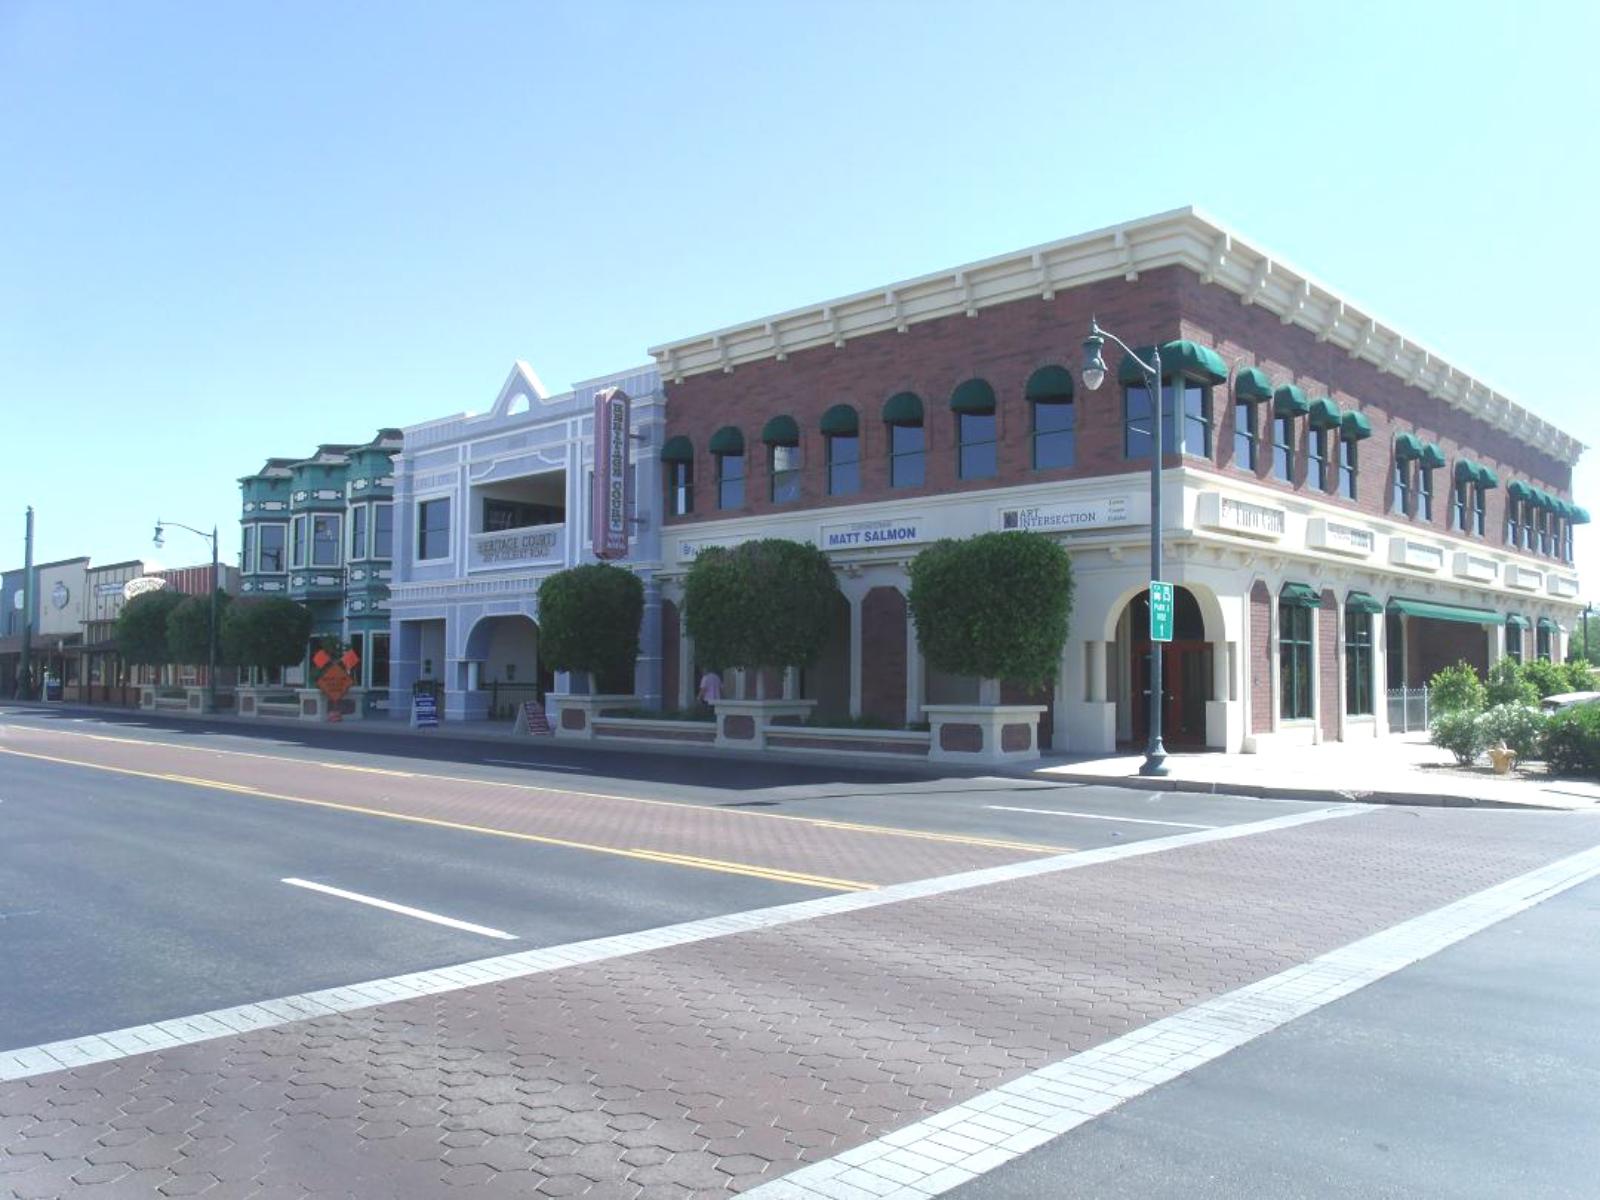
Gilbert has undergone one of the most dramatic transformations in Arizona over the last two decades, evolving from a quiet farming town into a thriving, master-planned suburban powerhouse. Located southeast of Phoenix, it consistently ranks among the best places to live in Arizona, thanks to top-rated public schools, abundant parks and trails, a walkable downtown, and excellent access to tech corridors and job centers in Chandler and Tempe. These qualities have helped fuel Gilbert’s housing boom, especially as families and professionals sought out larger homes and quieter neighborhoods during the pandemic. Its surge between 2020 and 2022 coincided with nationwide demand for suburban living, and Gilbert — with its established infrastructure and room to grow — was well-positioned to benefit.
Even as the market cooled in 2023 and again in 2025, Gilbert’s recovery in 2024 (+6.21%) indicates that demand has not disappeared, only normalized. New construction continues in parts of the town, but the pace has slowed, which helps support existing home values. The community remains especially attractive for buyers priced out of central Phoenix or Scottsdale but still looking for modern amenities and solid long-term appreciation. Though home values dipped slightly in the most recent year, the town’s fundamentals — strong schools, safety, and quality of life — remain firmly intact. Gilbert is expected to remain one of the most stable and desirable housing markets in the state, especially as Arizona continues to attract newcomers.
17. Anthem – 199% Home Price Increase Since 2011
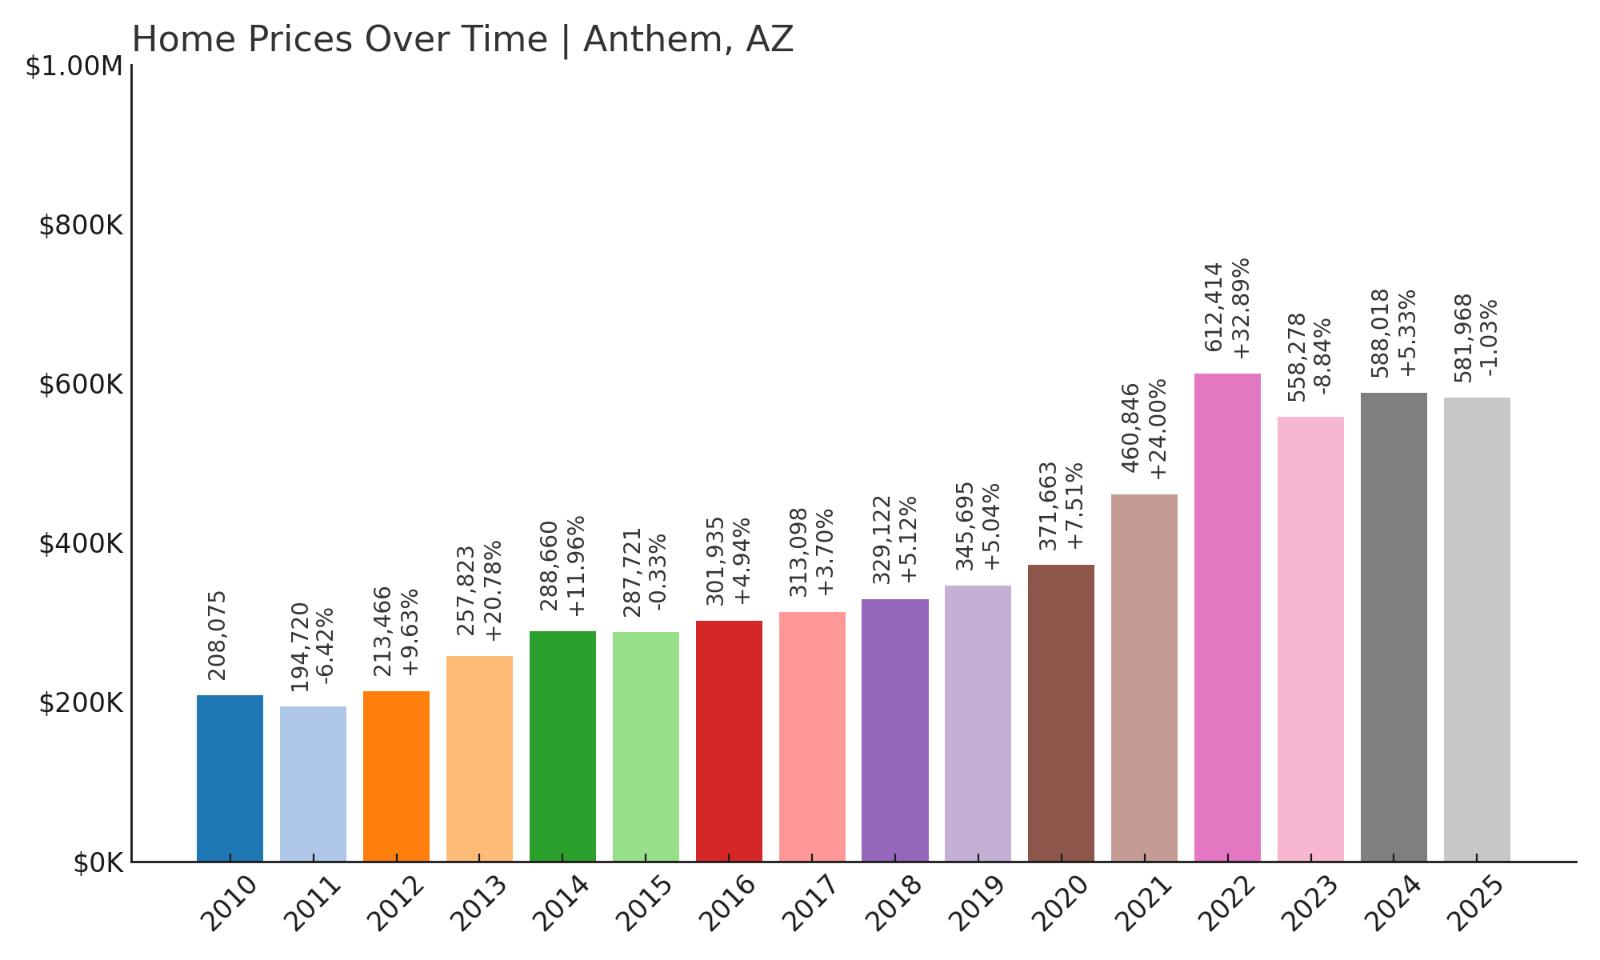
- 2010: $208,075
- 2011: $194,720 (-$13,354, -6.42% from previous year)
- 2012: $213,466 (+$18,746, +9.63% from previous year)
- 2013: $257,823 (+$44,357, +20.78% from previous year)
- 2014: $288,660 (+$30,837, +11.96% from previous year)
- 2015: $287,721 (-$939, -0.33% from previous year)
- 2016: $301,935 (+$14,214, +4.94% from previous year)
- 2017: $313,098 (+$11,163, +3.70% from previous year)
- 2018: $329,122 (+$16,024, +5.12% from previous year)
- 2019: $345,695 (+$16,573, +5.04% from previous year)
- 2020: $371,663 (+$25,968, +7.51% from previous year)
- 2021: $460,846 (+$89,183, +24.00% from previous year)
- 2022: $612,414 (+$151,568, +32.89% from previous year)
- 2023: $558,278 (-$54,137, -8.84% from previous year)
- 2024: $588,018 (+$29,740, +5.33% from previous year)
- 2025: $581,968 (-$6,050, -1.03% from previous year)
Anthem’s housing market has surged nearly 200% since its low point in 2011, climbing from $194,720 to $581,968 in 2025. The town saw steady, moderate growth until 2020, after which price increases accelerated dramatically — particularly in 2021 and 2022. The 32.89% leap in 2022 is one of the largest on this list. While values pulled back slightly in 2023 and 2025, the overall trend shows robust long-term appreciation. Anthem’s price history reveals a market that exploded during the pandemic boom but managed to retain most of those gains even after correction.
Anthem – A Master-Planned Success Story in the North Valley
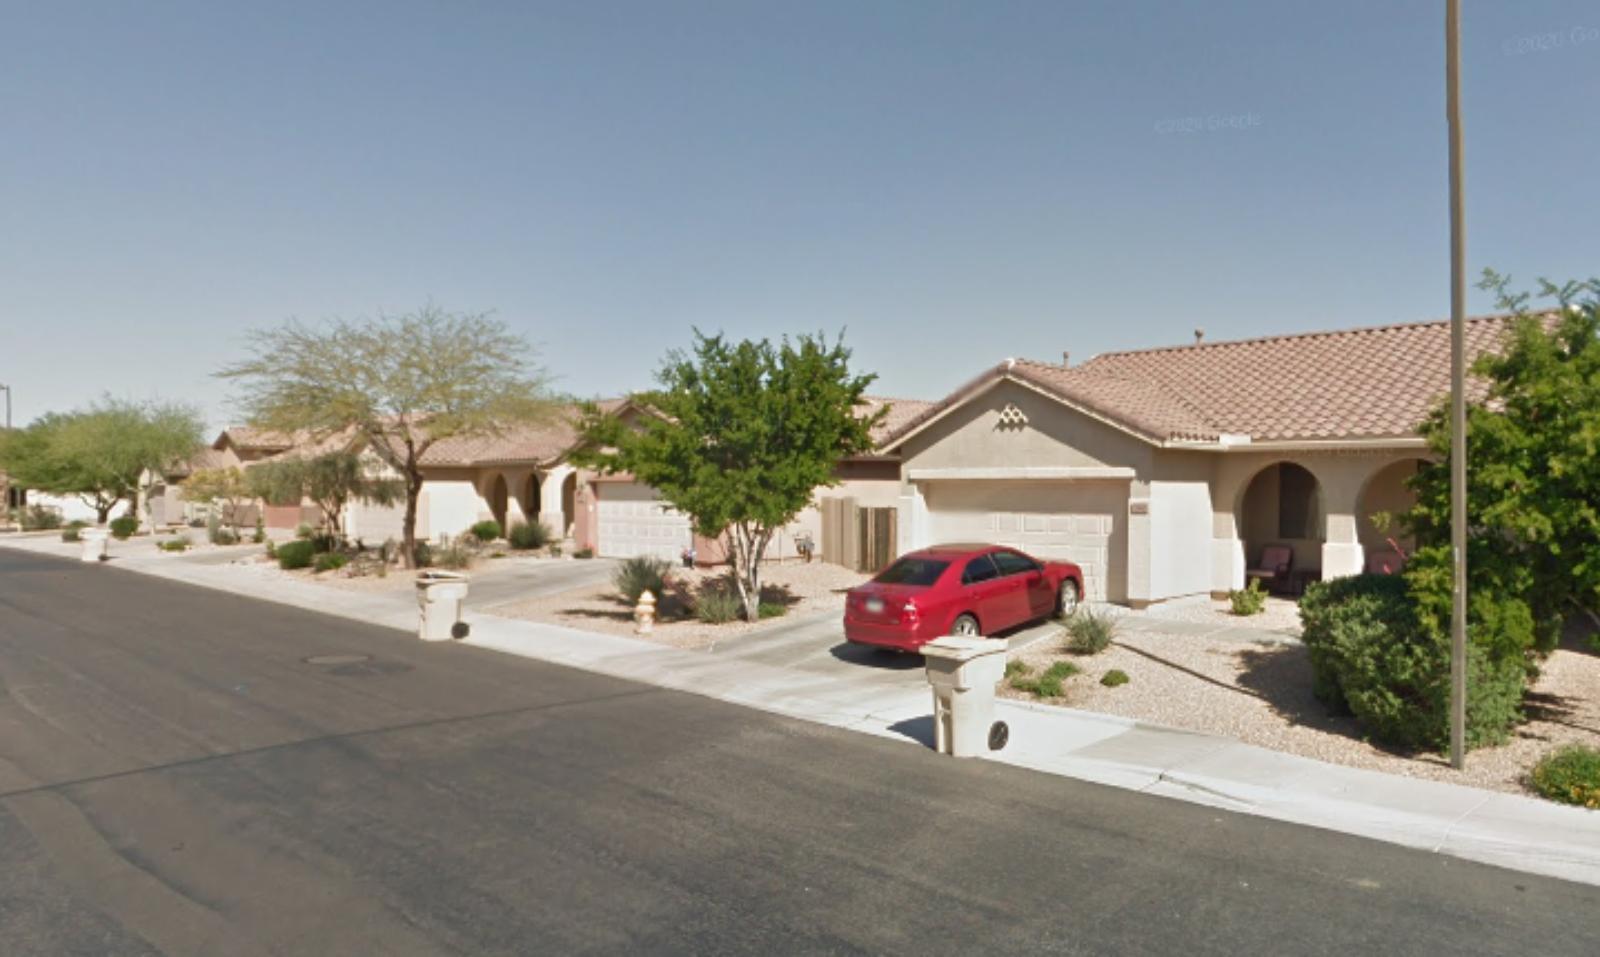
Anthem is a master-planned community located about 30 miles north of downtown Phoenix, developed with the intention of offering suburban living in a self-contained, well-managed setting. Known for its family-oriented environment, large community park, splash pads, and scenic trails, Anthem appeals to buyers seeking a blend of convenience and natural beauty. The town benefits from good freeway access via I-17, making it an ideal base for commuters who work in the Valley but prefer a quieter home setting. In recent years, its combination of amenities and affordability relative to Scottsdale or Paradise Valley has driven a new wave of demand, particularly during the pandemic years when remote work enabled more flexibility in location choice.
Anthem’s housing market reflects the migration trends that reshaped much of Arizona after 2020, when many buyers looked for space, stability, and master-planned convenience. The area’s sharp rise in 2022 was no fluke — it aligned with record-high inbound migration and a housing shortage in desirable suburbs. Despite a brief dip, the rebound in 2024 and near-flat 2025 figures show Anthem’s values remain firmly elevated. With its strong HOA structure, reliable infrastructure, and established reputation among families and retirees alike, Anthem continues to hold its place as one of Arizona’s most sought-after outer-ring communities.
16. Sonoita – 107% Home Price Increase Since 2011
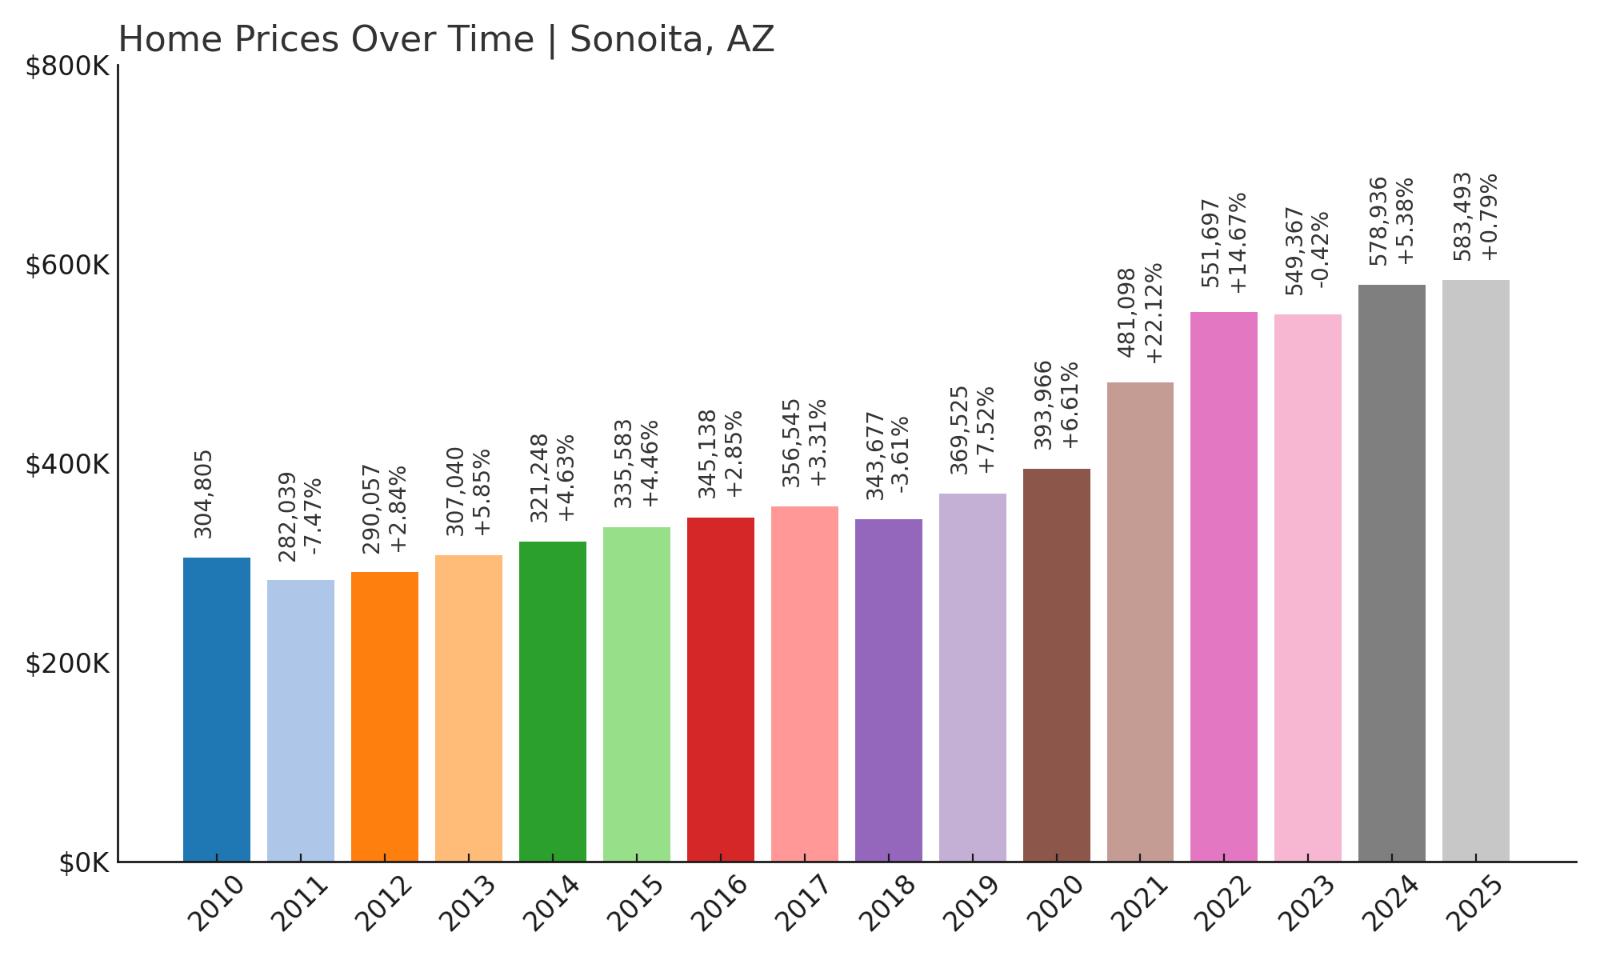
- 2010: $304,805
- 2011: $282,039 (-$22,766, -7.47% from previous year)
- 2012: $290,057 (+$8,019, +2.84% from previous year)
- 2013: $307,040 (+$16,983, +5.85% from previous year)
- 2014: $321,248 (+$14,208, +4.63% from previous year)
- 2015: $335,583 (+$14,335, +4.46% from previous year)
- 2016: $345,138 (+$9,555, +2.85% from previous year)
- 2017: $356,545 (+$11,407, +3.31% from previous year)
- 2018: $343,677 (-$12,867, -3.61% from previous year)
- 2019: $369,525 (+$25,847, +7.52% from previous year)
- 2020: $393,966 (+$24,441, +6.61% from previous year)
- 2021: $481,098 (+$87,132, +22.12% from previous year)
- 2022: $551,697 (+$70,599, +14.67% from previous year)
- 2023: $549,367 (-$2,330, -0.42% from previous year)
- 2024: $578,936 (+$29,570, +5.38% from previous year)
- 2025: $583,493 (+$4,557, +0.79% from previous year)
Sonoita’s home values have grown 107% since 2011, when they bottomed out at $282,039, reaching $583,493 in 2025. After relatively slow and steady growth in the early 2010s, prices began accelerating more significantly around 2020. The biggest single-year gain occurred in 2021, with a jump of over $87,000. Despite a minor dip in 2023, the market stabilized quickly, and 2024 and 2025 both delivered moderate gains. This pattern reflects a niche market with a loyal buyer base and relatively little new housing stock.
Sonoita – Wine Country Living in the Grasslands

Sonoita is unlike much of Arizona. Instead of desert or dense development, you’ll find rolling grasslands, sprawling ranches, and boutique wineries. Located in southern Arizona near the border of Santa Cruz and Cochise counties, Sonoita is known for its scenic beauty, wide-open skies, and increasingly, its growing reputation as a wine-producing region. These characteristics attract buyers seeking a more rural lifestyle, especially retirees and second-home owners who want land, quiet, and cool evening breezes. The town’s isolation — it’s about an hour southeast of Tucson — limits sprawl, which helps support higher property values over time.
Much of Sonoita’s price growth came after 2020, when remote work made it easier for buyers to choose lifestyle over proximity to offices. With no large-scale developments and a preference for large-acreage properties, inventory remains tight. That scarcity, combined with growing interest in the region’s wine and food scene, has put upward pressure on prices. Even during statewide slowdowns in 2023, Sonoita held firm. Modest gains in 2024 and 2025 suggest that the market remains healthy without being overheated. For buyers interested in rural charm with investment potential, Sonoita continues to offer a rare mix of natural beauty and strong price performance.
15. Munds Park – 211% Home Price Increase Since 2011
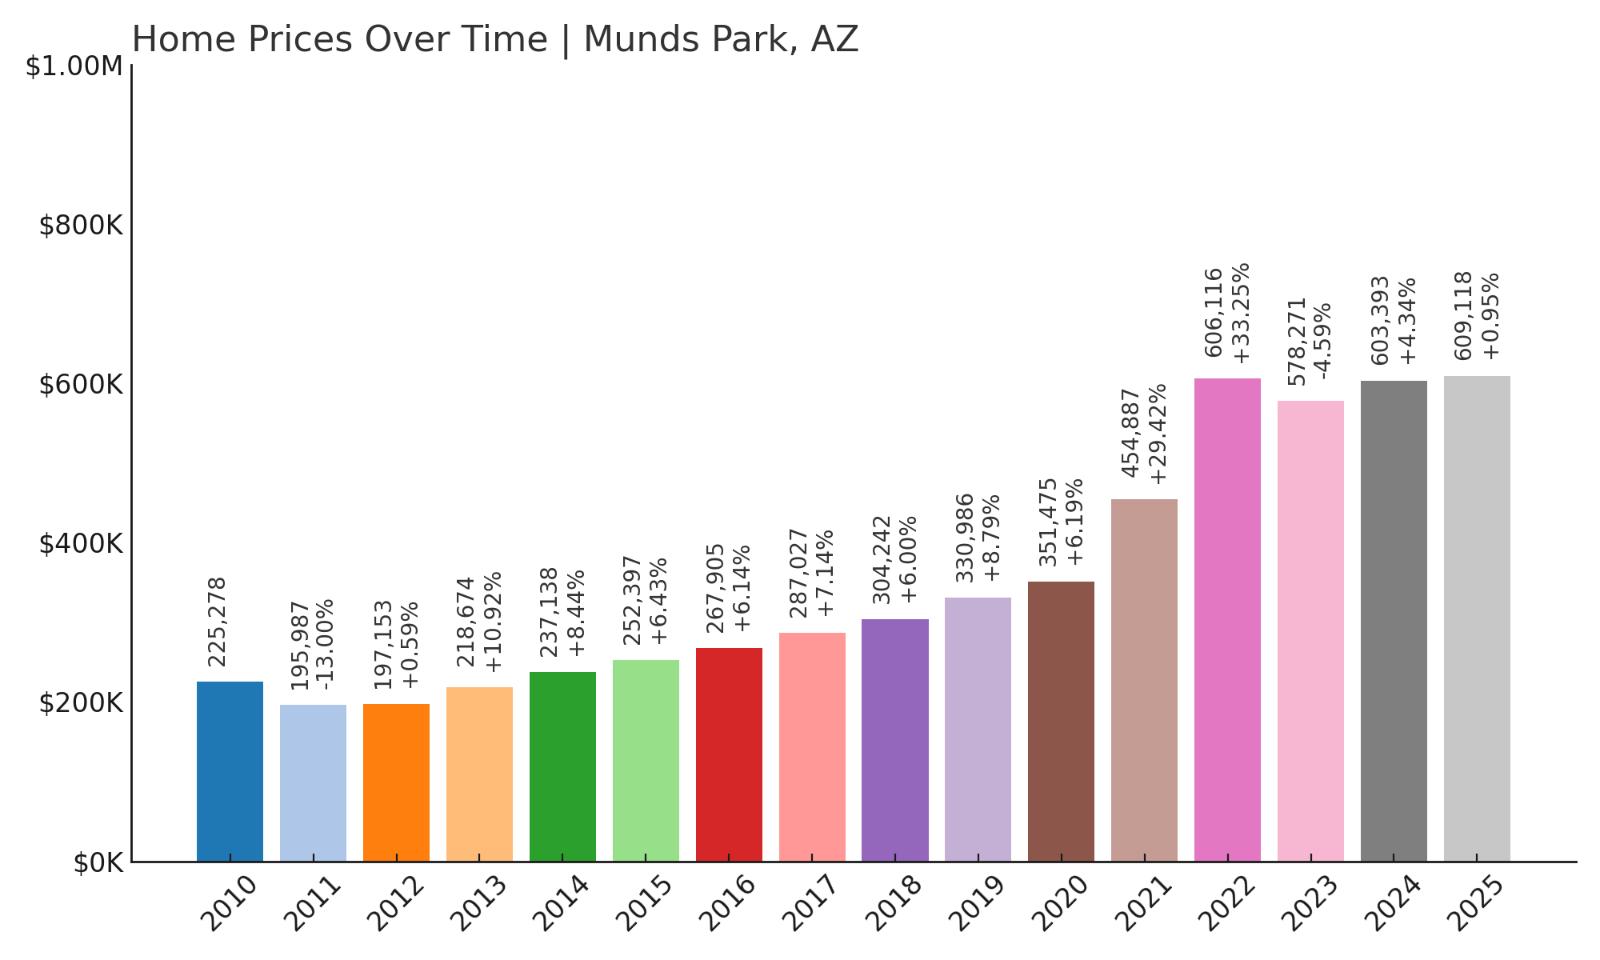
- 2010: $225,278
- 2011: $195,987 (-$29,291, -13.00% from previous year)
- 2012: $197,153 (+$1,165, +0.59% from previous year)
- 2013: $218,674 (+$21,521, +10.92% from previous year)
- 2014: $237,138 (+$18,465, +8.44% from previous year)
- 2015: $252,397 (+$15,259, +6.43% from previous year)
- 2016: $267,905 (+$15,507, +6.14% from previous year)
- 2017: $287,027 (+$19,123, +7.14% from previous year)
- 2018: $304,242 (+$17,215, +6.00% from previous year)
- 2019: $330,986 (+$26,744, +8.79% from previous year)
- 2020: $351,475 (+$20,488, +6.19% from previous year)
- 2021: $454,887 (+$103,412, +29.42% from previous year)
- 2022: $606,116 (+$151,229, +33.25% from previous year)
- 2023: $578,271 (-$27,845, -4.59% from previous year)
- 2024: $603,393 (+$25,122, +4.34% from previous year)
- 2025: $609,118 (+$5,725, +0.95% from previous year)
Munds Park’s real estate market has been on a steep climb since hitting $195,987 in 2011, rising to $609,118 by 2025 — a 211% increase. The town saw especially aggressive growth during 2021 and 2022, with two back-to-back jumps totaling over $254,000. Even though prices dipped slightly in 2023, the market quickly corrected and has continued upward. The consistency in appreciation prior to 2021 also shows that Munds Park was quietly gaining value long before the pandemic housing boom.
Munds Park – A Forested Retreat With Skyrocketing Prices

Munds Park sits just south of Flagstaff off I-17, surrounded by Coconino National Forest. It’s best known as a seasonal community, where many homes are used as summer cabins, weekend retreats, or vacation rentals. Its elevation of 6,500 feet makes it dramatically cooler than Phoenix, which draws buyers looking to escape the summer heat. With a strong short-term rental market and tight inventory, Munds Park has become a favorite among both investors and second-home seekers. The area’s pine forest setting, nearby hiking trails, and off-road recreation make it especially appealing to outdoor enthusiasts and retirees.
The massive price spikes in 2021 and 2022 were fueled by pandemic-era interest in rural getaways, and although there was a small correction in 2023, recovery was swift. The gains in 2024 and 2025 show that demand hasn’t vanished — it has simply stabilized. Munds Park remains a highly seasonal but in-demand market, where land is limited and new construction is slow. With its proximity to Flagstaff and access to cooler weather, the town continues to rank as one of Arizona’s most desirable mountain communities.
14. Prescott – 169% Home Price Increase Since 2011
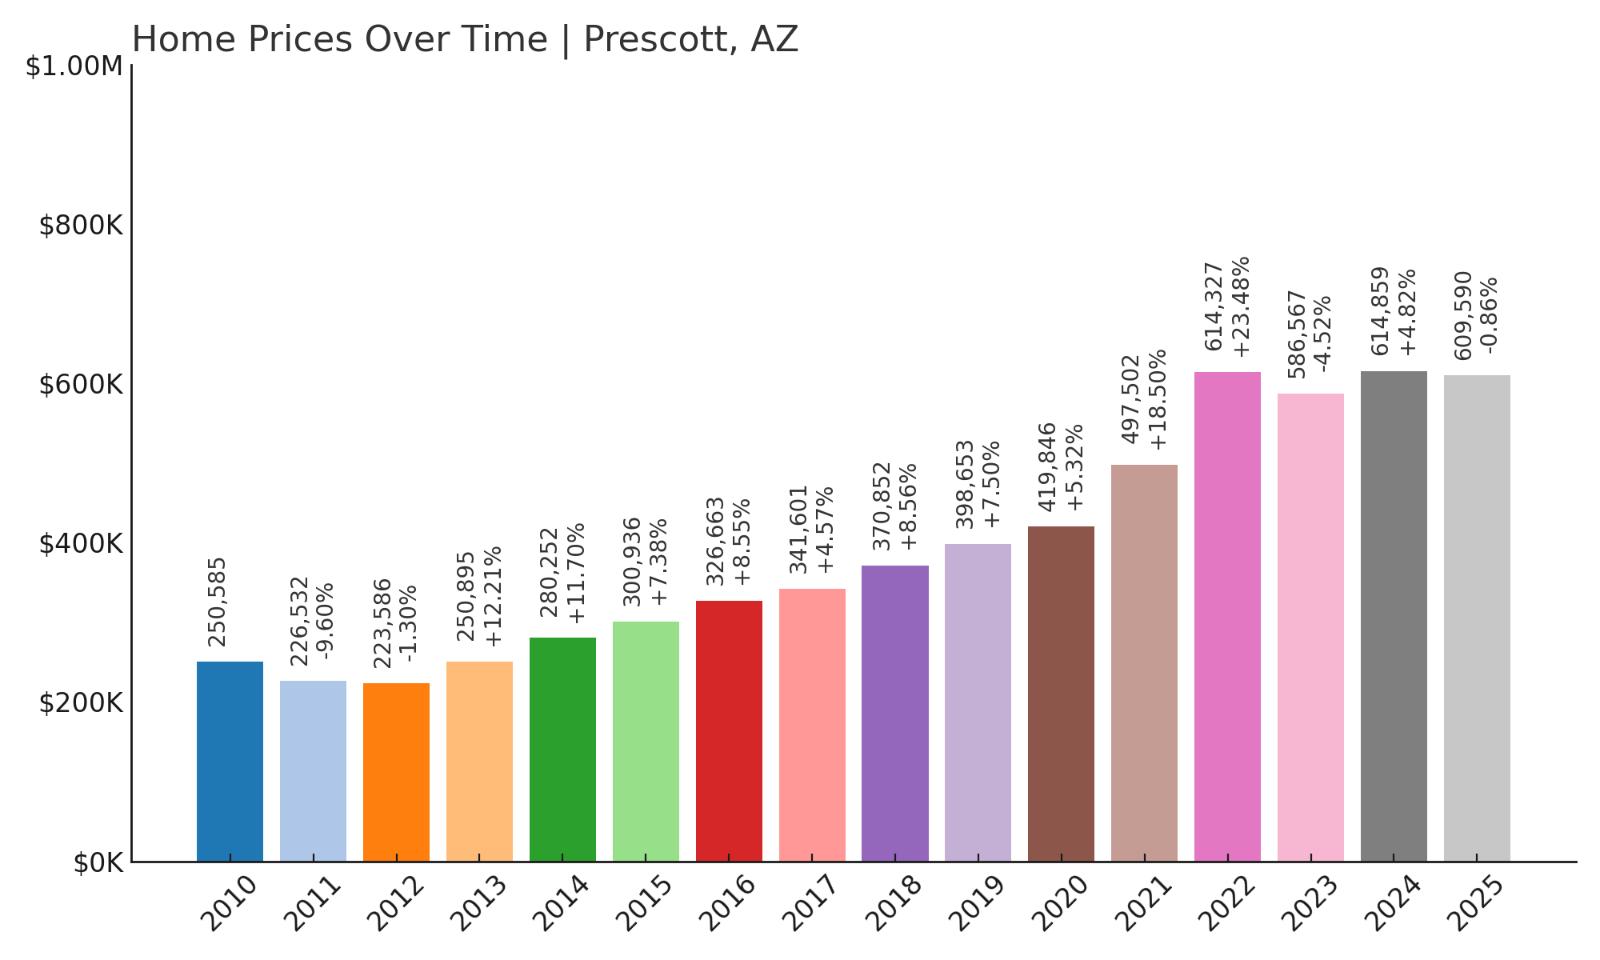
- 2010: $250,585
- 2011: $226,532 (-$24,053, -9.60% from previous year)
- 2012: $223,586 (-$2,946, -1.30% from previous year)
- 2013: $250,895 (+$27,309, +12.21% from previous year)
- 2014: $280,252 (+$29,358, +11.70% from previous year)
- 2015: $300,936 (+$20,683, +7.38% from previous year)
- 2016: $326,663 (+$25,727, +8.55% from previous year)
- 2017: $341,601 (+$14,938, +4.57% from previous year)
- 2018: $370,852 (+$29,251, +8.56% from previous year)
- 2019: $398,653 (+$27,801, +7.50% from previous year)
- 2020: $419,846 (+$21,193, +5.32% from previous year)
- 2021: $497,502 (+$77,655, +18.50% from previous year)
- 2022: $614,327 (+$116,826, +23.48% from previous year)
- 2023: $586,567 (-$27,760, -4.52% from previous year)
- 2024: $614,859 (+$28,291, +4.82% from previous year)
- 2025: $609,590 (-$5,269, -0.86% from previous year)
Prescott’s housing market has appreciated significantly over the past 14 years, rising from a low of $226,532 in 2011 to $609,590 in 2025 — an increase of 169%. The city experienced a steady climb throughout the 2010s, with especially sharp spikes beginning in 2020. Home values jumped 18.5% in 2021 and another 23.48% in 2022, reflecting major pandemic-era demand. While a slight cooling occurred in 2023 and again in 2025, overall home values remain near historic highs. The fact that Prescott maintained gains through minor corrections suggests long-term confidence in the area as both a retirement destination and year-round community.
Prescott – Historic Charm and High Demand in the Central Highlands
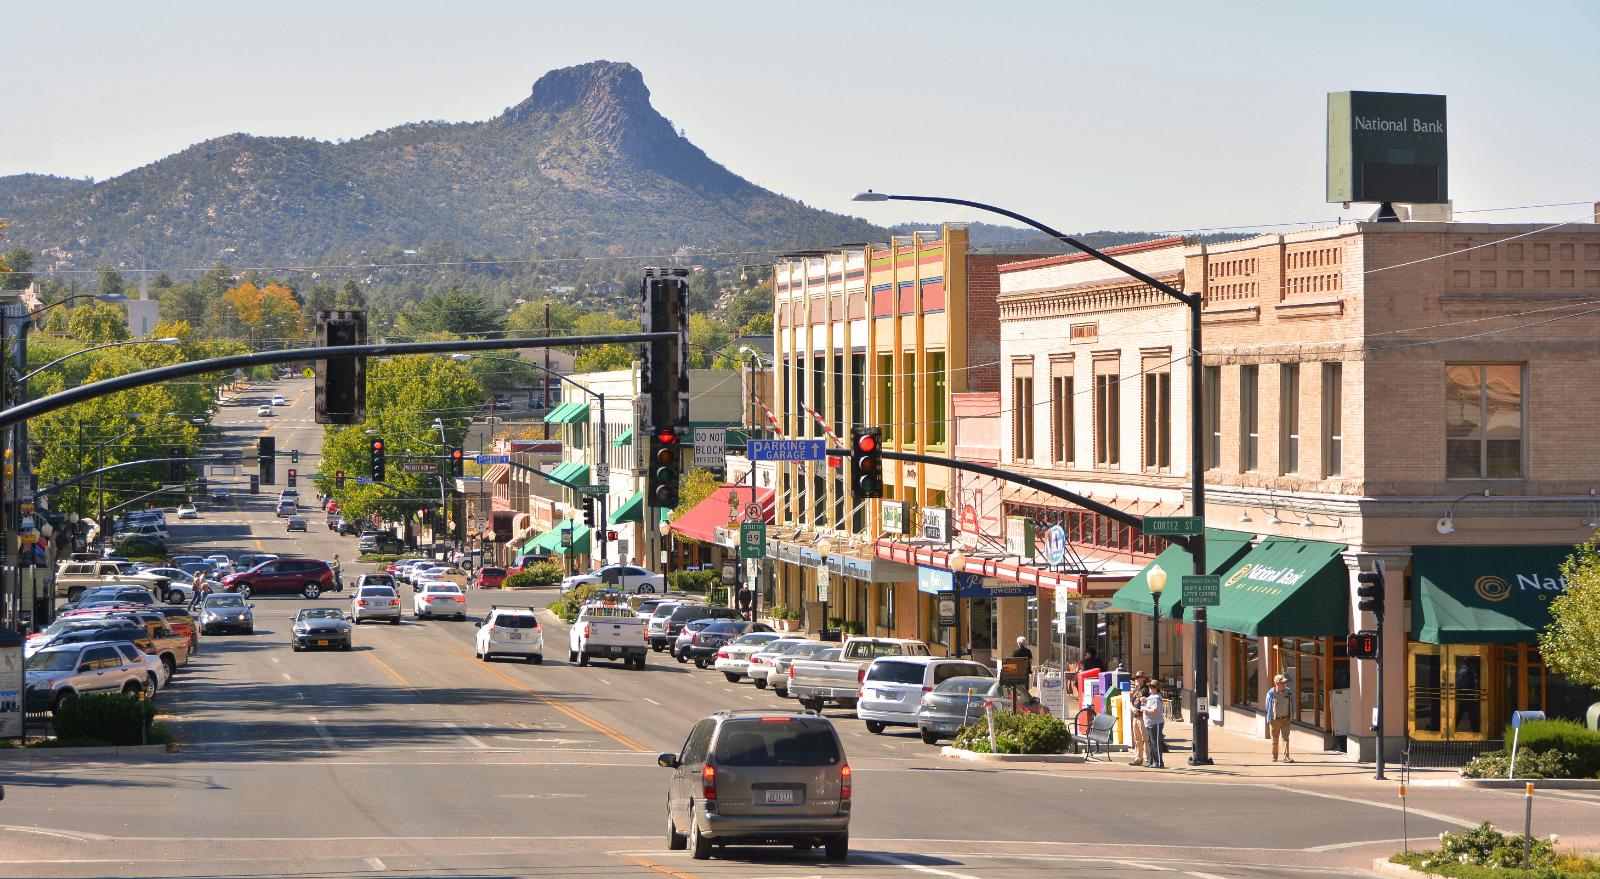
Prescott is one of Arizona’s oldest and most culturally significant towns, known for its preserved downtown, frontier history, and natural beauty. Located in the state’s central highlands about 100 miles north of Phoenix, Prescott offers a four-season climate that sets it apart from the Sonoran Desert cities. Its mild summers and cool winters have made it a top retirement destination, but its growing population also includes families, remote workers, and professionals seeking a more relaxed pace of life without sacrificing amenities. The historic Whiskey Row district, Victorian-era homes, and proximity to national forest trails and lakes give the town unique character and strong lifestyle appeal. Combined with a limited housing supply — due in part to geographic constraints and preservation efforts — these factors create a real estate environment where prices are naturally pressured upward.
Much of Prescott’s explosive growth between 2020 and 2022 can be traced to increased migration from out-of-state buyers, particularly from California, as well as Phoenix residents looking to escape the summer heat without leaving Arizona entirely. This surge in demand pushed home prices into new territory, and even with small declines in 2023 and 2025, the market has held steady. Housing developments have expanded slightly on the town’s outskirts, but the city’s core remains tightly zoned, limiting sprawl and keeping land values high. The revival of downtown areas and investment in walkability have further enhanced Prescott’s livability. With its combination of outdoor recreation, historical significance, and manageable size, Prescott continues to be a rare blend of small-town charm and big-time market value — a dynamic that keeps buyers and investors interested year after year.
13. Tortolita – 95% Home Price Increase Since 2012
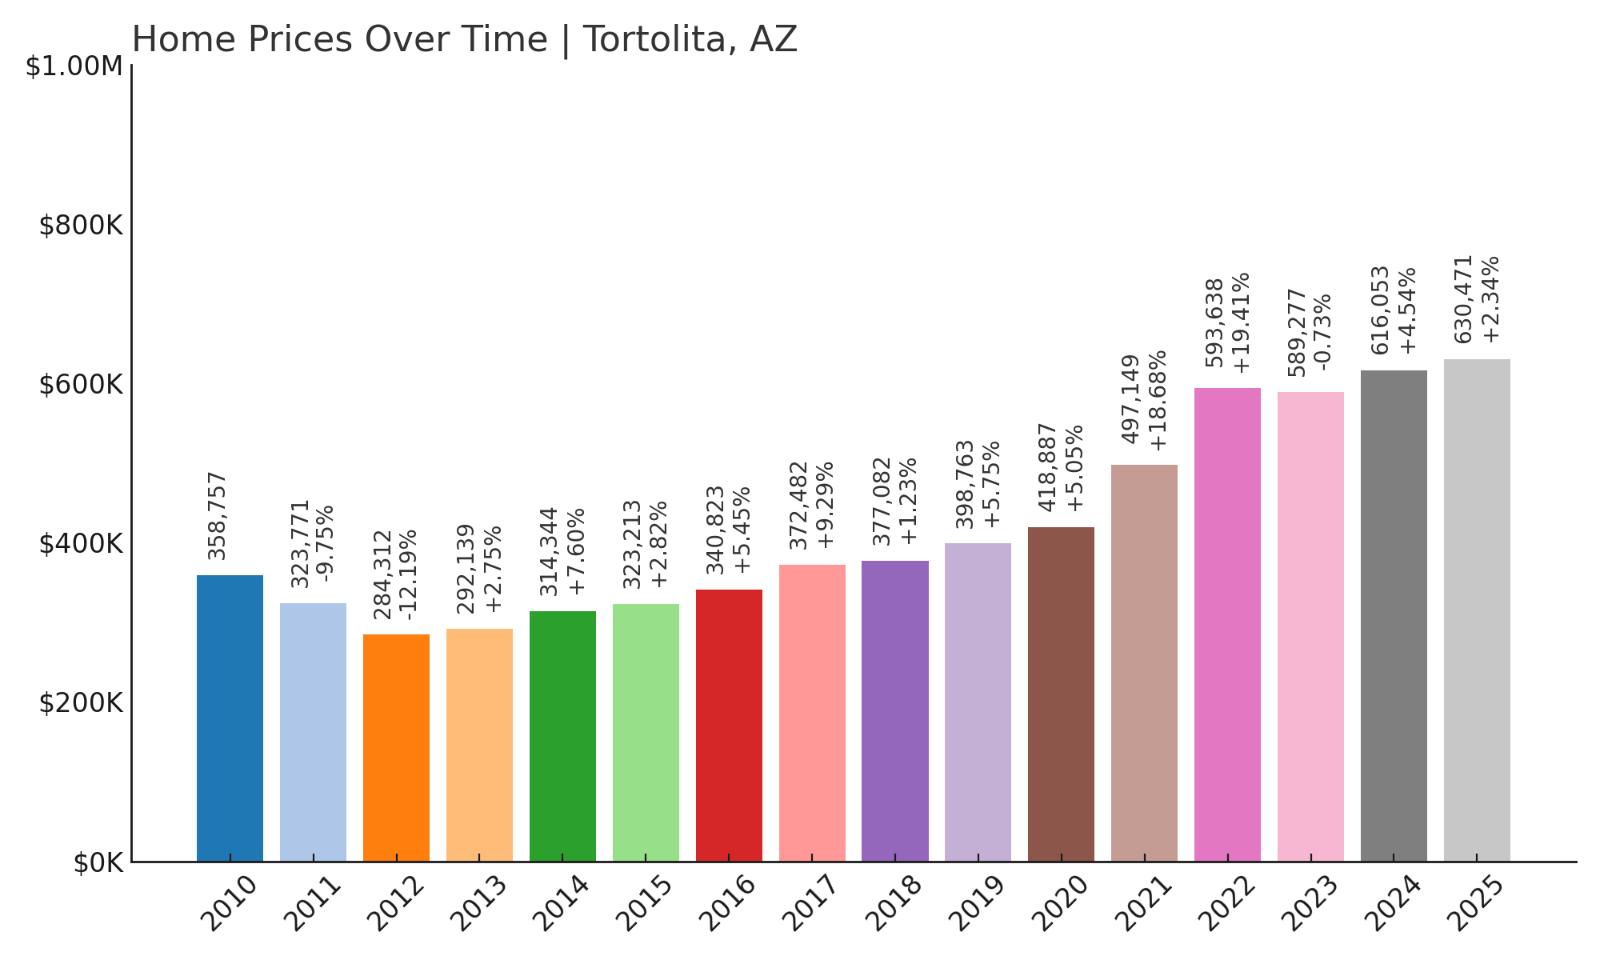
- 2010: $358,757
- 2011: $323,771 (-$34,986, -9.75% from previous year)
- 2012: $284,312 (-$39,459, -12.19% from previous year)
- 2013: $292,139 (+$7,827, +2.75% from previous year)
- 2014: $314,344 (+$22,205, +7.60% from previous year)
- 2015: $323,213 (+$8,869, +2.82% from previous year)
- 2016: $340,823 (+$17,610, +5.45% from previous year)
- 2017: $372,482 (+$31,659, +9.29% from previous year)
- 2018: $377,082 (+$4,600, +1.23% from previous year)
- 2019: $398,763 (+$21,681, +5.75% from previous year)
- 2020: $418,887 (+$20,124, +5.05% from previous year)
- 2021: $497,149 (+$78,263, +18.68% from previous year)
- 2022: $593,638 (+$96,489, +19.41% from previous year)
- 2023: $589,277 (-$4,362, -0.73% from previous year)
- 2024: $616,053 (+$26,776, +4.54% from previous year)
- 2025: $630,471 (+$14,419, +2.34% from previous year)
Tortolita’s housing market climbed from a low of $284,312 in 2012 to $630,471 in 2025, representing a 95% increase over that time. The market saw particularly rapid appreciation from 2020 to 2022, including two consecutive years of double-digit growth. While 2023 brought a slight pullback, the recovery in 2024 and 2025 suggests continued interest and stability. Home prices have more than doubled from their post-recession lows, and while growth has slowed, Tortolita remains firmly in Arizona’s top tier for price points and long-term strength.
Tortolita – Quiet Luxury North of Tucson

Tortolita is a semi-rural community located northwest of Tucson, tucked between the Catalina Foothills and the edge of the Sonoran Desert. It’s known for wide open lots, custom homes, and stunning mountain views. Many properties in the area feature modern Southwest architecture, expansive acreage, and private amenities such as pools and horse facilities. Despite its proximity to Tucson, Tortolita maintains a low-density, semi-private feel that appeals to buyers looking for both space and convenience. The town has benefited from the northward growth of Tucson’s housing market, as more affluent buyers seek upscale options outside the city’s core. This combination of exclusivity, natural surroundings, and access to services makes it a strong draw for retirees and professionals alike.
Much of Tortolita’s recent price growth reflects larger trends in Arizona’s exurban luxury markets, which saw a surge of demand between 2020 and 2022. Its 19.41% jump in 2022 marked the peak of that demand wave, likely driven by remote workers and retirees fleeing higher-cost markets like California. Although prices briefly dipped in 2023, the area quickly rebounded, showing strong buyer confidence. The lack of high-density development helps maintain home values and protects the area’s quiet character, while nearby amenities in Marana and Oro Valley provide convenience. As Tucson’s northwest corridor continues to expand, Tortolita’s blend of luxury and privacy ensures it stays near the top of Arizona’s most expensive markets.
12. Queen Creek – 246% Home Price Increase Since 2011
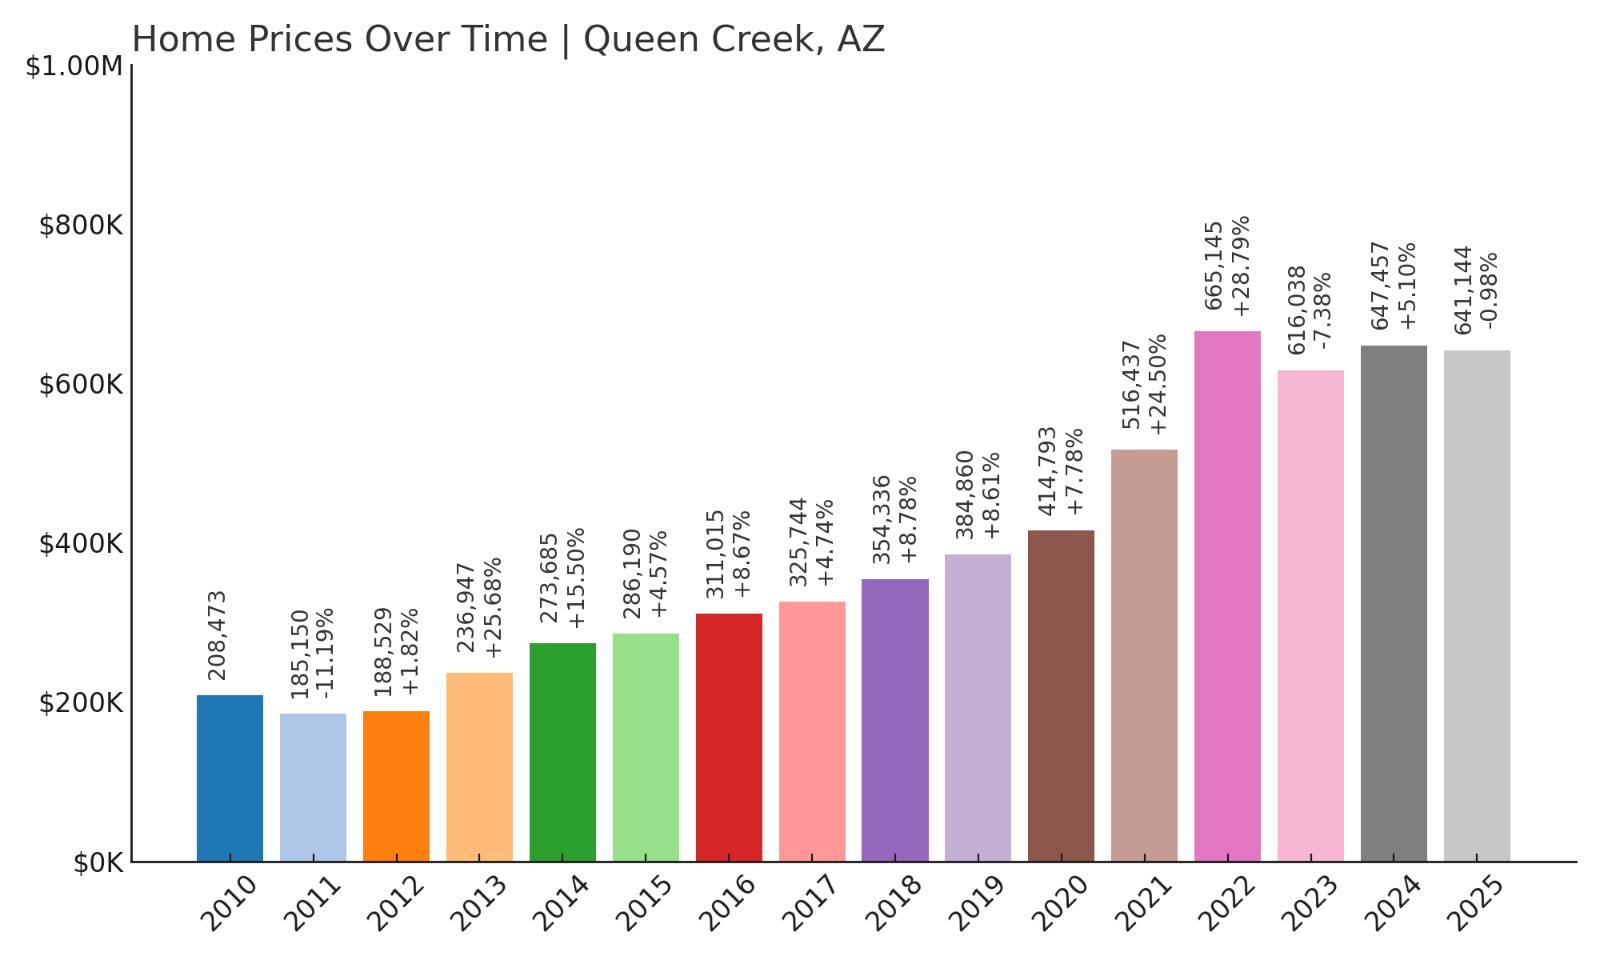
- 2010: $208,473
- 2011: $185,150 (-$23,322, -11.19% from previous year)
- 2012: $188,529 (+$3,378, +1.82% from previous year)
- 2013: $236,947 (+$48,419, +25.68% from previous year)
- 2014: $273,685 (+$36,737, +15.50% from previous year)
- 2015: $286,190 (+$12,505, +4.57% from previous year)
- 2016: $311,015 (+$24,825, +8.67% from previous year)
- 2017: $325,744 (+$14,729, +4.74% from previous year)
- 2018: $354,336 (+$28,593, +8.78% from previous year)
- 2019: $384,860 (+$30,524, +8.61% from previous year)
- 2020: $414,793 (+$29,933, +7.78% from previous year)
- 2021: $516,437 (+$101,643, +24.50% from previous year)
- 2022: $665,145 (+$148,708, +28.79% from previous year)
- 2023: $616,038 (-$49,107, -7.38% from previous year)
- 2024: $647,457 (+$31,419, +5.10% from previous year)
- 2025: $641,144 (-$6,313, -0.98% from previous year)
Home prices in Queen Creek have skyrocketed since 2011, jumping from $185,150 to $641,144 — a staggering 246% increase. This east Valley town saw particularly strong appreciation from 2020 through 2022, with two straight years of massive double-digit gains. Even after a brief price dip in 2023 and a small drop in 2025, values remain near their peak, showing the market’s ability to stabilize after intense growth. With its blend of suburban appeal, room to grow, and access to Phoenix, Queen Creek has become one of the most dynamic housing markets in Arizona.
Queen Creek – From Farmland to Hot Housing Frontier
Queen Creek has rapidly transformed from an agricultural community into one of the fastest-growing towns in the Phoenix metro area. Located southeast of the urban core, it offers a mix of large-lot homes, new subdivisions, and custom estates — all at price points that were once considered affordable but now push the upper end of the suburban market. The town’s growth has been fueled by strong school districts, investments in infrastructure, and a wave of new residents looking for space and modern amenities without the costs of central Scottsdale or Tempe. Major retailers, restaurants, and entertainment venues have followed the population boom, making Queen Creek a self-contained hub in its own right.
The housing boom from 2020 to 2022 brought an unprecedented surge in values, as demand outpaced supply and new construction struggled to keep up. Queen Creek’s 28.79% gain in 2022 alone was one of the most dramatic in the state. Although prices corrected slightly in the years that followed, they remain high by historical standards, with many neighborhoods still seeing bidding wars for well-located properties. Developers continue to invest in the area, but available land is starting to tighten, and building costs have risen. As more employers consider relocating to the Southeast Valley and as transportation access improves, Queen Creek is expected to remain one of the state’s most closely watched real estate markets.
11. Parks – 185% Home Price Increase Since 2012
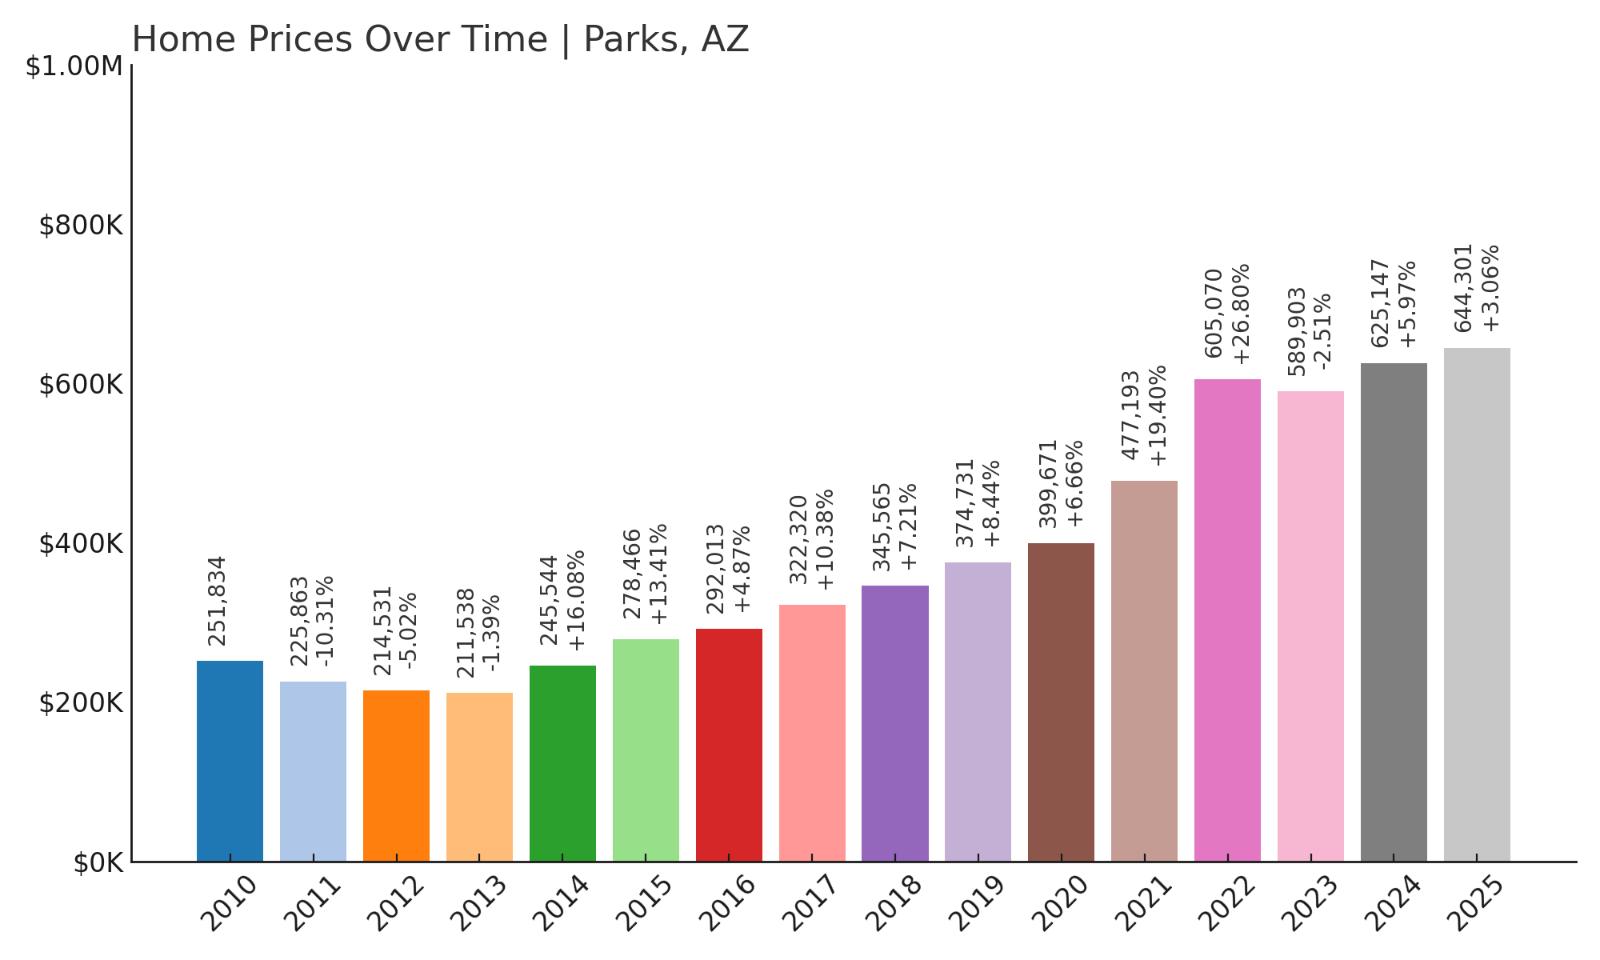
- 2010: $251,834
- 2011: $225,863 (-$25,971, -10.31% from previous year)
- 2012: $214,531 (-$11,333, -5.02% from previous year)
- 2013: $211,538 (-$2,993, -1.39% from previous year)
- 2014: $245,544 (+$34,006, +16.08% from previous year)
- 2015: $278,466 (+$32,922, +13.41% from previous year)
- 2016: $292,013 (+$13,548, +4.87% from previous year)
- 2017: $322,320 (+$30,307, +10.38% from previous year)
- 2018: $345,565 (+$23,244, +7.21% from previous year)
- 2019: $374,731 (+$29,166, +8.44% from previous year)
- 2020: $399,671 (+$24,941, +6.66% from previous year)
- 2021: $477,193 (+$77,522, +19.40% from previous year)
- 2022: $605,070 (+$127,877, +26.80% from previous year)
- 2023: $589,903 (-$15,167, -2.51% from previous year)
- 2024: $625,147 (+$35,244, +5.97% from previous year)
- 2025: $644,301 (+$19,154, +3.06% from previous year)
Parks saw its home values rise from just $214,531 in 2012 to $644,301 by 2025, marking a total increase of 185%. This small northern Arizona community saw the most explosive gains from 2020 through 2022, with a stunning 26.8% increase in 2022 alone. Although prices cooled briefly in 2023, strong rebounds in the two years following helped push the market to new highs. Parks remains one of the most sought-after rural destinations in the state for buyers who want access to nature, forest views, and a slower pace of life without sacrificing value growth.
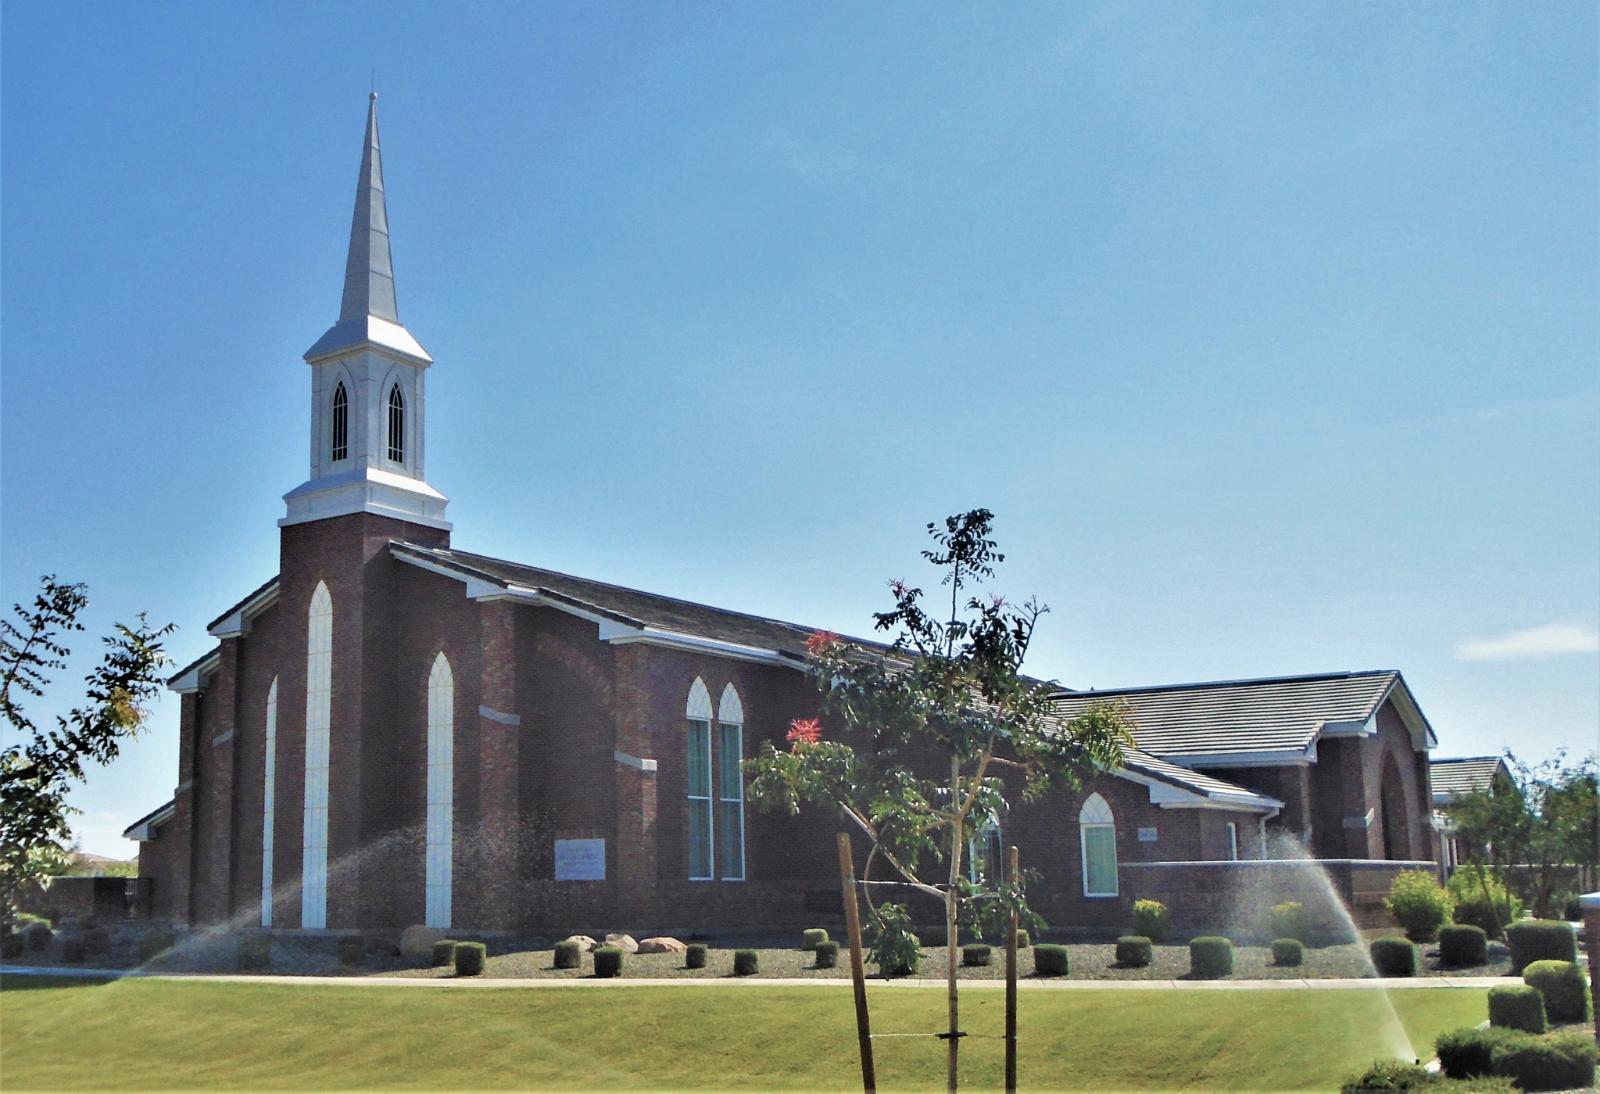
Parks – High Altitude Homes Near Flagstaff
Parks is a small community located between Flagstaff and Williams along I-40, surrounded by the Coconino National Forest. It’s known for tall pines, cool temperatures, and its position just far enough from Flagstaff to feel secluded, yet close enough for convenience. The area features a mix of rustic cabins, custom homes, and off-grid properties, many of which sit on multi-acre parcels. For buyers priced out of Flagstaff but still wanting the high-elevation mountain lifestyle, Parks offers a compelling alternative. It’s especially popular among seasonal residents, second-home buyers, and investors in the short-term rental market, where demand spikes during summer months when the Phoenix metro bakes in triple digits.
Home values in Parks surged during the pandemic as buyers flocked to rural locations, and the momentum continued well into 2022. Even after a small dip in 2023, the area bounced back quickly — evidence of just how limited the inventory is and how persistent demand has become. The recent gains in 2024 and 2025 show that the market has not only stabilized but is once again appreciating. With limited developable land and a growing reputation as a premium retreat zone, Parks is now firmly positioned among Arizona’s most expensive rural housing markets. For those looking to invest in natural beauty and future potential, it continues to deliver both.
10. Flagstaff – 190% Home Price Increase Since 2012
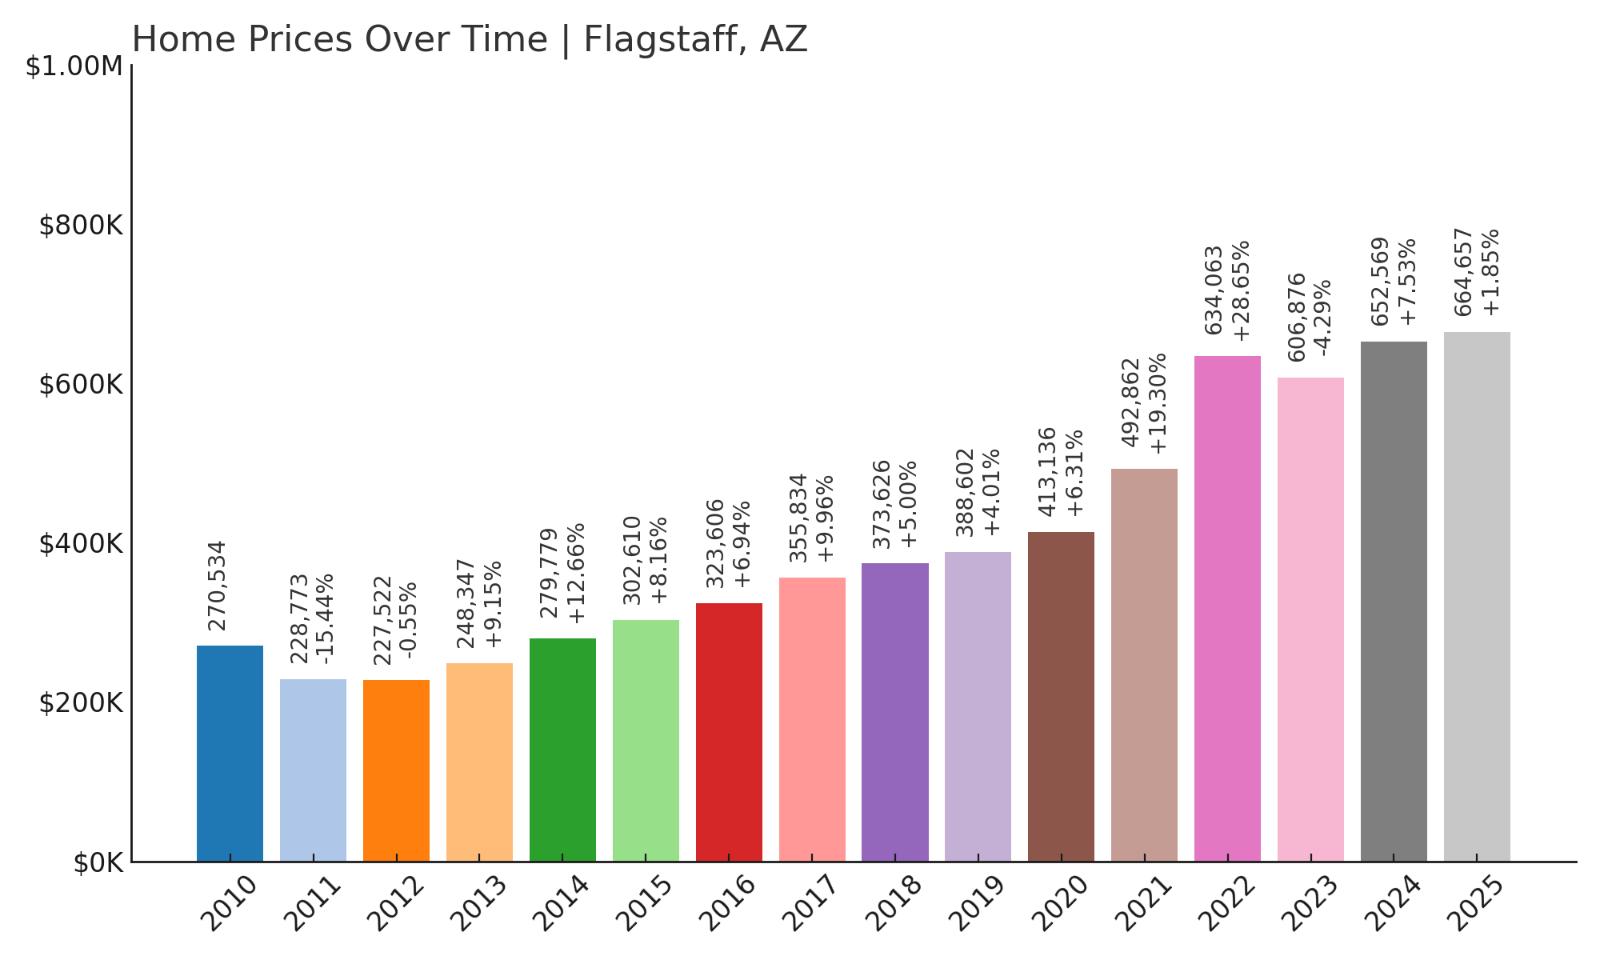
- 2010: $270,534
- 2011: $228,773 (-$41,761, -15.44% from previous year)
- 2012: $227,522 (-$1,251, -0.55% from previous year)
- 2013: $248,347 (+$20,825, +9.15% from previous year)
- 2014: $279,779 (+$31,432, +12.66% from previous year)
- 2015: $302,610 (+$22,832, +8.16% from previous year)
- 2016: $323,606 (+$20,996, +6.94% from previous year)
- 2017: $355,834 (+$32,228, +9.96% from previous year)
- 2018: $373,626 (+$17,792, +5.00% from previous year)
- 2019: $388,602 (+$14,976, +4.01% from previous year)
- 2020: $413,136 (+$24,534, +6.31% from previous year)
- 2021: $492,862 (+$79,726, +19.30% from previous year)
- 2022: $634,063 (+$141,202, +28.65% from previous year)
- 2023: $606,876 (-$27,188, -4.29% from previous year)
- 2024: $652,569 (+$45,693, +7.53% from previous year)
- 2025: $664,657 (+$12,088, +1.85% from previous year)
Flagstaff’s housing market has grown dramatically since hitting $227,522 in 2012, reaching $664,657 in 2025 — an increase of 190%. While price growth was steady throughout the 2010s, it sharply accelerated beginning in 2020 and peaked in 2022 with a remarkable 28.65% surge. Even though values dipped slightly in 2023, the market quickly recovered, with two back-to-back gains bringing prices to a new high. The numbers show that Flagstaff remains one of Arizona’s most resilient and in-demand housing markets.
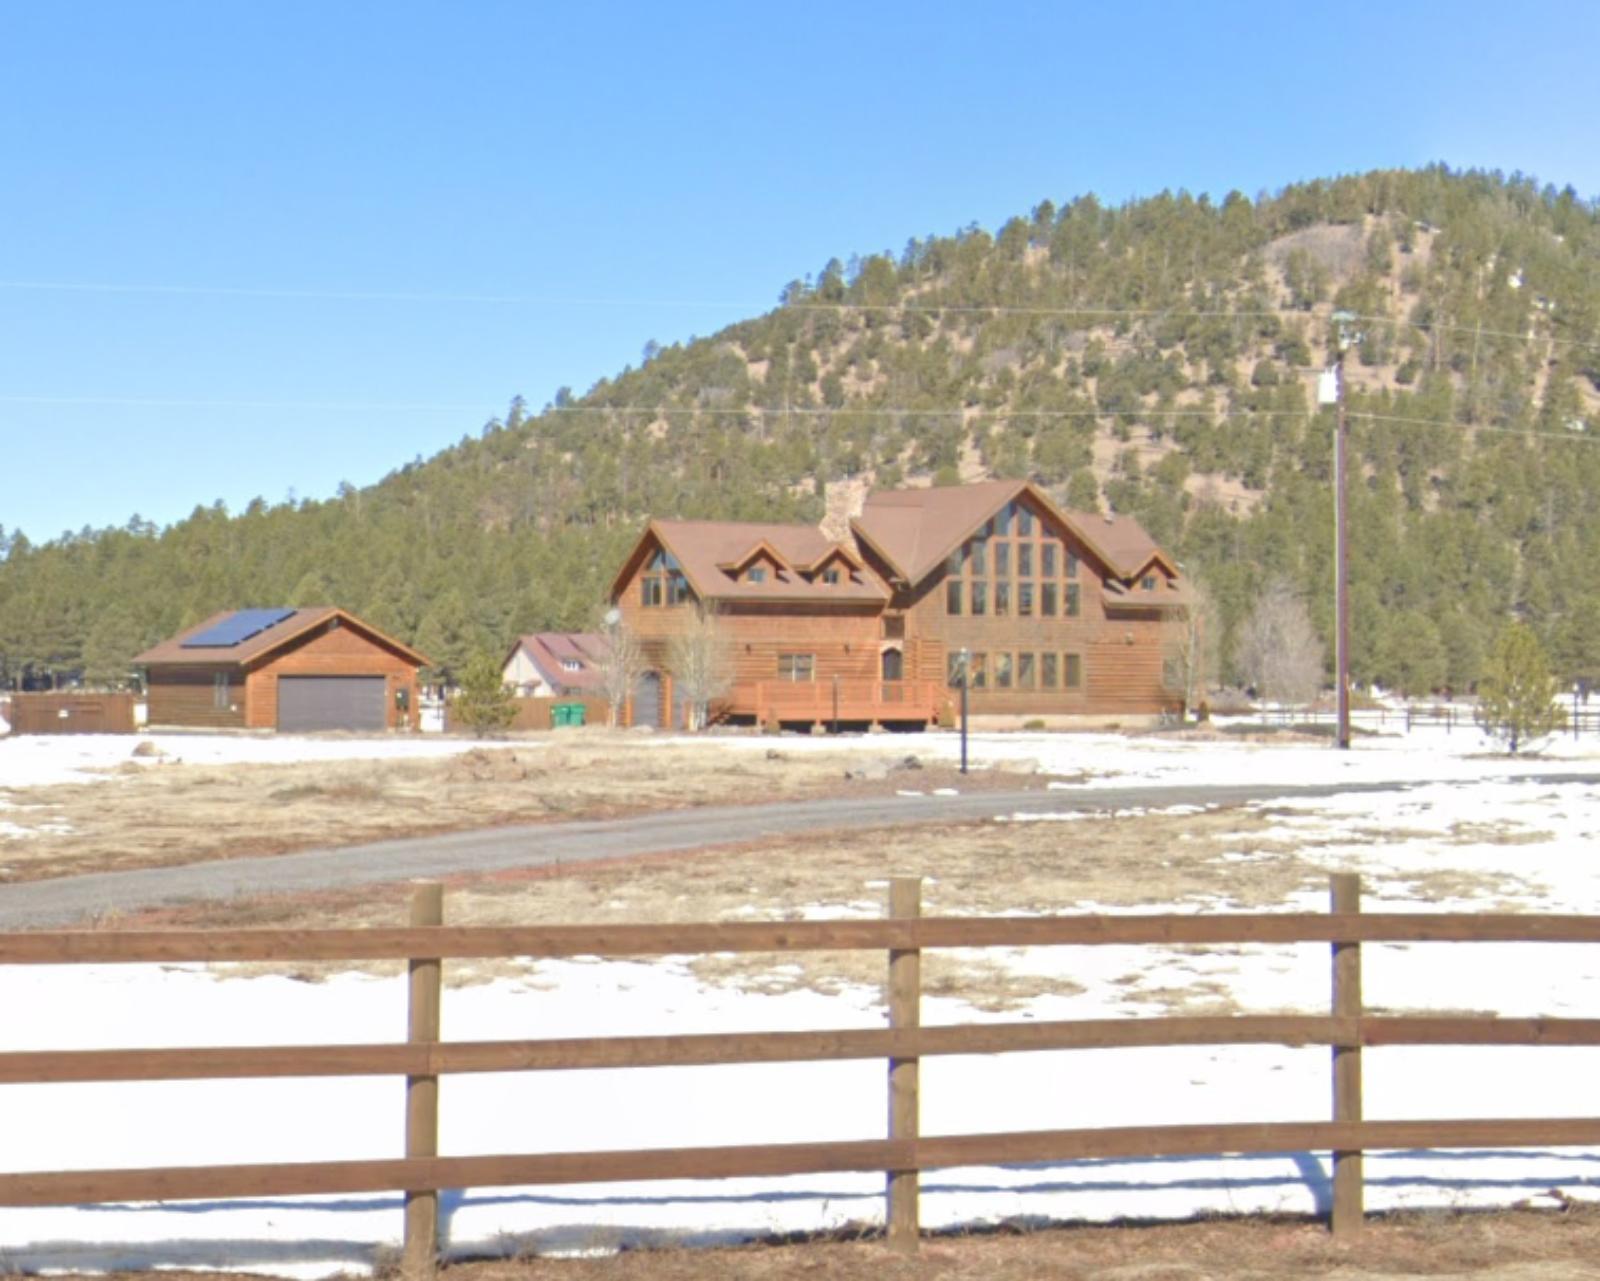
Flagstaff – Cool Climate, Strong Demand, Limited Supply
Flagstaff is a unique outlier in Arizona’s real estate landscape. Located at 7,000 feet above sea level and surrounded by the Coconino National Forest, it offers a cooler, alpine environment that’s wildly popular with both full-time residents and seasonal homeowners. The city is home to Northern Arizona University, a vibrant arts and culture scene, and proximity to destinations like Sedona, the Grand Canyon, and numerous ski and hiking trails. These natural and lifestyle amenities have helped sustain year-round demand for housing, even as many other markets cooled in recent years. New construction is constrained by surrounding public lands and environmental regulations, which keeps supply tight and competition high.
The surge in home values from 2020 to 2022 mirrors trends across most high-demand mountain towns in the western U.S., with remote work playing a major role in attracting wealthier buyers from Phoenix, California, and beyond. While 2023 saw a minor correction, the market quickly bounced back with a 7.53% gain in 2024 and continued growth in 2025. Despite its higher price tag, Flagstaff remains attractive due to its strong rental market, limited inventory, and growing economic base. As Arizona’s go-to four-season city, Flagstaff continues to combine lifestyle appeal with reliable long-term appreciation — a rare combination in the current housing environment.
9. Fountain Hills – 147% Home Price Increase Since 2012

- 2010: $306,938
- 2011: $272,597 (-$34,341, -11.19% from previous year)
- 2012: $278,249 (+$5,652, +2.07% from previous year)
- 2013: $331,995 (+$53,746, +19.32% from previous year)
- 2014: $364,113 (+$32,117, +9.67% from previous year)
- 2015: $365,135 (+$1,022, +0.28% from previous year)
- 2016: $378,017 (+$12,882, +3.53% from previous year)
- 2017: $383,839 (+$5,822, +1.54% from previous year)
- 2018: $400,155 (+$16,317, +4.25% from previous year)
- 2019: $420,220 (+$20,064, +5.01% from previous year)
- 2020: $450,968 (+$30,748, +7.32% from previous year)
- 2021: $536,785 (+$85,817, +19.03% from previous year)
- 2022: $682,957 (+$146,172, +27.23% from previous year)
- 2023: $638,267 (-$44,690, -6.54% from previous year)
- 2024: $674,346 (+$36,079, +5.65% from previous year)
- 2025: $673,808 (-$537, -0.08% from previous year)
Fountain Hills’ home values rose from $278,249 in 2012 to $673,808 in 2025 — a gain of 147%. Though the market experienced a sharp correction in 2023, the prior two years had record-setting increases, especially in 2022, when prices surged by over 27%. While 2025 ended mostly flat, the town remains one of Arizona’s most expensive and desirable enclaves, bolstered by sustained demand for its views, exclusivity, and quiet suburban feel.
Fountain Hills – Desert Views and High-End Homes

Fountain Hills, located northeast of Scottsdale, is known for its panoramic mountain and desert views, custom homes, and the iconic fountain that gave the town its name. It offers a quieter and more scenic alternative to its busier neighbors, while still being within easy reach of Phoenix’s job centers. Much of the housing stock consists of single-family homes, many built into the hillsides with high-end finishes and dramatic views. The town’s layout prioritizes privacy and nature, with limited commercial development and a strong emphasis on preserving the surrounding landscape. This makes it particularly appealing to retirees and affluent professionals looking for peaceful, upscale living.
The 2020–2022 period brought a wave of high-net-worth buyers, many of whom were drawn to Fountain Hills’ seclusion and proximity to Scottsdale’s amenities. Despite the downturn in 2023, a healthy rebound in 2024 and relative price stability in 2025 suggest that the market is leveling off rather than declining. Inventory remains limited, and because of geographic constraints and low-density planning, supply is unlikely to rise significantly in coming years. These factors, combined with steady demand and a desirable quality of life, have helped Fountain Hills maintain its spot as one of Arizona’s top-tier luxury markets.
8. New River – 205% Home Price Increase Since 2011
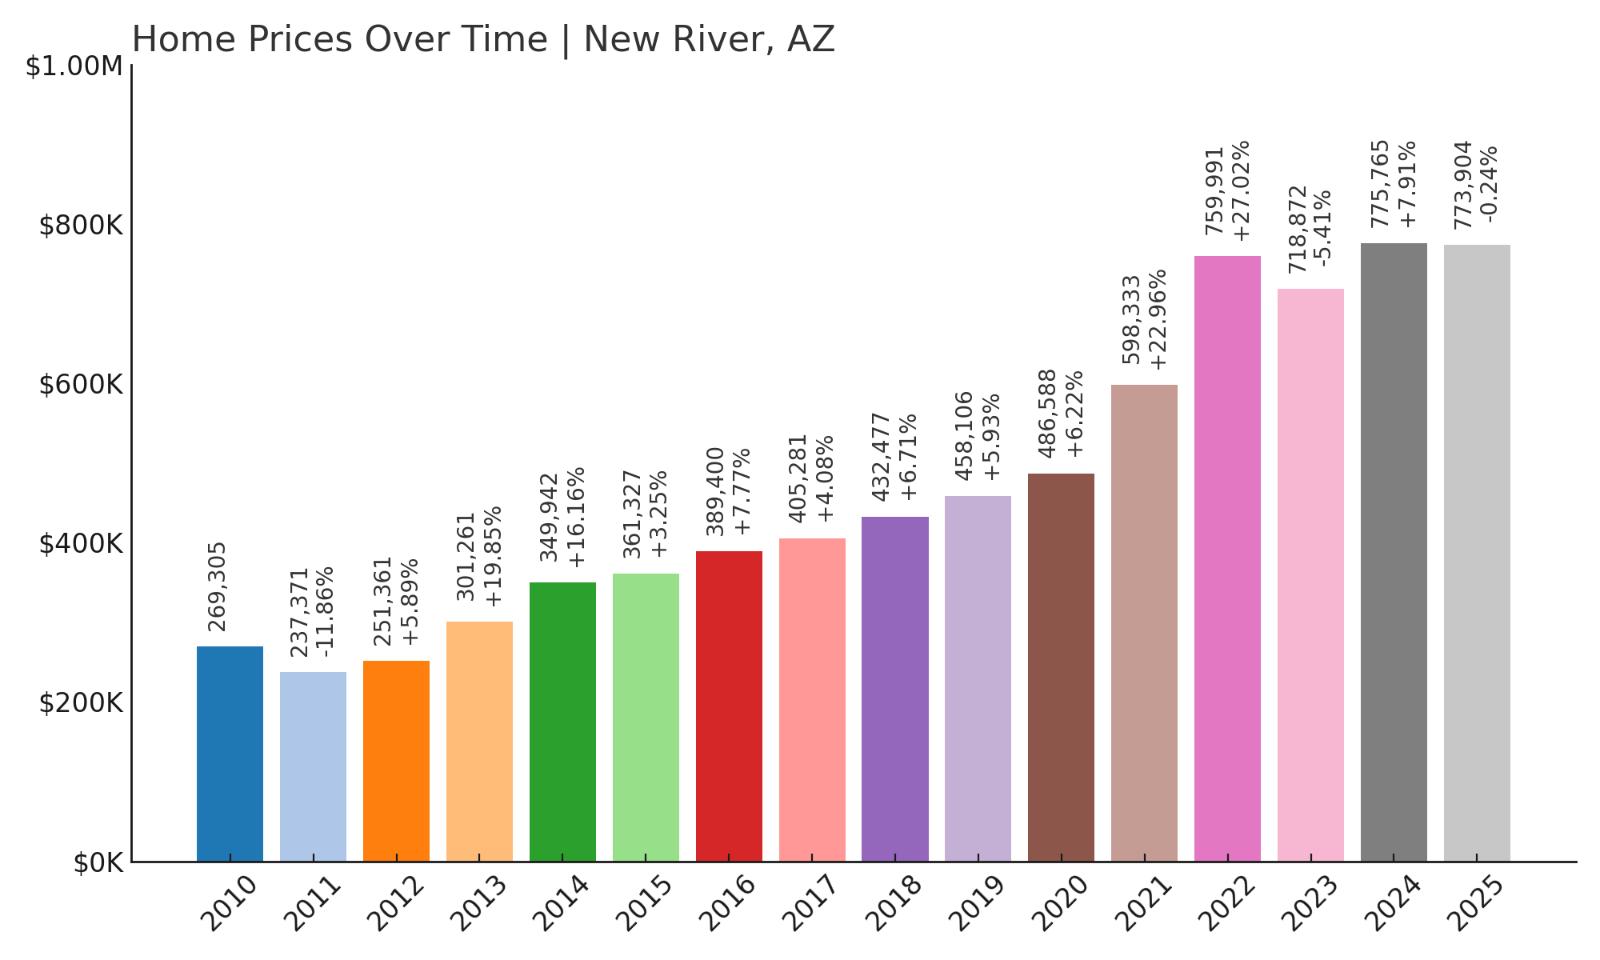
- 2010: $269,305
- 2011: $237,371 (-$31,934, -11.86% from previous year)
- 2012: $251,361 (+$13,990, +5.89% from previous year)
- 2013: $301,261 (+$49,900, +19.85% from previous year)
- 2014: $349,942 (+$48,681, +16.16% from previous year)
- 2015: $361,327 (+$11,385, +3.25% from previous year)
- 2016: $389,400 (+$28,073, +7.77% from previous year)
- 2017: $405,281 (+$15,881, +4.08% from previous year)
- 2018: $432,477 (+$27,197, +6.71% from previous year)
- 2019: $458,106 (+$25,629, +5.93% from previous year)
- 2020: $486,588 (+$28,482, +6.22% from previous year)
- 2021: $598,333 (+$111,745, +22.96% from previous year)
- 2022: $759,991 (+$161,658, +27.02% from previous year)
- 2023: $718,872 (-$41,119, -5.41% from previous year)
- 2024: $775,765 (+$56,894, +7.91% from previous year)
- 2025: $773,904 (-$1,862, -0.24% from previous year)
New River’s home values climbed from $237,371 in 2011 to $773,904 in 2025 — a 205% increase. The town saw huge appreciation during the pandemic years, including a 27% gain in 2022. While values slipped slightly in 2023 and 2025, the overall growth trajectory remains extremely strong. The market has proven resilient despite its rural location, largely due to the appeal of land, privacy, and space in a time when those qualities are increasingly in demand.
New River – Rugged Terrain, Rising Prices
New River sits along I-17 north of Phoenix and is known for its rugged landscape, horse properties, and lack of dense zoning. Many homes are built on multi-acre lots, offering space and flexibility not found in more suburban settings. Residents enjoy scenic views of the Sonoran Desert, access to off-roading trails and nature preserves, and a slower pace of life. There are no large subdivisions or planned communities here — and that’s part of the appeal. Buyers looking for freedom, outdoor living, and independence are increasingly drawn to areas like New River, especially those priced out of Phoenix’s northern suburbs like Anthem and Cave Creek.
The massive spike in values during 2021 and 2022 reflects this shift in buyer priorities. With relatively few homes for sale at any given time, even modest demand can create sharp upward pressure on prices. The area’s limited development — combined with a population that often resists zoning changes — means new housing stock is unlikely to grow significantly in the near future. Though values have fluctuated slightly since peaking, New River continues to attract a loyal buyer base. For those wanting rural living without giving up proximity to the Valley, it remains one of the most compelling and expensive semi-rural options in Arizona.
7. Rio Verde – 114% Home Price Increase Since 2012

- 2010: $428,518
- 2011: $394,901 (-$33,617, -7.84% from previous year)
- 2012: $390,217 (-$4,684, -1.19% from previous year)
- 2013: $425,553 (+$35,335, +9.06% from previous year)
- 2014: $456,051 (+$30,498, +7.17% from previous year)
- 2015: $466,162 (+$10,111, +2.22% from previous year)
- 2016: $469,238 (+$3,076, +0.66% from previous year)
- 2017: $484,066 (+$14,828, +3.16% from previous year)
- 2018: $496,837 (+$12,771, +2.64% from previous year)
- 2019: $523,354 (+$26,517, +5.34% from previous year)
- 2020: $568,862 (+$45,508, +8.70% from previous year)
- 2021: $649,456 (+$80,594, +14.17% from previous year)
- 2022: $844,204 (+$194,748, +29.99% from previous year)
- 2023: $817,952 (-$26,252, -3.11% from previous year)
- 2024: $850,957 (+$33,006, +4.04% from previous year)
- 2025: $845,570 (-$5,387, -0.63% from previous year)
Rio Verde’s home prices rose from $390,217 in 2012 to $845,570 in 2025, marking a 114% increase. Much of that growth came in recent years, particularly in 2022, when values jumped nearly 30% in a single year. Though the market dipped slightly in 2023 and again in 2025, prices remain far above their pre-pandemic levels. The data points to a high-demand, low-inventory area with long-term upward pressure and strong interest from high-income buyers seeking scenic, low-density living near Scottsdale.
Rio Verde – Private Golf Communities and Desert Peace
Rio Verde is a luxury residential enclave northeast of Scottsdale, best known for its upscale golf communities, private country clubs, and sweeping desert views. It’s a place where buyers go to escape the pace of city life while still enjoying high-end amenities, including championship golf courses, private fitness centers, and clubhouse dining. The neighborhoods are well-kept, gated, and often age-restricted, drawing in retirees and seasonal residents looking for peace, quiet, and community. Many homes are custom-built and sit on large lots, with scenic views of the McDowell Mountains and Four Peaks. Rio Verde isn’t just expensive — it’s exclusive, and that exclusivity has helped prices remain strong.
The explosive growth in 2022 was likely driven by pandemic-era demand for private, lifestyle-oriented housing away from urban cores. And although 2023 brought a small correction, prices bounced back in 2024 and ended 2025 with only a slight dip. What’s striking is how stable the market has remained despite broader volatility — a reflection of just how few properties are listed at any given time and how tightly supply is controlled. The area’s HOA-regulated communities and lack of nearby commercial development help maintain its serene character. For high-end buyers looking for a quiet desert retreat with country club comforts and strong long-term value, Rio Verde continues to deliver exactly that.
6. Scottsdale – 180% Home Price Increase Since 2011
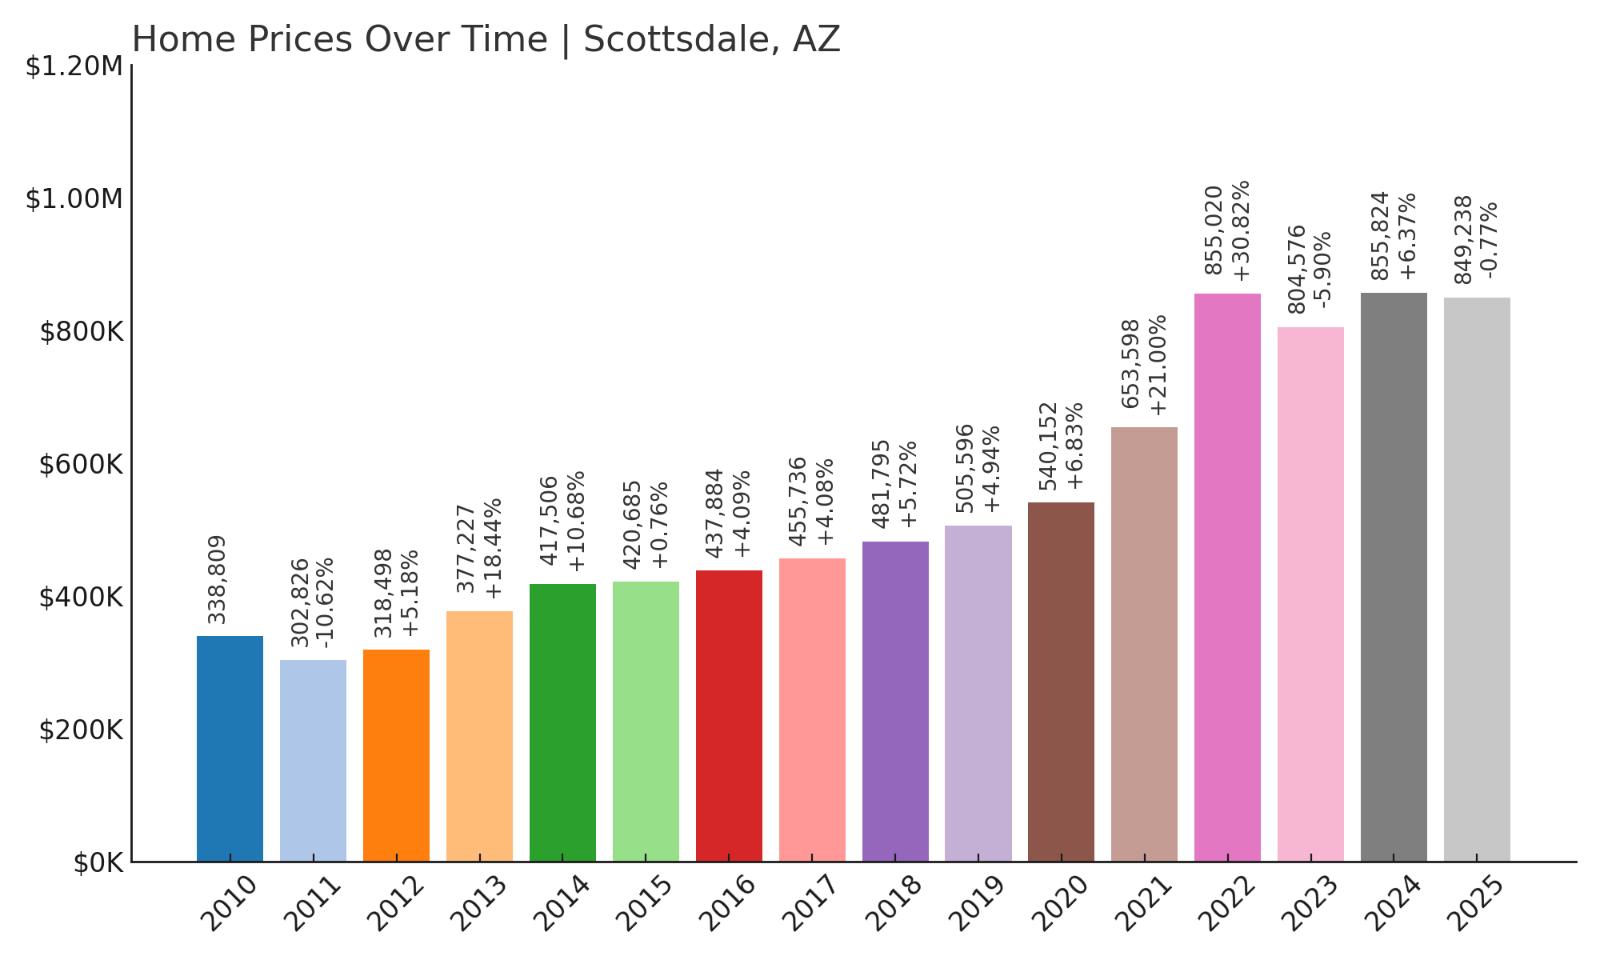
- 2010: $338,809
- 2011: $302,826 (-$35,984, -10.62% from previous year)
- 2012: $318,498 (+$15,673, +5.18% from previous year)
- 2013: $377,227 (+$58,728, +18.44% from previous year)
- 2014: $417,506 (+$40,279, +10.68% from previous year)
- 2015: $420,685 (+$3,178, +0.76% from previous year)
- 2016: $437,884 (+$17,199, +4.09% from previous year)
- 2017: $455,736 (+$17,852, +4.08% from previous year)
- 2018: $481,795 (+$26,059, +5.72% from previous year)
- 2019: $505,596 (+$23,801, +4.94% from previous year)
- 2020: $540,152 (+$34,556, +6.83% from previous year)
- 2021: $653,598 (+$113,446, +21.00% from previous year)
- 2022: $855,020 (+$201,422, +30.82% from previous year)
- 2023: $804,576 (-$50,444, -5.90% from previous year)
- 2024: $855,824 (+$51,248, +6.37% from previous year)
- 2025: $849,238 (-$6,585, -0.77% from previous year)
Scottsdale’s real estate market rose from $302,826 in 2011 to $849,238 by 2025 — an increase of 180% over 14 years. Prices surged especially hard between 2020 and 2022, with a massive 30.82% leap in 2022 alone. While values dipped slightly in 2023 and again in 2025, the recovery in 2024 kept the market close to all-time highs. Scottsdale’s combination of lifestyle, luxury, and location continues to make it one of Arizona’s most powerful real estate markets.
Scottsdale – Arizona’s Flagship Luxury Market

Scottsdale has long been considered the crown jewel of Arizona real estate, attracting buyers from across the country with its blend of upscale living, recreational amenities, and high-end shopping and dining. Stretching from the Old Town historic district in the south to the expansive desert communities of North Scottsdale, the city offers a diverse mix of neighborhoods and home styles — from sleek downtown condos to sprawling custom estates in gated communities. Its golf courses, resorts, spas, and trail systems make it a year-round lifestyle destination, while its economy is supported by tech, finance, healthcare, and tourism. All of this contributes to a steady stream of demand from both local move-up buyers and out-of-state transplants.
The massive home price appreciation from 2020 through 2022 mirrors national trends in affluent suburbs, but Scottsdale’s gains were especially pronounced due to intense relocation from higher-cost states like California. While values corrected slightly in 2023, they rebounded in 2024 and remained nearly flat in 2025 — a sign of market maturity and resistance to volatility. Inventory remains constrained in many high-demand neighborhoods, particularly in North Scottsdale, where lot sizes are larger and development is more regulated. With luxury amenities, top schools, and a strong brand identity as one of the West’s most livable cities, Scottsdale remains a magnet for investment and long-term homeownership — and its place near the top of Arizona’s most expensive housing markets is unlikely to change anytime soon.
5. Sedona – 174% Home Price Increase Since 2012
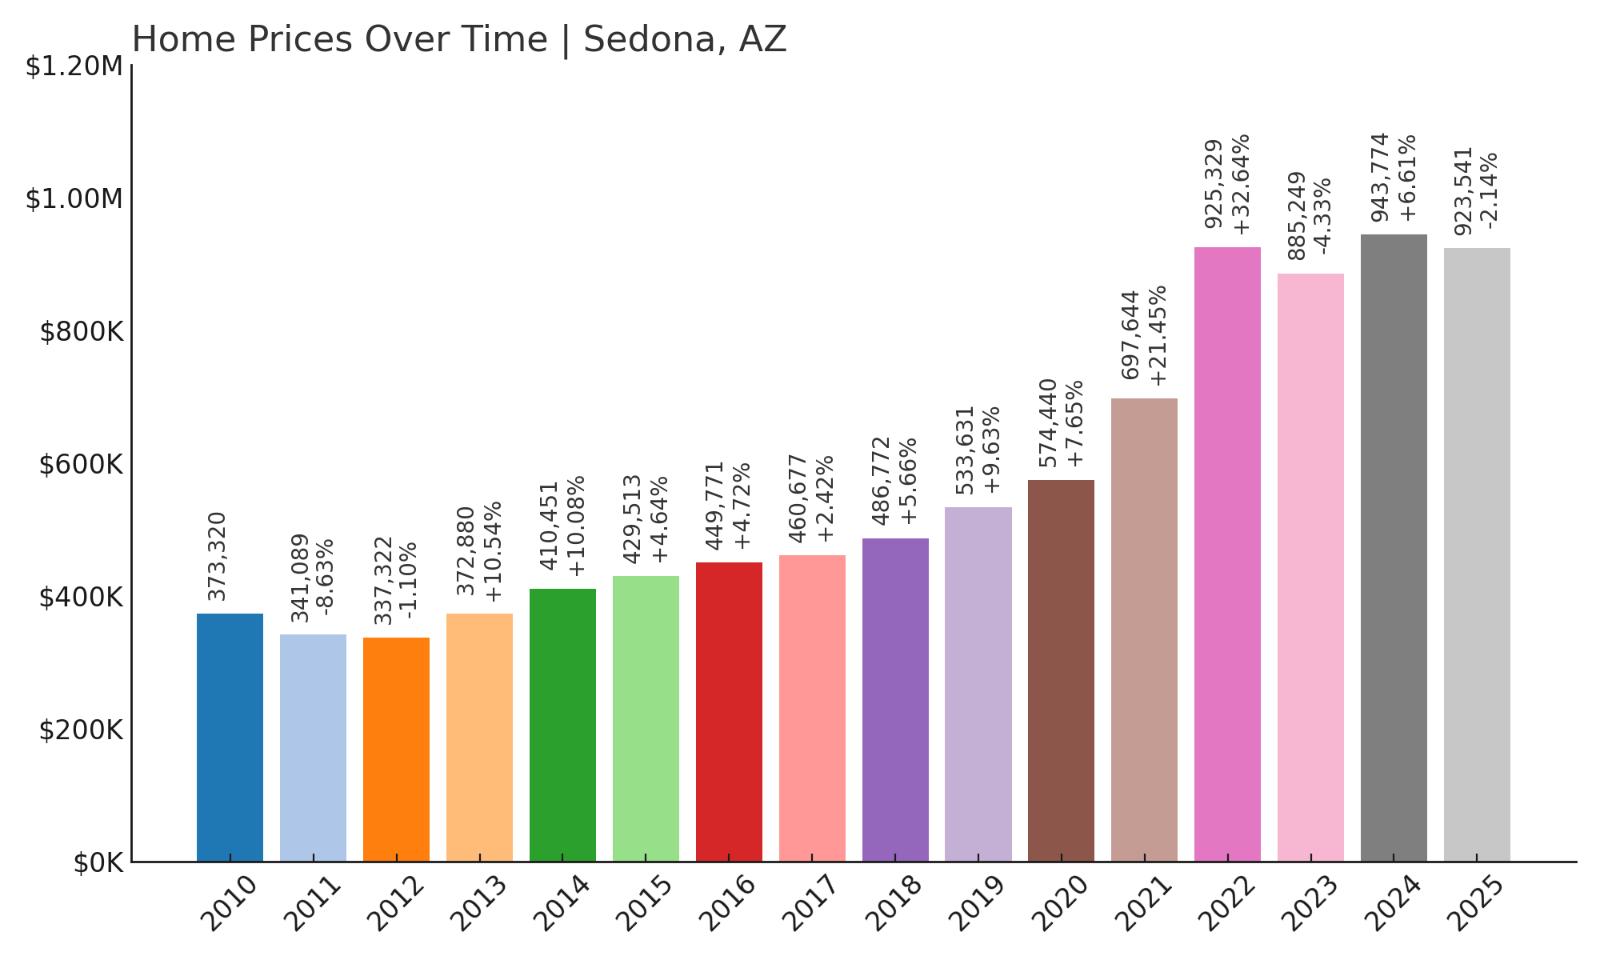
- 2010: $373,320
- 2011: $341,089 (-$32,231, -8.63% from previous year)
- 2012: $337,322 (-$3,767, -1.10% from previous year)
- 2013: $372,880 (+$35,557, +10.54% from previous year)
- 2014: $410,451 (+$37,572, +10.08% from previous year)
- 2015: $429,513 (+$19,062, +4.64% from previous year)
- 2016: $449,771 (+$20,258, +4.72% from previous year)
- 2017: $460,677 (+$10,906, +2.42% from previous year)
- 2018: $486,772 (+$26,095, +5.66% from previous year)
- 2019: $533,631 (+$46,859, +9.63% from previous year)
- 2020: $574,440 (+$40,809, +7.65% from previous year)
- 2021: $697,644 (+$123,204, +21.45% from previous year)
- 2022: $925,329 (+$227,685, +32.64% from previous year)
- 2023: $885,249 (-$40,080, -4.33% from previous year)
- 2024: $943,774 (+$58,525, +6.61% from previous year)
- 2025: $923,541 (-$20,233, -2.14% from previous year)
Sedona’s housing market has risen from $337,322 in 2012 to $923,541 in 2025 — a 174% increase. Known for its breathtaking scenery and tourism-driven economy, the town experienced two particularly explosive years in 2021 and 2022, with combined gains of over $350,000. While values cooled slightly in 2023 and again in 2025, Sedona’s home prices remain among the highest in the state. The data reflects not just desirability, but also the scarcity of developable land and the enduring appeal of Sedona’s red rock surroundings.
Sedona – Iconic Scenery and Rising Luxury
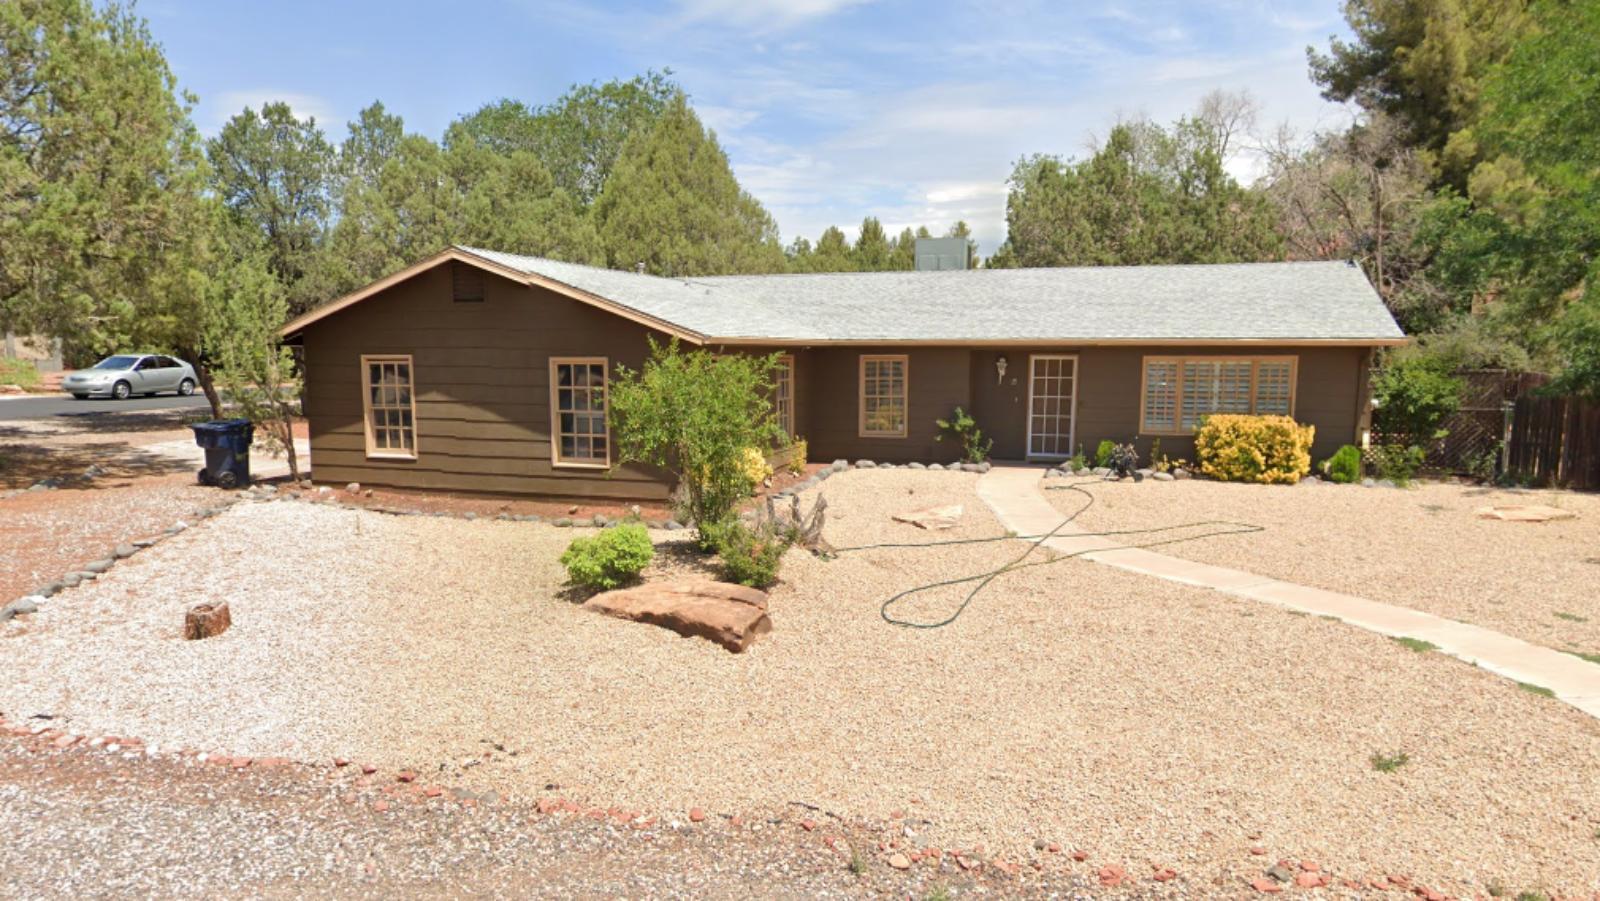
Sedona is one of Arizona’s most visually stunning locations — a desert town surrounded by red sandstone cliffs and known globally for its spiritual tourism, hiking, and vibrant arts scene. It draws homebuyers who are looking for more than just property — they’re investing in a lifestyle centered around nature, wellness, and serenity. Residential areas like West Sedona, Uptown, and the Village of Oak Creek offer a range of housing, but most are tightly regulated to protect the natural viewsheds. The scarcity of new development, due to both geographic and zoning limitations, has pushed values steadily upward, especially in high-demand neighborhoods with panoramic views of the red rocks.
The massive spike in 2022 suggests an influx of wealthy buyers — many likely second-homeowners or remote workers from higher-cost states — competing over limited inventory. While prices have since tapered, they remain near all-time highs. The strength of the short-term rental market also plays a role, as Sedona’s steady stream of year-round visitors creates reliable income opportunities for property owners. With land locked in by national forest and strong community resistance to overdevelopment, Sedona’s real estate market is positioned for long-term price resilience. Whether as a retirement haven, wellness retreat, or luxury escape, Sedona continues to command top dollar.
4. Fort McDowell – 104% Home Price Increase Since 2013
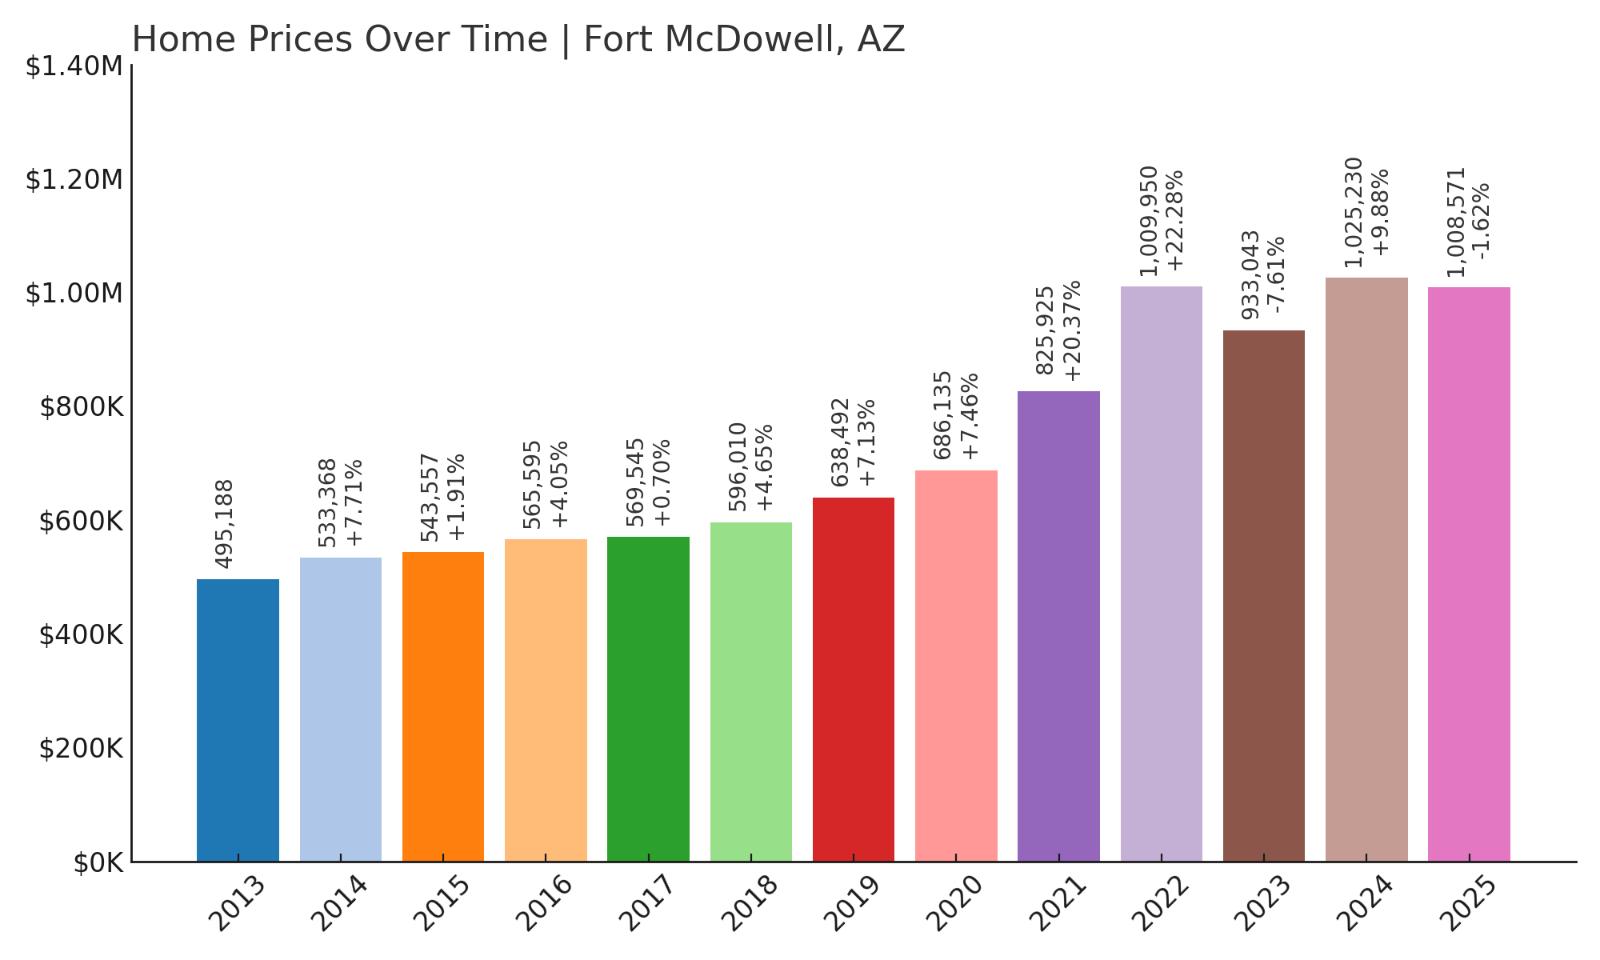
- 2010: N/A
- 2011: N/A
- 2012: N/A
- 2013: $495,188
- 2014: $533,368 (+$38,179, +7.71% from previous year)
- 2015: $543,557 (+$10,190, +1.91% from previous year)
- 2016: $565,595 (+$22,038, +4.05% from previous year)
- 2017: $569,545 (+$3,949, +0.70% from previous year)
- 2018: $596,010 (+$26,465, +4.65% from previous year)
- 2019: $638,492 (+$42,482, +7.13% from previous year)
- 2020: $686,135 (+$47,643, +7.46% from previous year)
- 2021: $825,925 (+$139,790, +20.37% from previous year)
- 2022: $1,009,950 (+$184,025, +22.28% from previous year)
- 2023: $933,043 (-$76,907, -7.61% from previous year)
- 2024: $1,025,230 (+$92,188, +9.88% from previous year)
- 2025: $1,008,571 (-$16,659, -1.62% from previous year)
Fort McDowell’s home prices rose from $495,188 in 2013 to $1,008,571 in 2025 — a 104% gain. Though the market has experienced a few dips in recent years, it remains one of the priciest corners of Maricopa County. The sharp increases from 2020 to 2022 added over $300,000 to the average home value. This performance reflects the area’s strong appeal to luxury buyers looking for exclusivity and privacy within reach of metro Phoenix.
Fort McDowell – Private, Scenic, and Highly Coveted
Fort McDowell is a sparsely developed area northeast of Scottsdale, bordered by the Tonto National Forest and the Salt River. With its dramatic desert landscapes, low population density, and rural zoning, it has become a niche destination for luxury buyers who want serenity without giving up access to city amenities. Many properties in Fort McDowell are custom-built and sit on large, multi-acre lots, some with horse privileges or trail access. This part of the Valley is ideal for buyers who value natural beauty and privacy above all else. Because there are so few homes available, price volatility can occur — but the long-term trend has been decisively upward.
The run-up in values from 2020 to 2022 was one of the strongest in the state, fueled by out-of-state buyers and remote workers looking to upgrade their lifestyle. While 2023 saw a correction, it was followed by a nearly 10% gain in 2024, showing that buyer interest remains high. With very limited development pressure and few new subdivisions, prices in Fort McDowell are likely to stay elevated. The market’s luxury tier is driven less by volume and more by quality and location. Fort McDowell may not be as well-known as Scottsdale, but for high-income buyers seeking seclusion, it’s quietly become one of Arizona’s premier real estate outposts.
3. Cave Creek – 177% Home Price Increase Since 2011
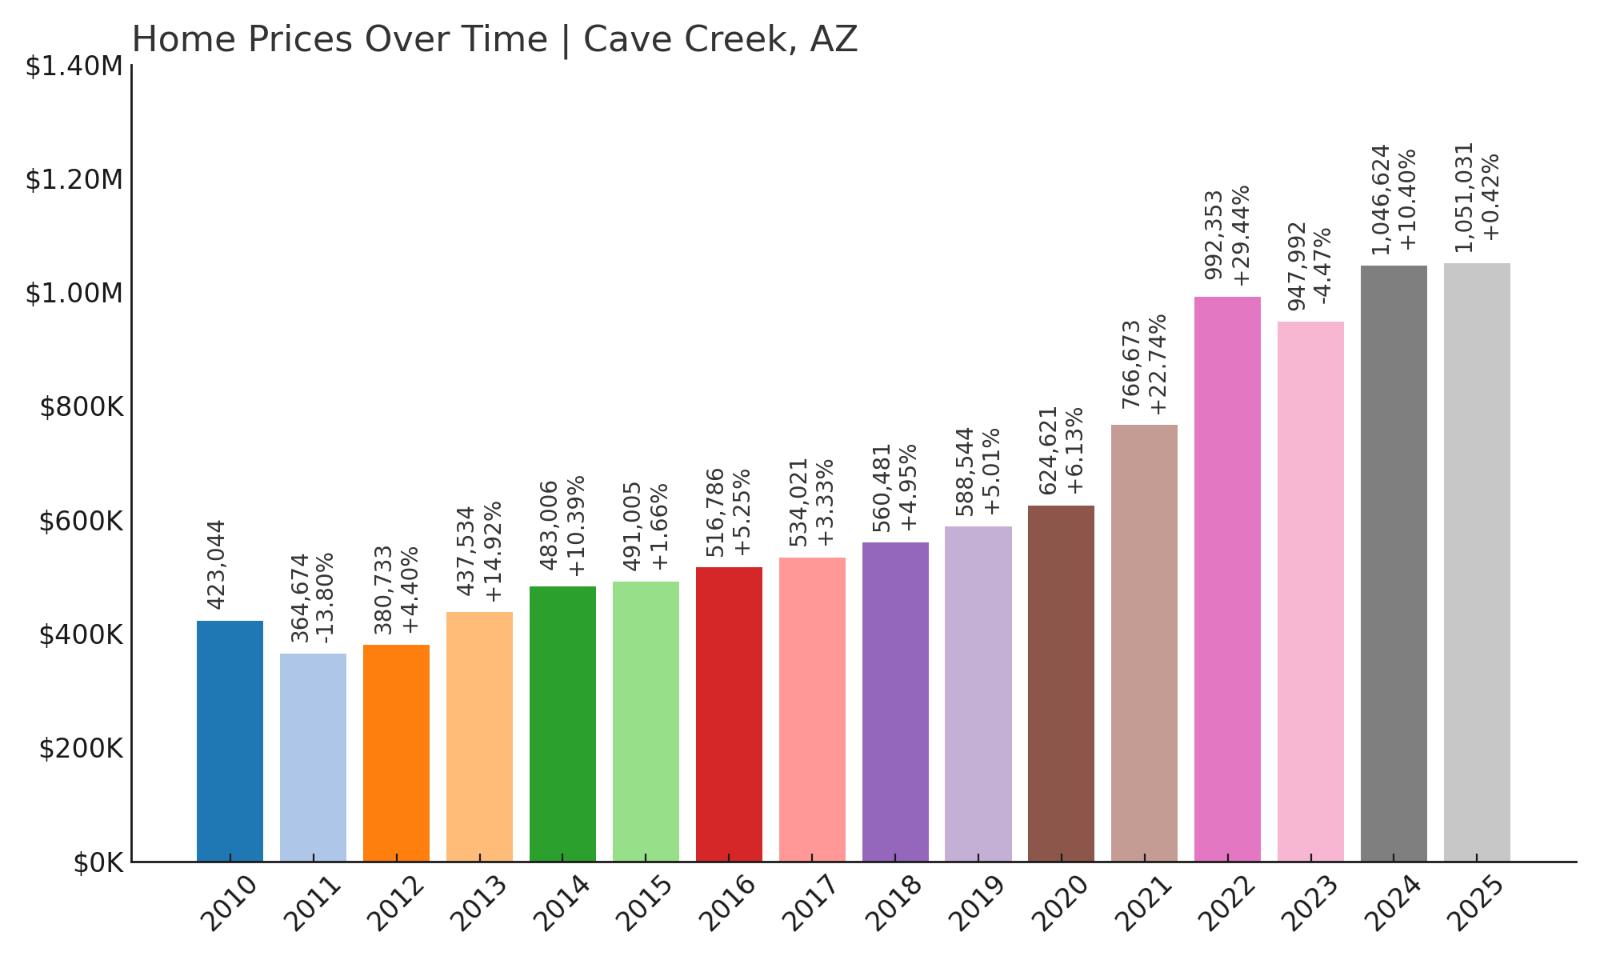
- 2010: $423,044
- 2011: $364,674 (-$58,370, -13.80% from previous year)
- 2012: $380,733 (+$16,060, +4.40% from previous year)
- 2013: $437,534 (+$56,801, +14.92% from previous year)
- 2014: $483,006 (+$45,472, +10.39% from previous year)
- 2015: $491,005 (+$7,999, +1.66% from previous year)
- 2016: $516,786 (+$25,781, +5.25% from previous year)
- 2017: $534,021 (+$17,235, +3.33% from previous year)
- 2018: $560,481 (+$26,460, +4.95% from previous year)
- 2019: $588,544 (+$28,062, +5.01% from previous year)
- 2020: $624,621 (+$36,077, +6.13% from previous year)
- 2021: $766,673 (+$142,052, +22.74% from previous year)
- 2022: $992,353 (+$225,680, +29.44% from previous year)
- 2023: $947,992 (-$44,361, -4.47% from previous year)
- 2024: $1,046,624 (+$98,632, +10.40% from previous year)
- 2025: $1,051,031 (+$4,407, +0.42% from previous year)
Cave Creek’s home values grew from $364,674 in 2011 to $1,051,031 in 2025 — a remarkable 177% gain. This western desert town saw especially strong appreciation between 2020 and 2022, adding over $350,000 in just two years. While the market has leveled off since then, the area remains one of the highest-priced communities in the Valley, supported by strong demand for its rustic charm, space, and natural surroundings.
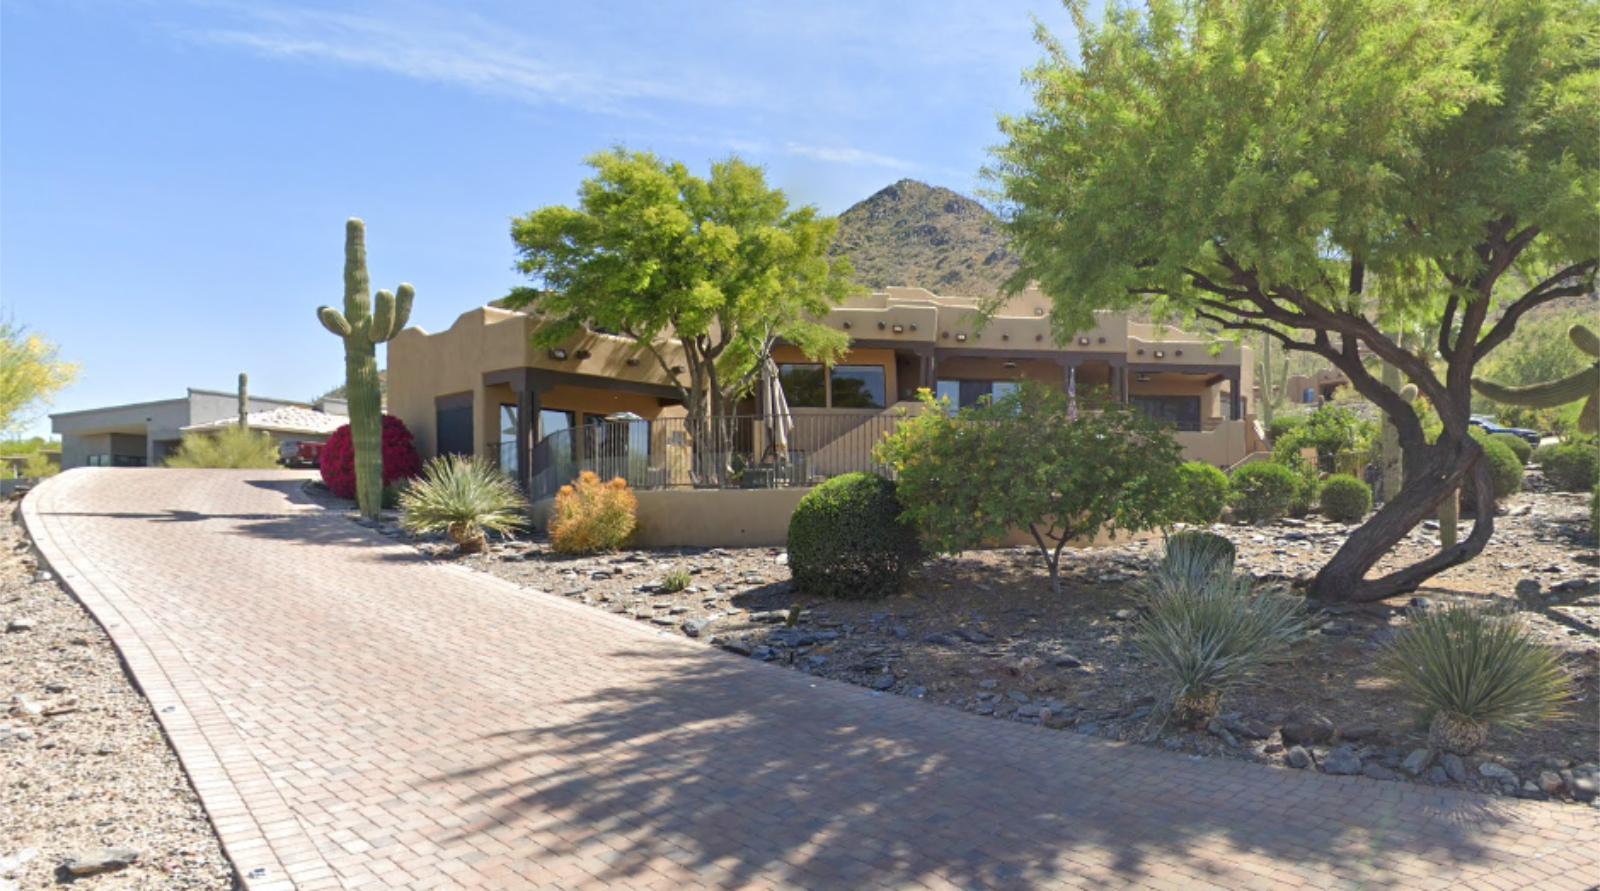
Cave Creek – Western Vibe With a Luxury Price Tag

Cave Creek blends old-school cowboy character with modern-day affluence. Situated just north of Phoenix and adjacent to Carefree, the town is known for its horse properties, rugged desert trails, and local saloons — but it’s also filled with million-dollar homes, gated estates, and luxury developments. It appeals to buyers looking for a sense of heritage and authenticity while still demanding high-end finishes and privacy. The zoning rules keep density low, which preserves its rural feel and limits new supply. Cave Creek is especially popular among second-homeowners and remote professionals who want a relaxed but refined lifestyle just a short drive from Scottsdale and Phoenix.
The surge in values during 2021 and 2022 mirrors what happened across many lifestyle-driven markets, but Cave Creek has managed to retain most of its gains even as the market cooled slightly. The price rebound in 2024 and stability in 2025 reflect continued interest and tight inventory. With views of Black Mountain, proximity to hiking and equestrian trails, and a strong local community culture, Cave Creek remains one of Arizona’s most distinctive and in-demand markets. Buyers may come for the rustic aesthetics, but they’re paying top-tier prices — and in Cave Creek, that price still buys a lot of freedom and character.
2. Carefree – 167% Home Price Increase Since 2011
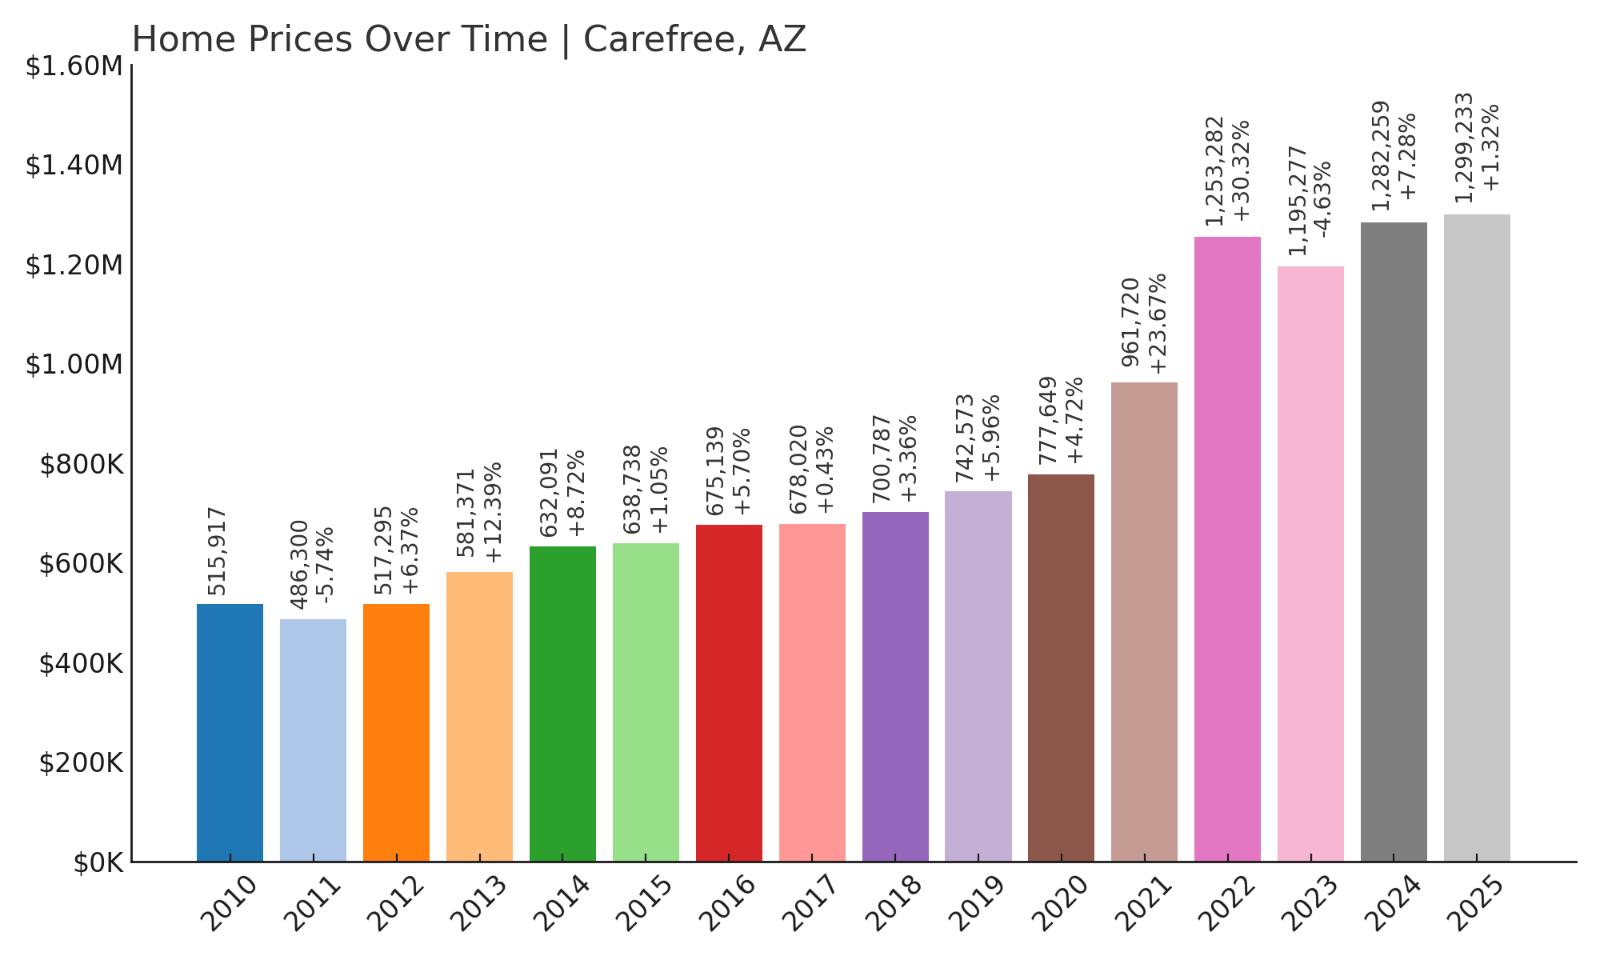
- 2010: $515,917
- 2011: $486,300 (-$29,617, -5.74% from previous year)
- 2012: $517,295 (+$30,995, +6.37% from previous year)
- 2013: $581,371 (+$64,077, +12.39% from previous year)
- 2014: $632,091 (+$50,720, +8.72% from previous year)
- 2015: $638,738 (+$6,646, +1.05% from previous year)
- 2016: $675,139 (+$36,401, +5.70% from previous year)
- 2017: $678,020 (+$2,881, +0.43% from previous year)
- 2018: $700,787 (+$22,767, +3.36% from previous year)
- 2019: $742,573 (+$41,786, +5.96% from previous year)
- 2020: $777,649 (+$35,076, +4.72% from previous year)
- 2021: $961,720 (+$184,071, +23.67% from previous year)
- 2022: $1,253,282 (+$291,563, +30.32% from previous year)
- 2023: $1,195,277 (-$58,005, -4.63% from previous year)
- 2024: $1,282,259 (+$86,982, +7.28% from previous year)
- 2025: $1,299,233 (+$16,974, +1.32% from previous year)
Carefree’s housing market rose from $486,300 in 2011 to $1,299,233 in 2025 — a 167% increase that reflects the town’s transformation into one of Arizona’s most exclusive enclaves. The biggest gains occurred in 2021 and 2022, when values soared by more than $475,000 in just two years. While there was a short-term dip in 2023, recovery followed quickly, and the town ended 2025 with prices near their historic peak. The data points to an elite, low-volume market with long-term upward momentum and strong luxury appeal.
Carefree – Elite Living on the Edge of the Desert
Carefree lives up to its name with a peaceful, picturesque setting at the edge of the Sonoran Desert, just north of Scottsdale and east of Cave Creek. This small town has long cultivated a quiet, artistic atmosphere, with upscale homes designed to blend into the natural landscape. Many residences are perched on desert hillsides with sweeping views of Black Mountain and the surrounding saguaro-studded terrain. Carefree’s housing stock is mostly custom, with large lots, gated streets, and private amenities — all of which contribute to its high price points. The town deliberately limits development, favoring quality over quantity, which keeps inventory tight and home values elevated.
The explosive price gains in 2021 and 2022 reflect a wave of interest from out-of-state buyers, many of whom were drawn by the area’s natural beauty, privacy, and prestige. Even after a price dip in 2023, the market rebounded quickly, with two consecutive years of growth. There’s a strong second-home market here, but Carefree is also becoming a destination for full-time luxury buyers seeking serenity away from Phoenix’s sprawl. With minimal commercial encroachment and strict architectural controls, the town is likely to retain its unique character and high valuations well into the future. Carefree remains one of Arizona’s most refined — and expensive — addresses.
1. Paradise Valley – 209% Home Price Increase Since 2011
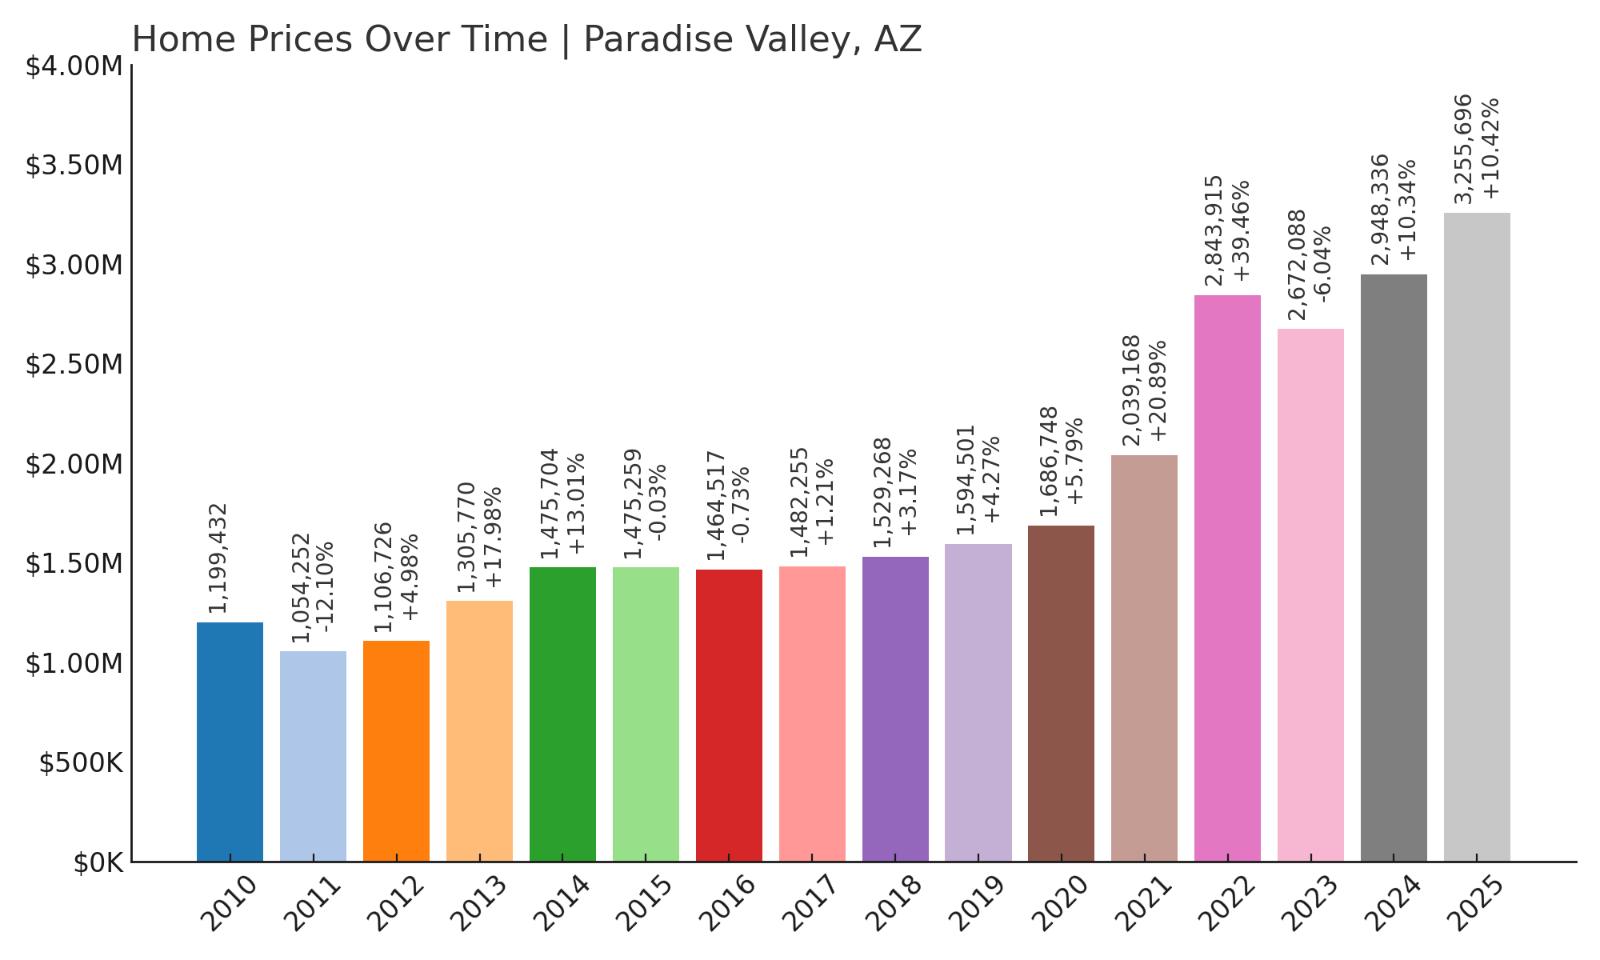
- 2010: $1,199,432
- 2011: $1,054,252 (-$145,180, -12.10% from previous year)
- 2012: $1,106,726 (+$52,473, +4.98% from previous year)
- 2013: $1,305,770 (+$199,044, +17.98% from previous year)
- 2014: $1,475,704 (+$169,934, +13.01% from previous year)
- 2015: $1,475,259 (-$446, -0.03% from previous year)
- 2016: $1,464,517 (-$10,742, -0.73% from previous year)
- 2017: $1,482,255 (+$17,738, +1.21% from previous year)
- 2018: $1,529,268 (+$47,013, +3.17% from previous year)
- 2019: $1,594,501 (+$65,233, +4.27% from previous year)
- 2020: $1,686,748 (+$92,246, +5.79% from previous year)
- 2021: $2,039,168 (+$352,420, +20.89% from previous year)
- 2022: $2,843,915 (+$804,748, +39.46% from previous year)
- 2023: $2,672,088 (-$171,827, -6.04% from previous year)
- 2024: $2,948,336 (+$276,247, +10.34% from previous year)
- 2025: $3,255,696 (+$307,360, +10.42% from previous year)
Paradise Valley stands at the pinnacle of Arizona’s housing market, with home prices rising from $1,054,252 in 2011 to $3,255,696 in 2025 — a staggering 209% increase. Already one of the most expensive ZIP codes in the state, the town saw particularly dramatic gains in 2021 and 2022, adding over $1.2 million in value in just two years. Even after a slight dip in 2023, prices rebounded strongly, closing 2025 with another double-digit gain. The numbers reinforce Paradise Valley’s reputation as the most prestigious and valuable real estate market in Arizona.
Paradise Valley – Arizona’s Gold Standard for Real Estate

Paradise Valley is synonymous with luxury. Tucked between Scottsdale and Phoenix, it offers a rare blend of massive estates, panoramic mountain views, and total seclusion — all just minutes from top-tier restaurants, golf courses, and cultural attractions. Homes here routinely sell for well over $5 million, and it’s not uncommon to find properties with private gates, resort-style pools, guest houses, and views of Camelback Mountain. The town enforces strict zoning and minimum lot sizes, ensuring a low-density environment that emphasizes privacy and exclusivity. It’s a favorite among CEOs, athletes, entertainers, and legacy Arizona families — a place where wealth and design converge in the most desirable way.
The market’s explosive growth in 2022 — nearly 40% in one year — was a clear indicator of Paradise Valley’s resilience and appeal even in volatile times. Since then, prices have not only held but surged again, reaching new highs in 2025. With virtually no commercial development within town limits and no appetite for high-density housing, supply will remain tight. This scarcity, combined with global-level demand, keeps Paradise Valley in a class of its own. For buyers seeking Arizona’s most elite address, this is it — and the data confirms its status beyond question.