
Wisconsin might be known for its modest cost of living, but these 19 towns are in a league of their own. According to the Zillow Home Value Index, they’re now the most expensive places to live in the state—thanks to high demand, limited supply, and long-term price growth that shows no sign of slowing down.
Some are high-end lake towns, others are wealthy suburbs with easy commutes and top-tier schools. A few saw massive gains during the pandemic-era boom, but many have been quietly expensive for years. What they all share is a housing market that’s consistently outpacing the rest of Wisconsin—making them the state’s top-tier property markets in 2025.
19. Springdale – 91% Home Price Increase Since 2012
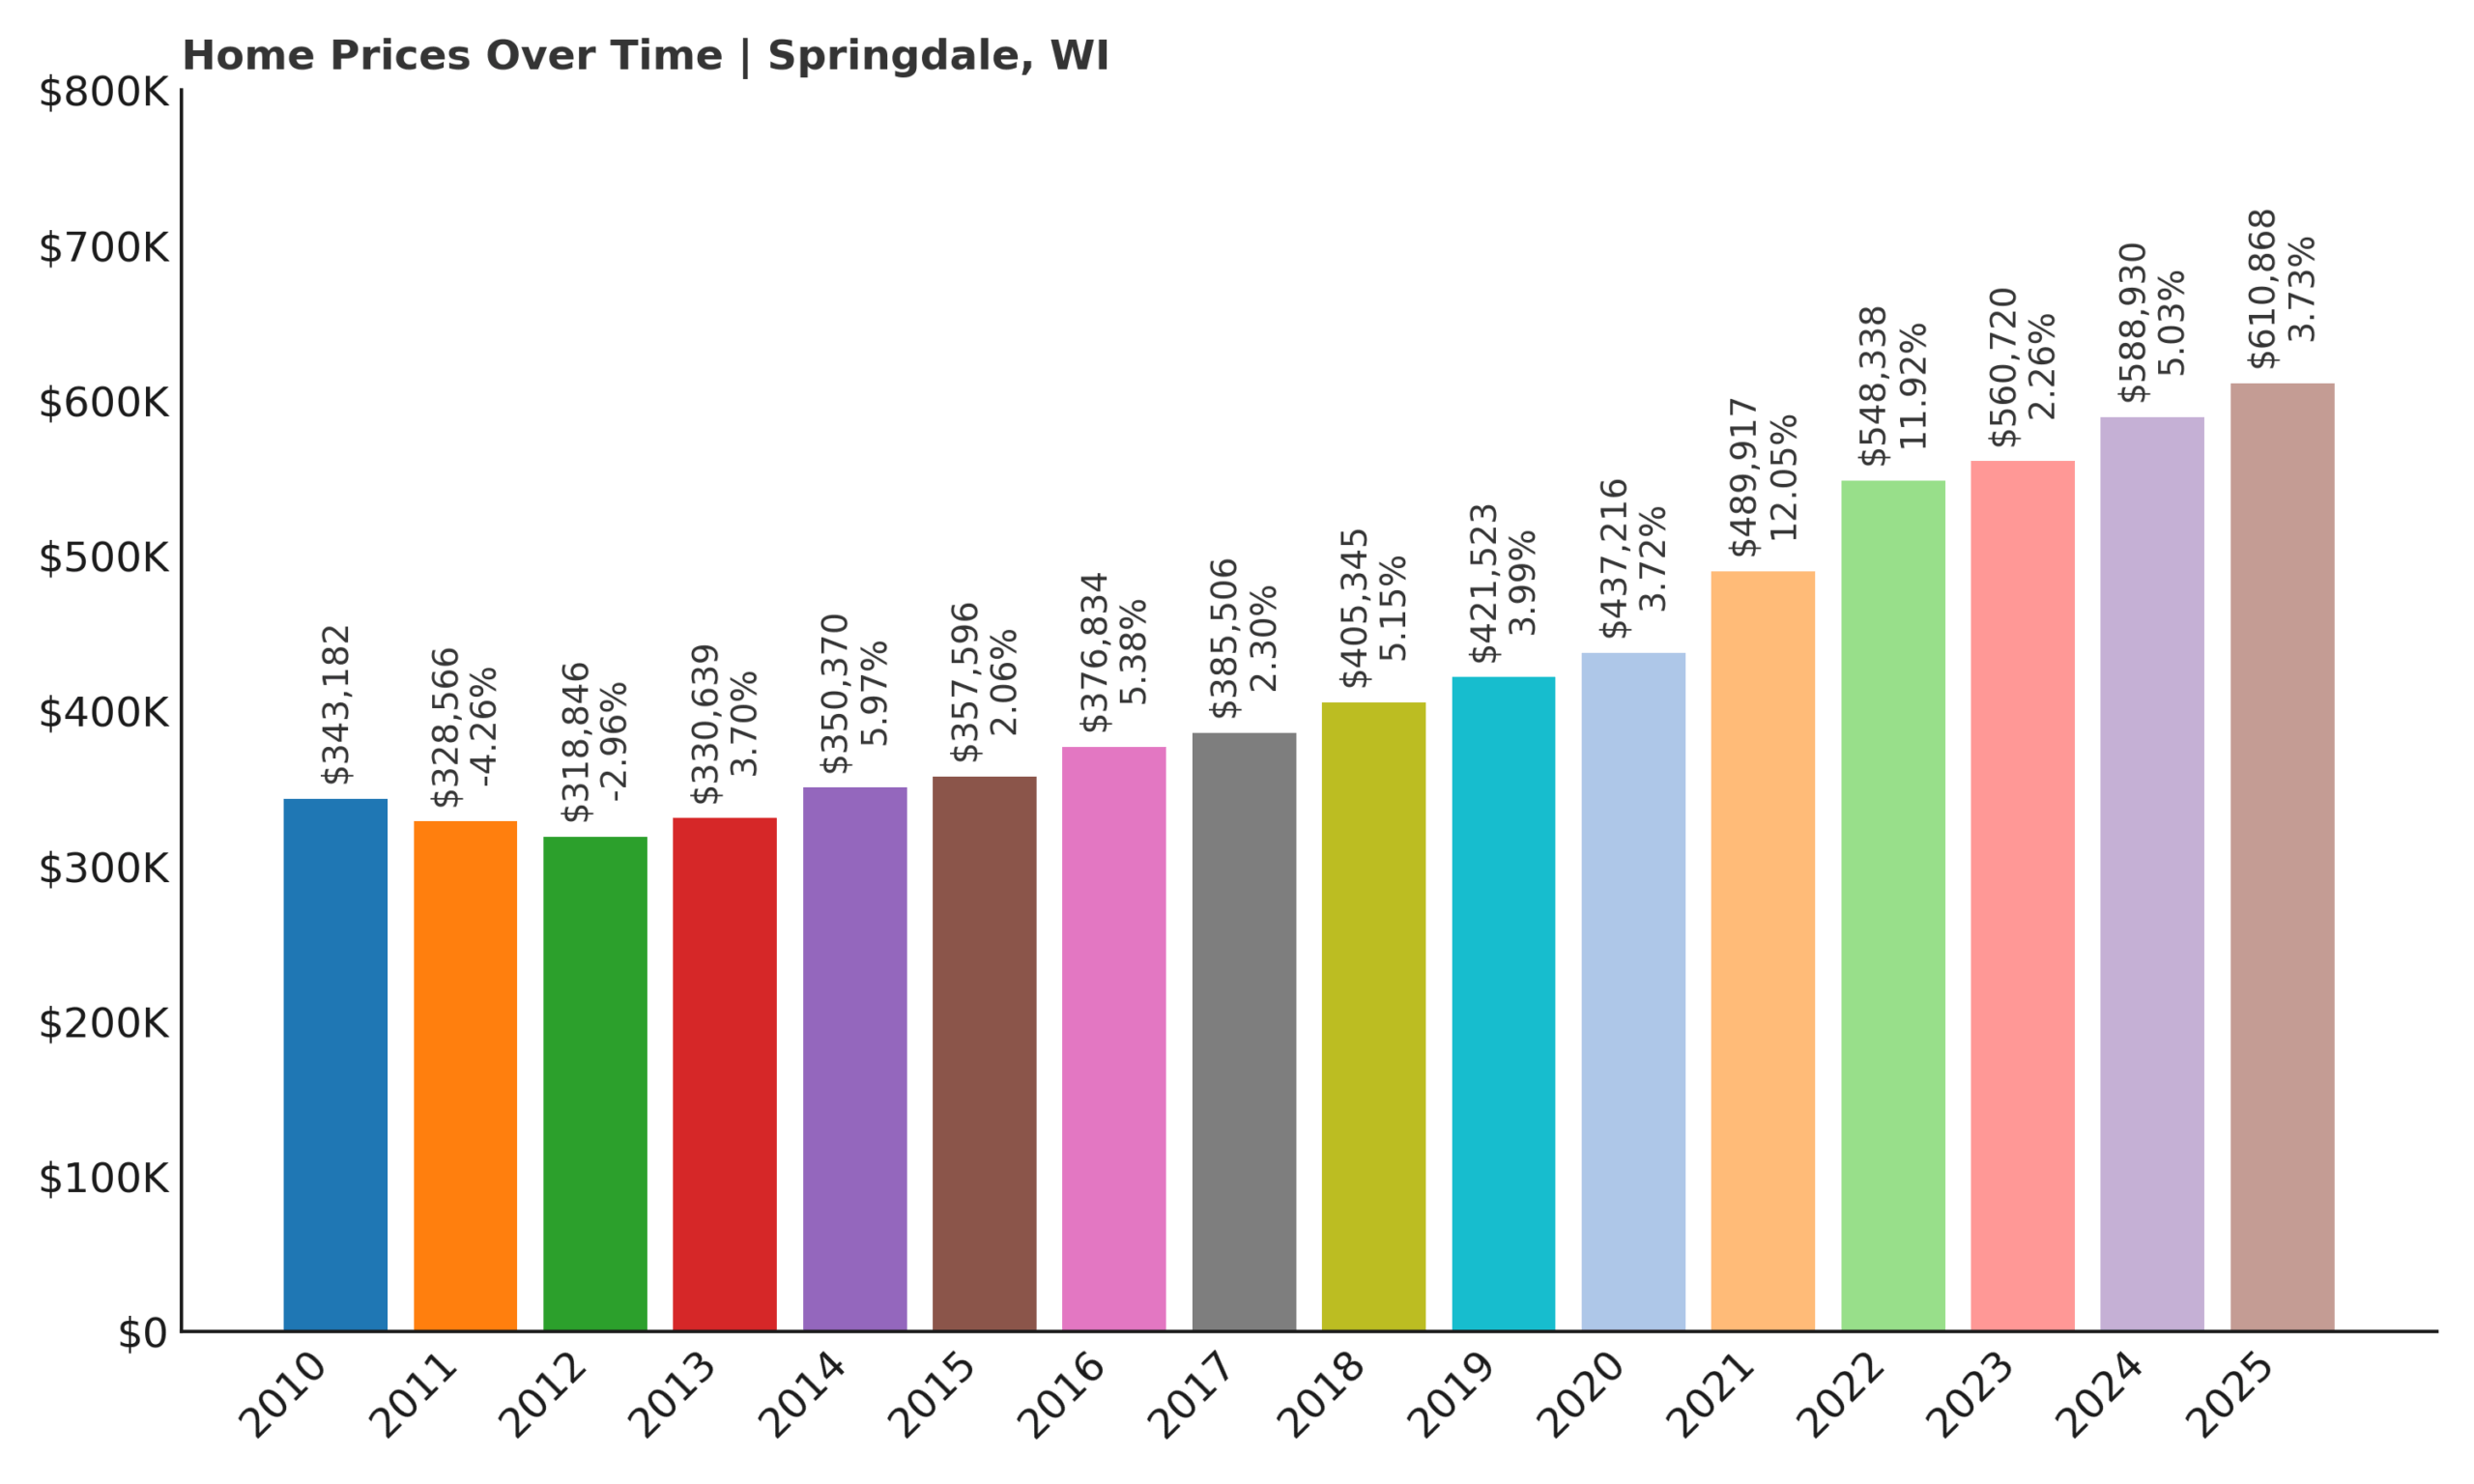
- 2010: $343,182
- 2011: $328,566 (-$14,616, -4.26% from previous year)
- 2012: $318,846 (-$9,721, -2.96% from previous year)
- 2013: $330,639 (+$11,794, +3.70% from previous year)
- 2014: $350,370 (+$19,731, +5.97% from previous year)
- 2015: $357,596 (+$7,226, +2.06% from previous year)
- 2016: $376,834 (+$19,238, +5.38% from previous year)
- 2017: $385,506 (+$8,673, +2.30% from previous year)
- 2018: $405,345 (+$19,839, +5.15% from previous year)
- 2019: $421,523 (+$16,178, +3.99% from previous year)
- 2020: $437,216 (+$15,693, +3.72% from previous year)
- 2021: $489,917 (+$52,701, +12.05% from previous year)
- 2022: $548,338 (+$58,421, +11.92% from previous year)
- 2023: $560,720 (+$12,383, +2.26% from previous year)
- 2024: $588,930 (+$28,210, +5.03% from previous year)
- 2025: $610,868 (+$21,938, +3.73% from previous year)
Springdale has experienced a 91% jump in home values since 2012, making it one of Wisconsin’s quiet but powerful climbers in the real estate market. The town’s price growth has been built on consistency—each year adding just a little more weight to its overall appreciation. The strongest acceleration came in the early 2020s, particularly between 2020 and 2022, when values rose more than $100,000 over just two years. While the growth has moderated since then, it hasn’t reversed, signaling that demand is holding strong in 2025. That long arc of stable, upward momentum puts Springdale solidly on this list of high-value towns.
Springdale – Rural Tranquility Just West of Madison

Located in Dane County, Springdale sits just west of Madison, offering a blend of wide-open spaces and access to urban resources. The area is known for its agricultural heritage, quiet roads, and scenic rolling landscapes—features that continue to draw families and professionals who want more land and privacy without straying far from the job centers of Madison. There’s little in the way of commercial development or high-density housing here, which helps preserve the town’s rural character while supporting long-term home value growth.
What makes Springdale particularly attractive is its position within a strong school district and its appeal to buyers looking for generational homes. The housing stock includes large lots, modern farmhouses, and custom builds, making it ideal for those who want space without being isolated. Thanks to thoughtful planning and a commitment to low-density growth, Springdale’s supply remains limited. That scarcity—paired with its strong location—continues to push home values higher, attracting attention from buyers who might otherwise focus on more crowded suburbs closer to Madison’s core.
18. Ottawa – 90% Home Price Increase Since 2012

- 2010: $335,221
- 2011: $325,669 (-$9,551, -2.85% from previous year)
- 2012: $321,889 (-$3,780, -1.16% from previous year)
- 2013: $335,434 (+$13,545, +4.21% from previous year)
- 2014: $354,199 (+$18,765, +5.59% from previous year)
- 2015: $358,224 (+$4,025, +1.14% from previous year)
- 2016: $367,607 (+$9,383, +2.62% from previous year)
- 2017: $383,206 (+$15,599, +4.24% from previous year)
- 2018: $402,754 (+$19,548, +5.10% from previous year)
- 2019: $432,796 (+$30,042, +7.46% from previous year)
- 2020: $463,378 (+$30,582, +7.07% from previous year)
- 2021: $501,603 (+$38,225, +8.25% from previous year)
- 2022: $546,795 (+$45,192, +9.01% from previous year)
- 2023: $564,169 (+$17,374, +3.18% from previous year)
- 2024: $601,015 (+$36,847, +6.53% from previous year)
- 2025: $612,655 (+$11,639, +1.94% from previous year)
Ottawa’s housing market has climbed steadily, registering a 90% increase in home prices since 2012. What’s most notable is how sustained the growth has been—year after year of modest but meaningful gains, interrupted only by brief slowdowns. Price jumps between 2019 and 2022 were particularly strong, adding over $100,000 in value during that short period. While 2025’s rise has cooled to under 2%, the long-term appreciation reflects deep, consistent demand from buyers who see Ottawa as both a residential haven and a solid investment.
Ottawa – Country Living with High Demand

Ottawa sits in western Waukesha County, offering a quiet, natural setting that’s become increasingly rare in southeastern Wisconsin. With much of the town covered in forest, farmland, and preserved land near the Kettle Moraine State Forest, Ottawa appeals to buyers looking for privacy and natural beauty. Many homes are built on large parcels and are custom-designed—features that help support higher average price points. Limited development and careful zoning have further constrained supply, allowing demand to steadily drive values upward over the past decade.
While it may lack a defined downtown, Ottawa benefits from proximity to major roads that provide easy access to Oconomowoc, Delafield, and even Milwaukee for commuters. Its location within the Kettle Moraine School District adds another draw for families. Outdoor enthusiasts find plenty to love here, and with few new subdivisions being built, the housing market remains tight. This scarcity, paired with Ottawa’s scenic charm, continues to make it one of the most expensive towns in the state despite its rural profile.
✅ Hotel #1
✅ Hotel #2
✅ Hotel #3
AN-APP-MAR19.jpg” alt=”Get pre-approved for home equity loan” width=”1628″ height=”742″>
17. Bristol – 101% Home Price Increase Since 2012
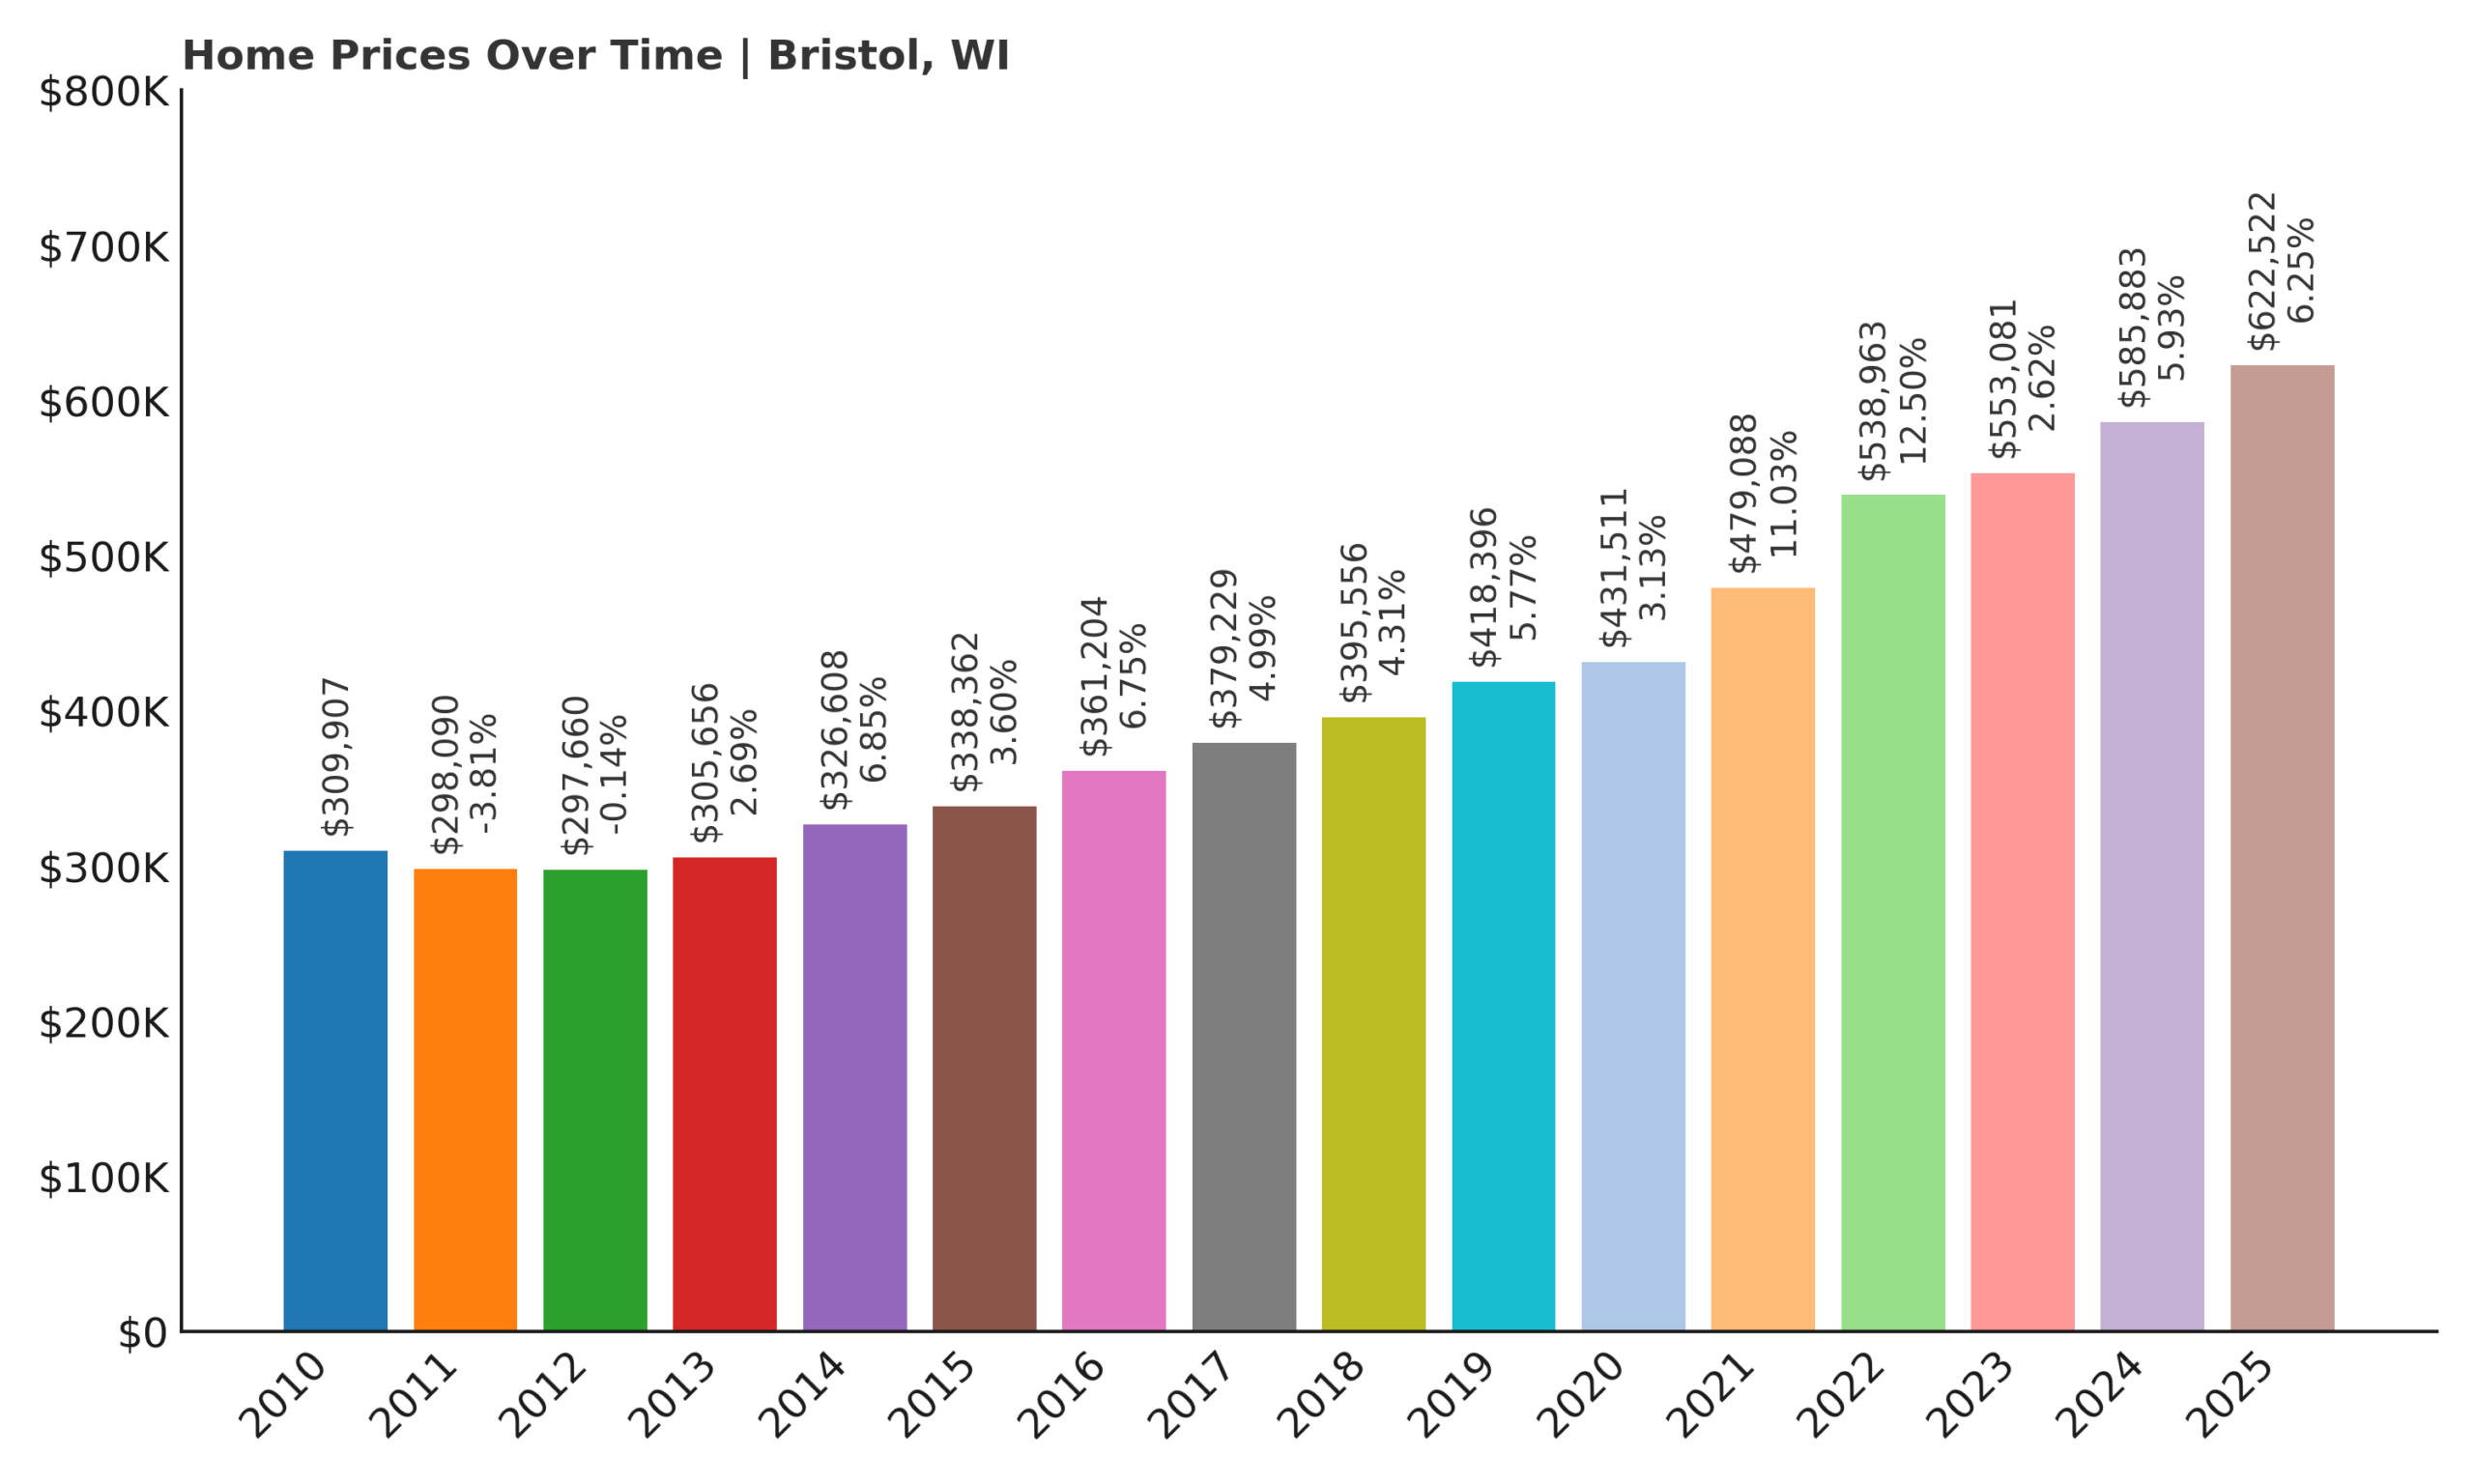
- 2010: $309,907
- 2011: $298,090 (-$11,816, -3.81% from previous year)
- 2012: $297,660 (-$430, -0.14% from previous year)
- 2013: $305,656 (+$7,996, +2.69% from previous year)
- 2014: $326,608 (+$20,951, +6.85% from previous year)
- 2015: $338,362 (+$11,754, +3.60% from previous year)
- 2016: $361,204 (+$22,842, +6.75% from previous year)
- 2017: $379,229 (+$18,025, +4.99% from previous year)
- 2018: $395,556 (+$16,327, +4.31% from previous year)
- 2019: $418,396 (+$22,840, +5.77% from previous year)
- 2020: $431,511 (+$13,115, +3.13% from previous year)
- 2021: $479,088 (+$47,577, +11.03% from previous year)
- 2022: $538,963 (+$59,875, +12.50% from previous year)
- 2023: $553,081 (+$14,118, +2.62% from previous year)
- 2024: $585,883 (+$32,802, +5.93% from previous year)
- 2025: $622,522 (+$36,640, +6.25% from previous year)
Bristol’s home prices have more than doubled since 2012, rising from just under $298,000 to over $622,000 in 2025. That 101% increase is fueled by a mix of steady year-over-year growth and a major acceleration in the early 2020s. The strongest period came between 2020 and 2022, when the average home gained more than $100,000 in value. But even outside those boom years, Bristol posted consistent appreciation—often in the 3–6% range—which has helped establish it as a stable and sought-after market. Price gains in both hot and cooler years reflect a deep and ongoing demand for homes in this part of Kenosha County.
Bristol – Growing Demand in a Strategic Location

Located in southeastern Wisconsin near the Illinois border, Bristol enjoys strong geographic positioning between Milwaukee and Chicago. That makes it especially attractive for commuters and cross-border professionals who want more space than what urban centers provide. The town has a mix of rural charm and newer residential development, creating a balanced real estate landscape that appeals to a range of buyers. While not as high-profile as resort towns, Bristol offers lake access, open space, and newer construction—all of which support the high values seen in recent years.
Another factor working in Bristol’s favor is its increasing role as a growth corridor. As housing prices in nearby cities continue to rise, demand for suburban and exurban homes in well-connected areas like Bristol is surging. The town’s solid school district and low crime rates are further draws for families, while ongoing infrastructure investments support continued residential growth. These trends help explain the town’s rapid appreciation, even as overall market growth in the region begins to level off. In 2025, Bristol remains one of Kenosha County’s most valuable real estate markets.
16. Whitefish Bay – 87% Home Price Increase Since 2012
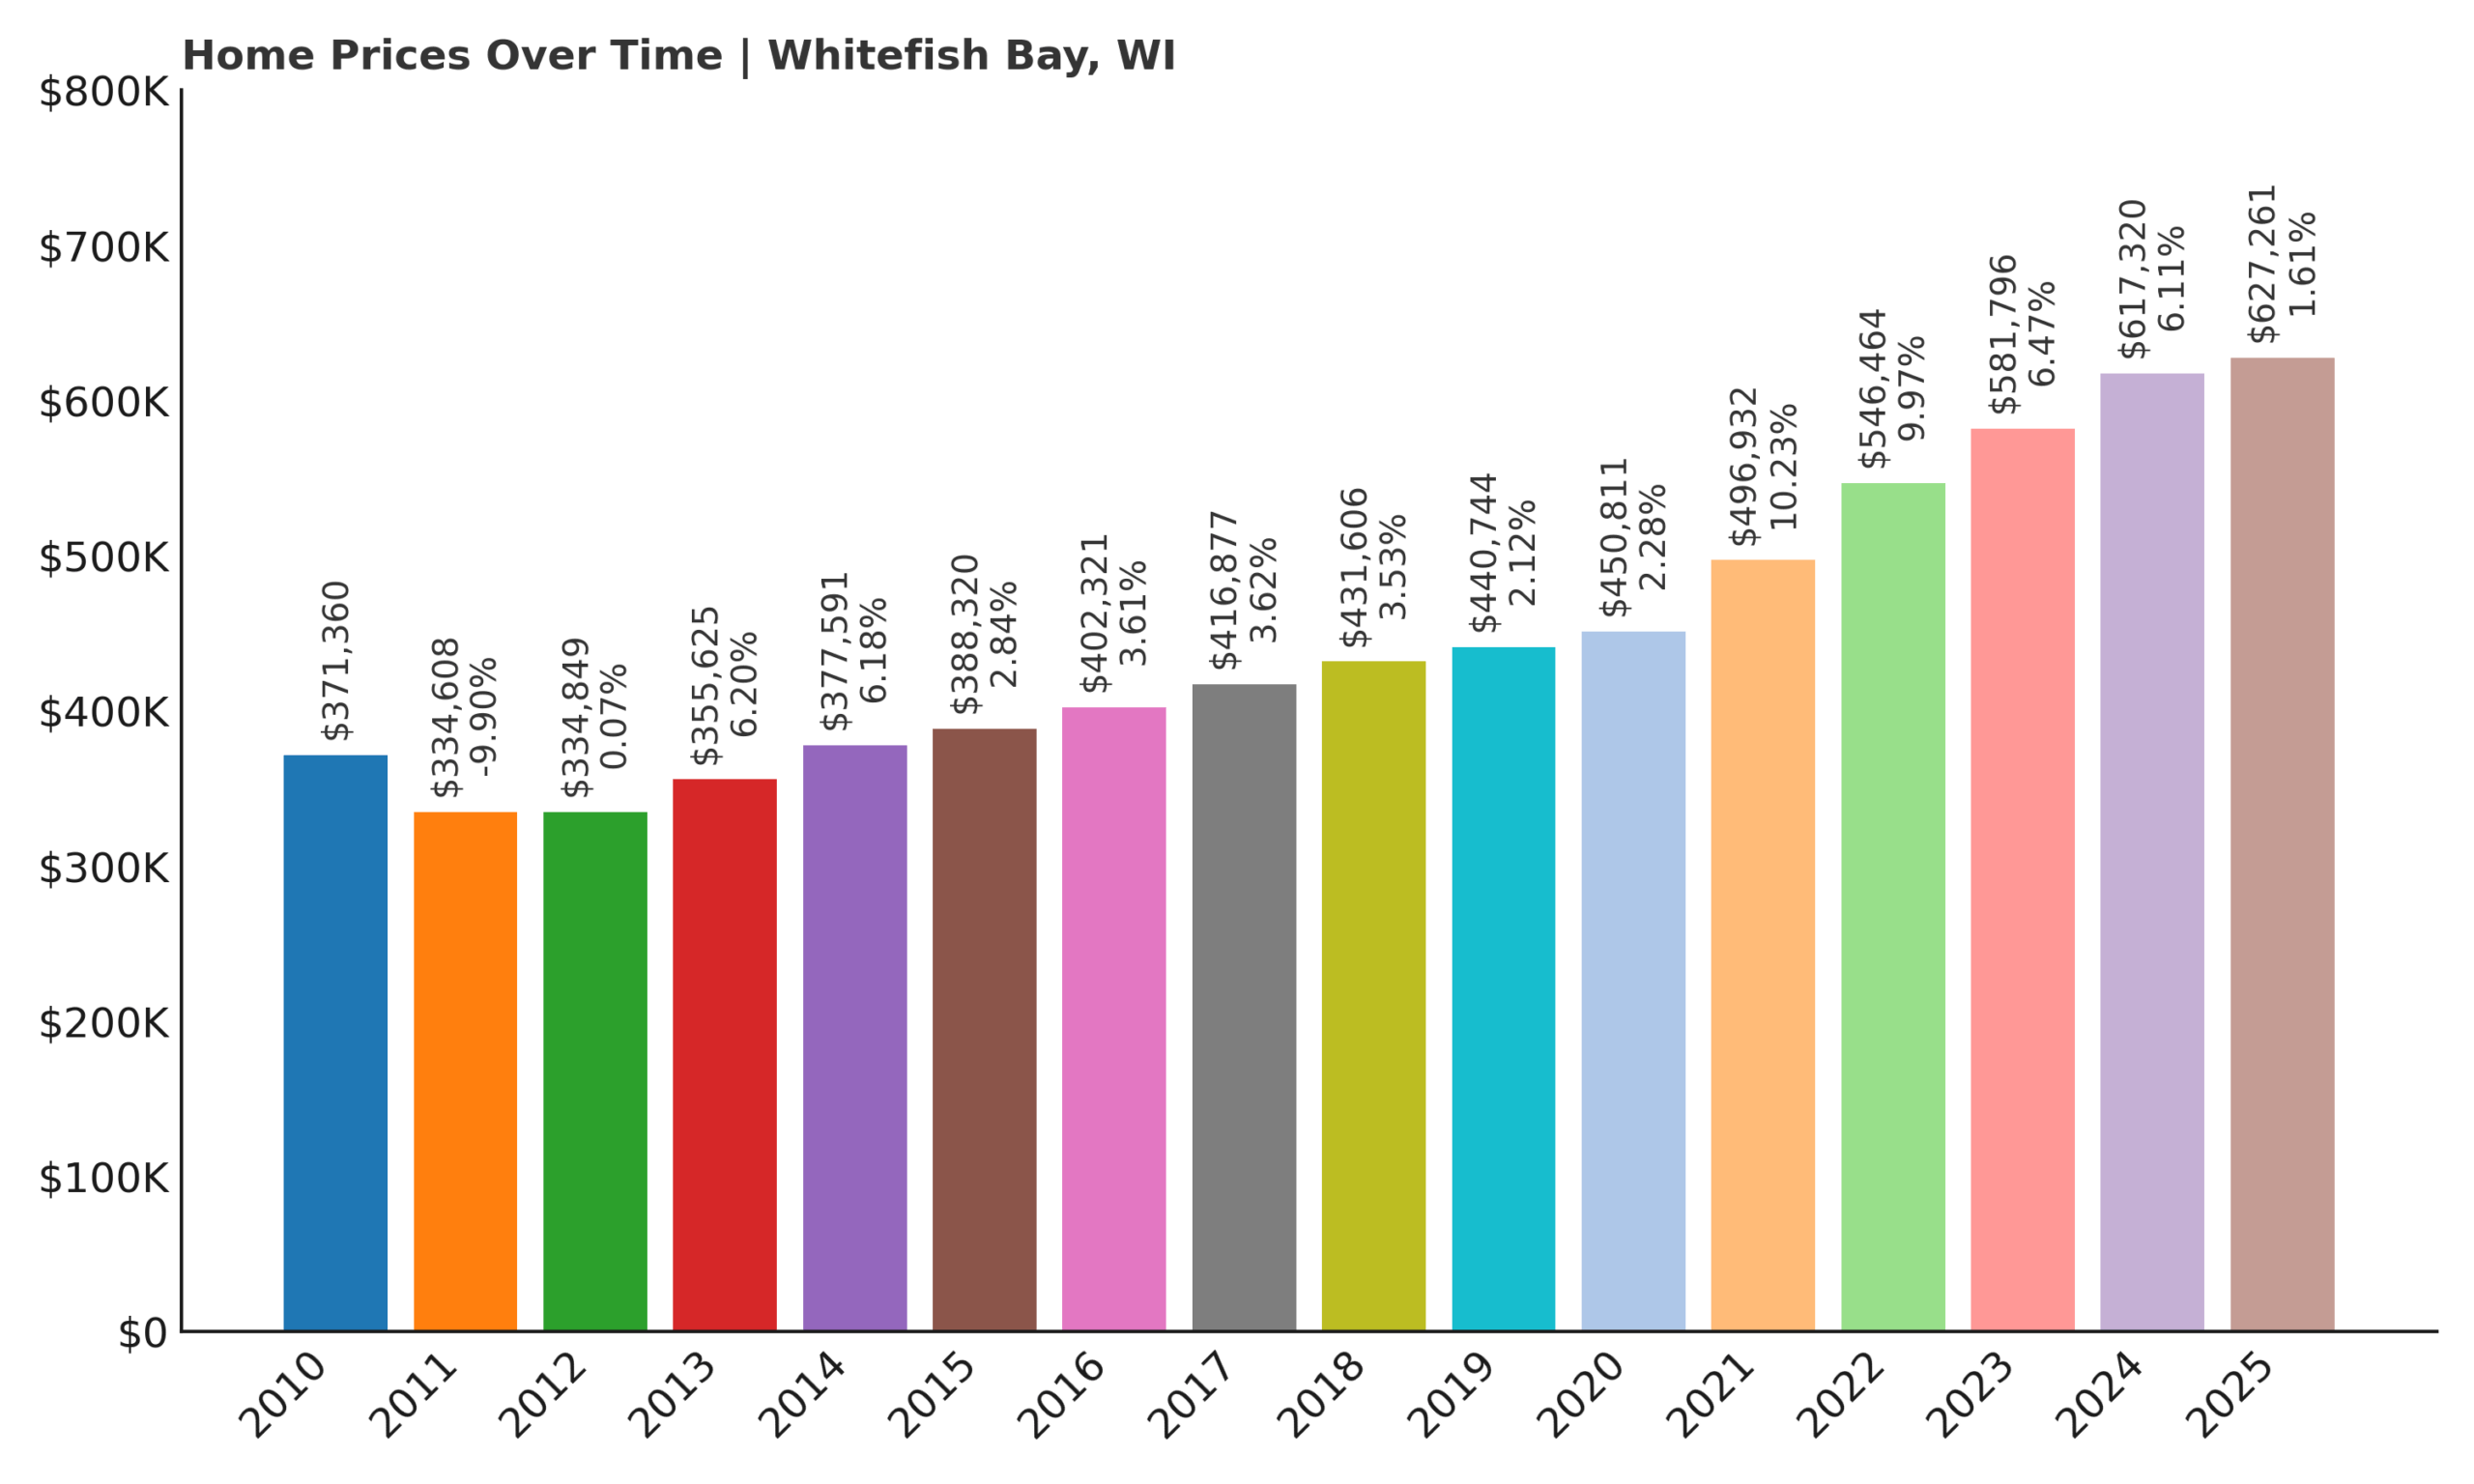
- 2010: $371,360
- 2011: $334,608 (-$36,752, -9.90% from previous year)
- 2012: $334,849 (+$241, +0.07% from previous year)
- 2013: $355,625 (+$20,776, +6.20% from previous year)
- 2014: $377,591 (+$21,965, +6.18% from previous year)
- 2015: $388,320 (+$10,730, +2.84% from previous year)
- 2016: $402,321 (+$14,001, +3.61% from previous year)
- 2017: $416,877 (+$14,556, +3.62% from previous year)
- 2018: $431,606 (+$14,729, +3.53% from previous year)
- 2019: $440,744 (+$9,138, +2.12% from previous year)
- 2020: $450,811 (+$10,067, +2.28% from previous year)
- 2021: $496,932 (+$46,121, +10.23% from previous year)
- 2022: $546,464 (+$49,532, +9.97% from previous year)
- 2023: $581,796 (+$35,332, +6.47% from previous year)
- 2024: $617,320 (+$35,523, +6.11% from previous year)
- 2025: $627,261 (+$9,941, +1.61% from previous year)
Whitefish Bay has experienced a strong and steady home value increase of 87% since 2012. While early gains were modest, the past five years have seen rapid appreciation. The pandemic-era surge pushed values up sharply, particularly in 2021 and 2022, when home prices rose by over $95,000 in just two years. In 2025, growth has slowed somewhat, but prices continue to trend upward—pointing to sustained buyer demand. With average home values now topping $627,000, Whitefish Bay comfortably ranks among Wisconsin’s most elite and expensive residential areas.
Whitefish Bay – A Premier Milwaukee Suburb

Whitefish Bay is widely recognized as one of the most desirable places to live in the Milwaukee metro area. Its lakefront views, historic homes, and walkable village center make it a standout among Wisconsin suburbs. Located just north of downtown Milwaukee, the town combines top-tier schools, tree-lined neighborhoods, and quick lake access to create a residential environment that appeals to both families and retirees. The strong community feel and carefully preserved architecture contribute to its long-standing value, helping drive consistent appreciation over the past decade.
In addition to lifestyle amenities, Whitefish Bay benefits from high demand and limited turnover. Homes here tend to stay in families for decades, and new listings attract strong interest almost immediately. The scarcity of buildable land keeps inventory tight, and demand often outpaces supply, even as prices rise. That supply constraint has been a major force behind the town’s continued appreciation, especially during hot market cycles. With stable institutions and a timeless residential appeal, Whitefish Bay is likely to remain near the top of Wisconsin’s price ladder for years to come.
15. Hartland – 86% Home Price Increase Since 2012
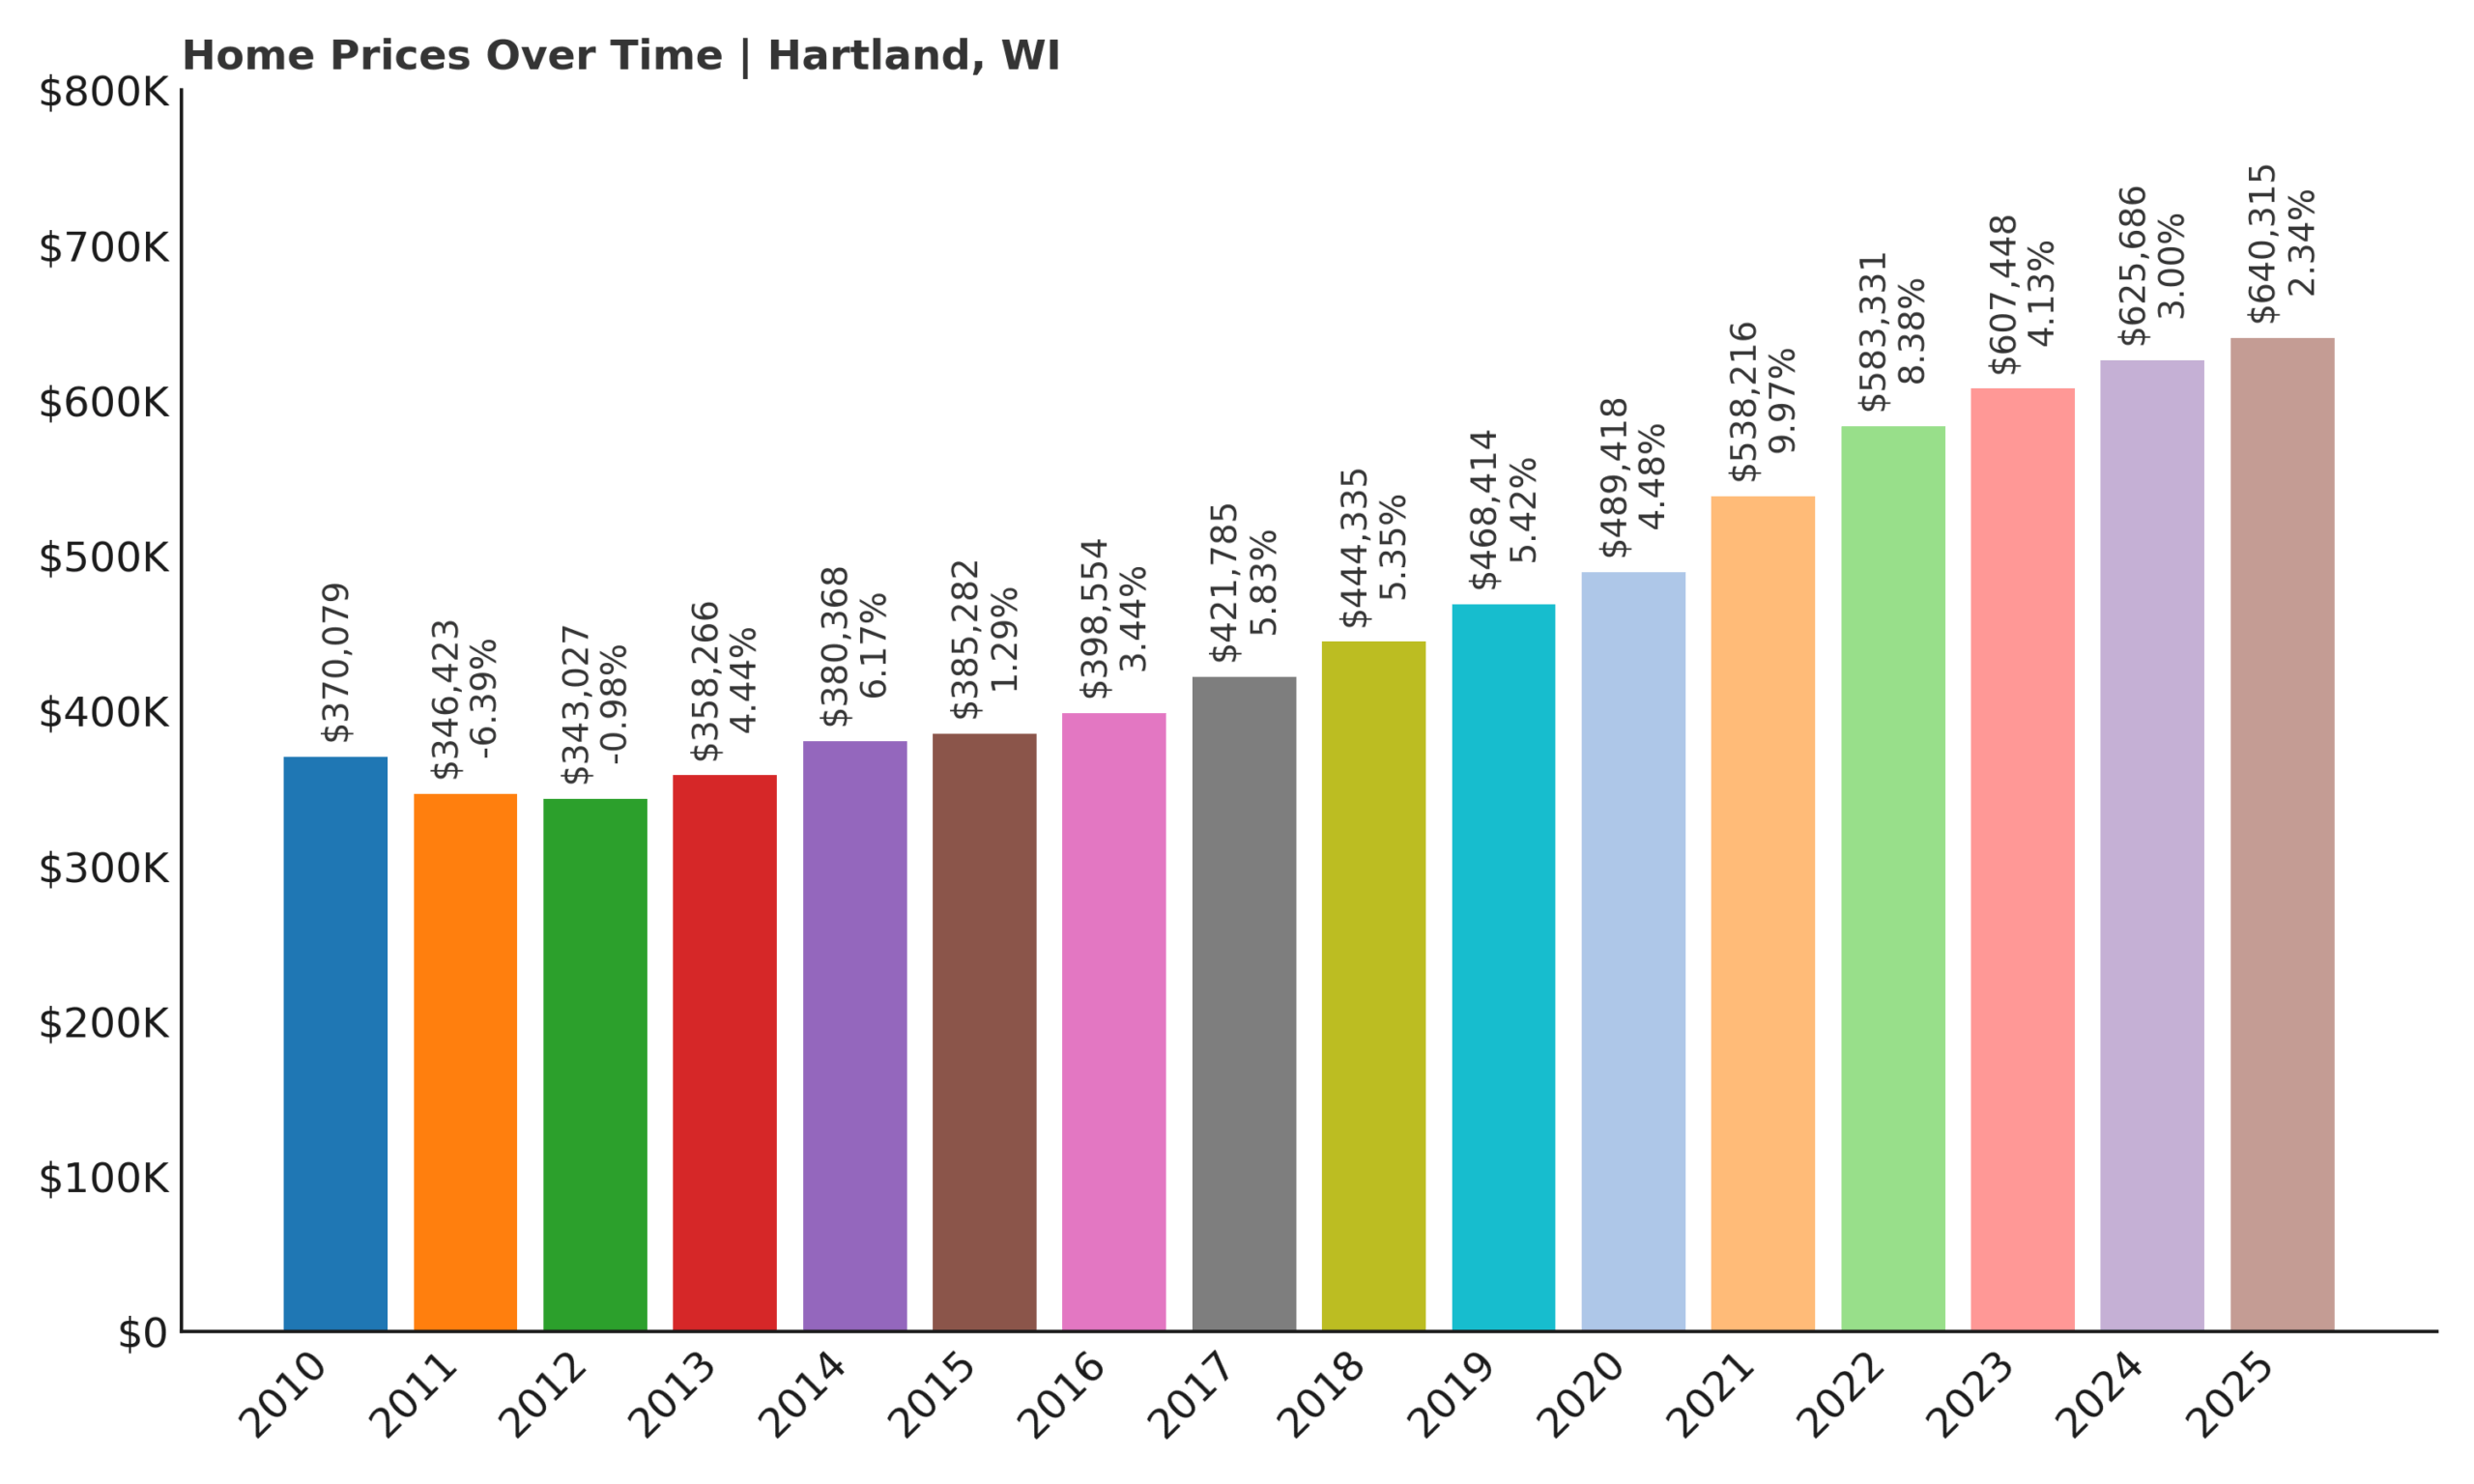
- 2010: $370,079
- 2011: $346,423 (-$23,656, -6.39% from previous year)
- 2012: $343,027 (-$3,396, -0.98% from previous year)
- 2013: $358,266 (+$15,239, +4.44% from previous year)
- 2014: $380,368 (+$22,102, +6.17% from previous year)
- 2015: $385,282 (+$4,914, +1.29% from previous year)
- 2016: $398,554 (+$13,271, +3.44% from previous year)
- 2017: $421,785 (+$23,232, +5.83% from previous year)
- 2018: $444,335 (+$22,550, +5.35% from previous year)
- 2019: $468,414 (+$24,079, +5.42% from previous year)
- 2020: $489,418 (+$21,004, +4.48% from previous year)
- 2021: $538,216 (+$48,798, +9.97% from previous year)
- 2022: $583,331 (+$45,115, +8.38% from previous year)
- 2023: $607,448 (+$24,116, +4.13% from previous year)
- 2024: $625,686 (+$18,239, +3.00% from previous year)
- 2025: $640,315 (+$14,629, +2.34% from previous year)
Hartland’s housing market has grown steadily over the last 13 years, with prices climbing 86% since 2012. Annual growth rates have remained consistent, especially during 2016 to 2022, when prices increased by tens of thousands each year. The largest jump occurred in 2021, when homes appreciated by nearly $49,000—a clear sign of surging interest during the peak of the post-pandemic housing boom. Even though the pace has eased in 2024 and 2025, the continued upward trend confirms Hartland’s position among the state’s high-value communities.
Hartland – Family-Friendly Living with Lasting Appeal

Nestled in Waukesha County’s Lake Country region, Hartland combines small-town charm with proximity to major employers and highly rated schools. The town offers quick access to I-94, making it an attractive spot for professionals commuting to Milwaukee, Brookfield, or even Madison. With beautiful parks, community events, and top-performing schools in the Arrowhead School District, Hartland has become a magnet for families looking to settle in a place with long-term livability. This combination of lifestyle quality and convenience has played a major role in the town’s sustained property value growth.
Much of Hartland’s appeal lies in its neighborhood character—well-maintained homes, tree-lined streets, and a mix of modern and historic housing stock. The real estate market here is competitive, but it’s also dependable. New builds have been carefully integrated without overwhelming the town’s scale, preserving a sense of continuity that residents value. As buyers continue to seek space, safety, and schools, Hartland is likely to maintain both its desirability and its high property values moving forward.
14. Mequon – 60% Home Price Increase Since 2012
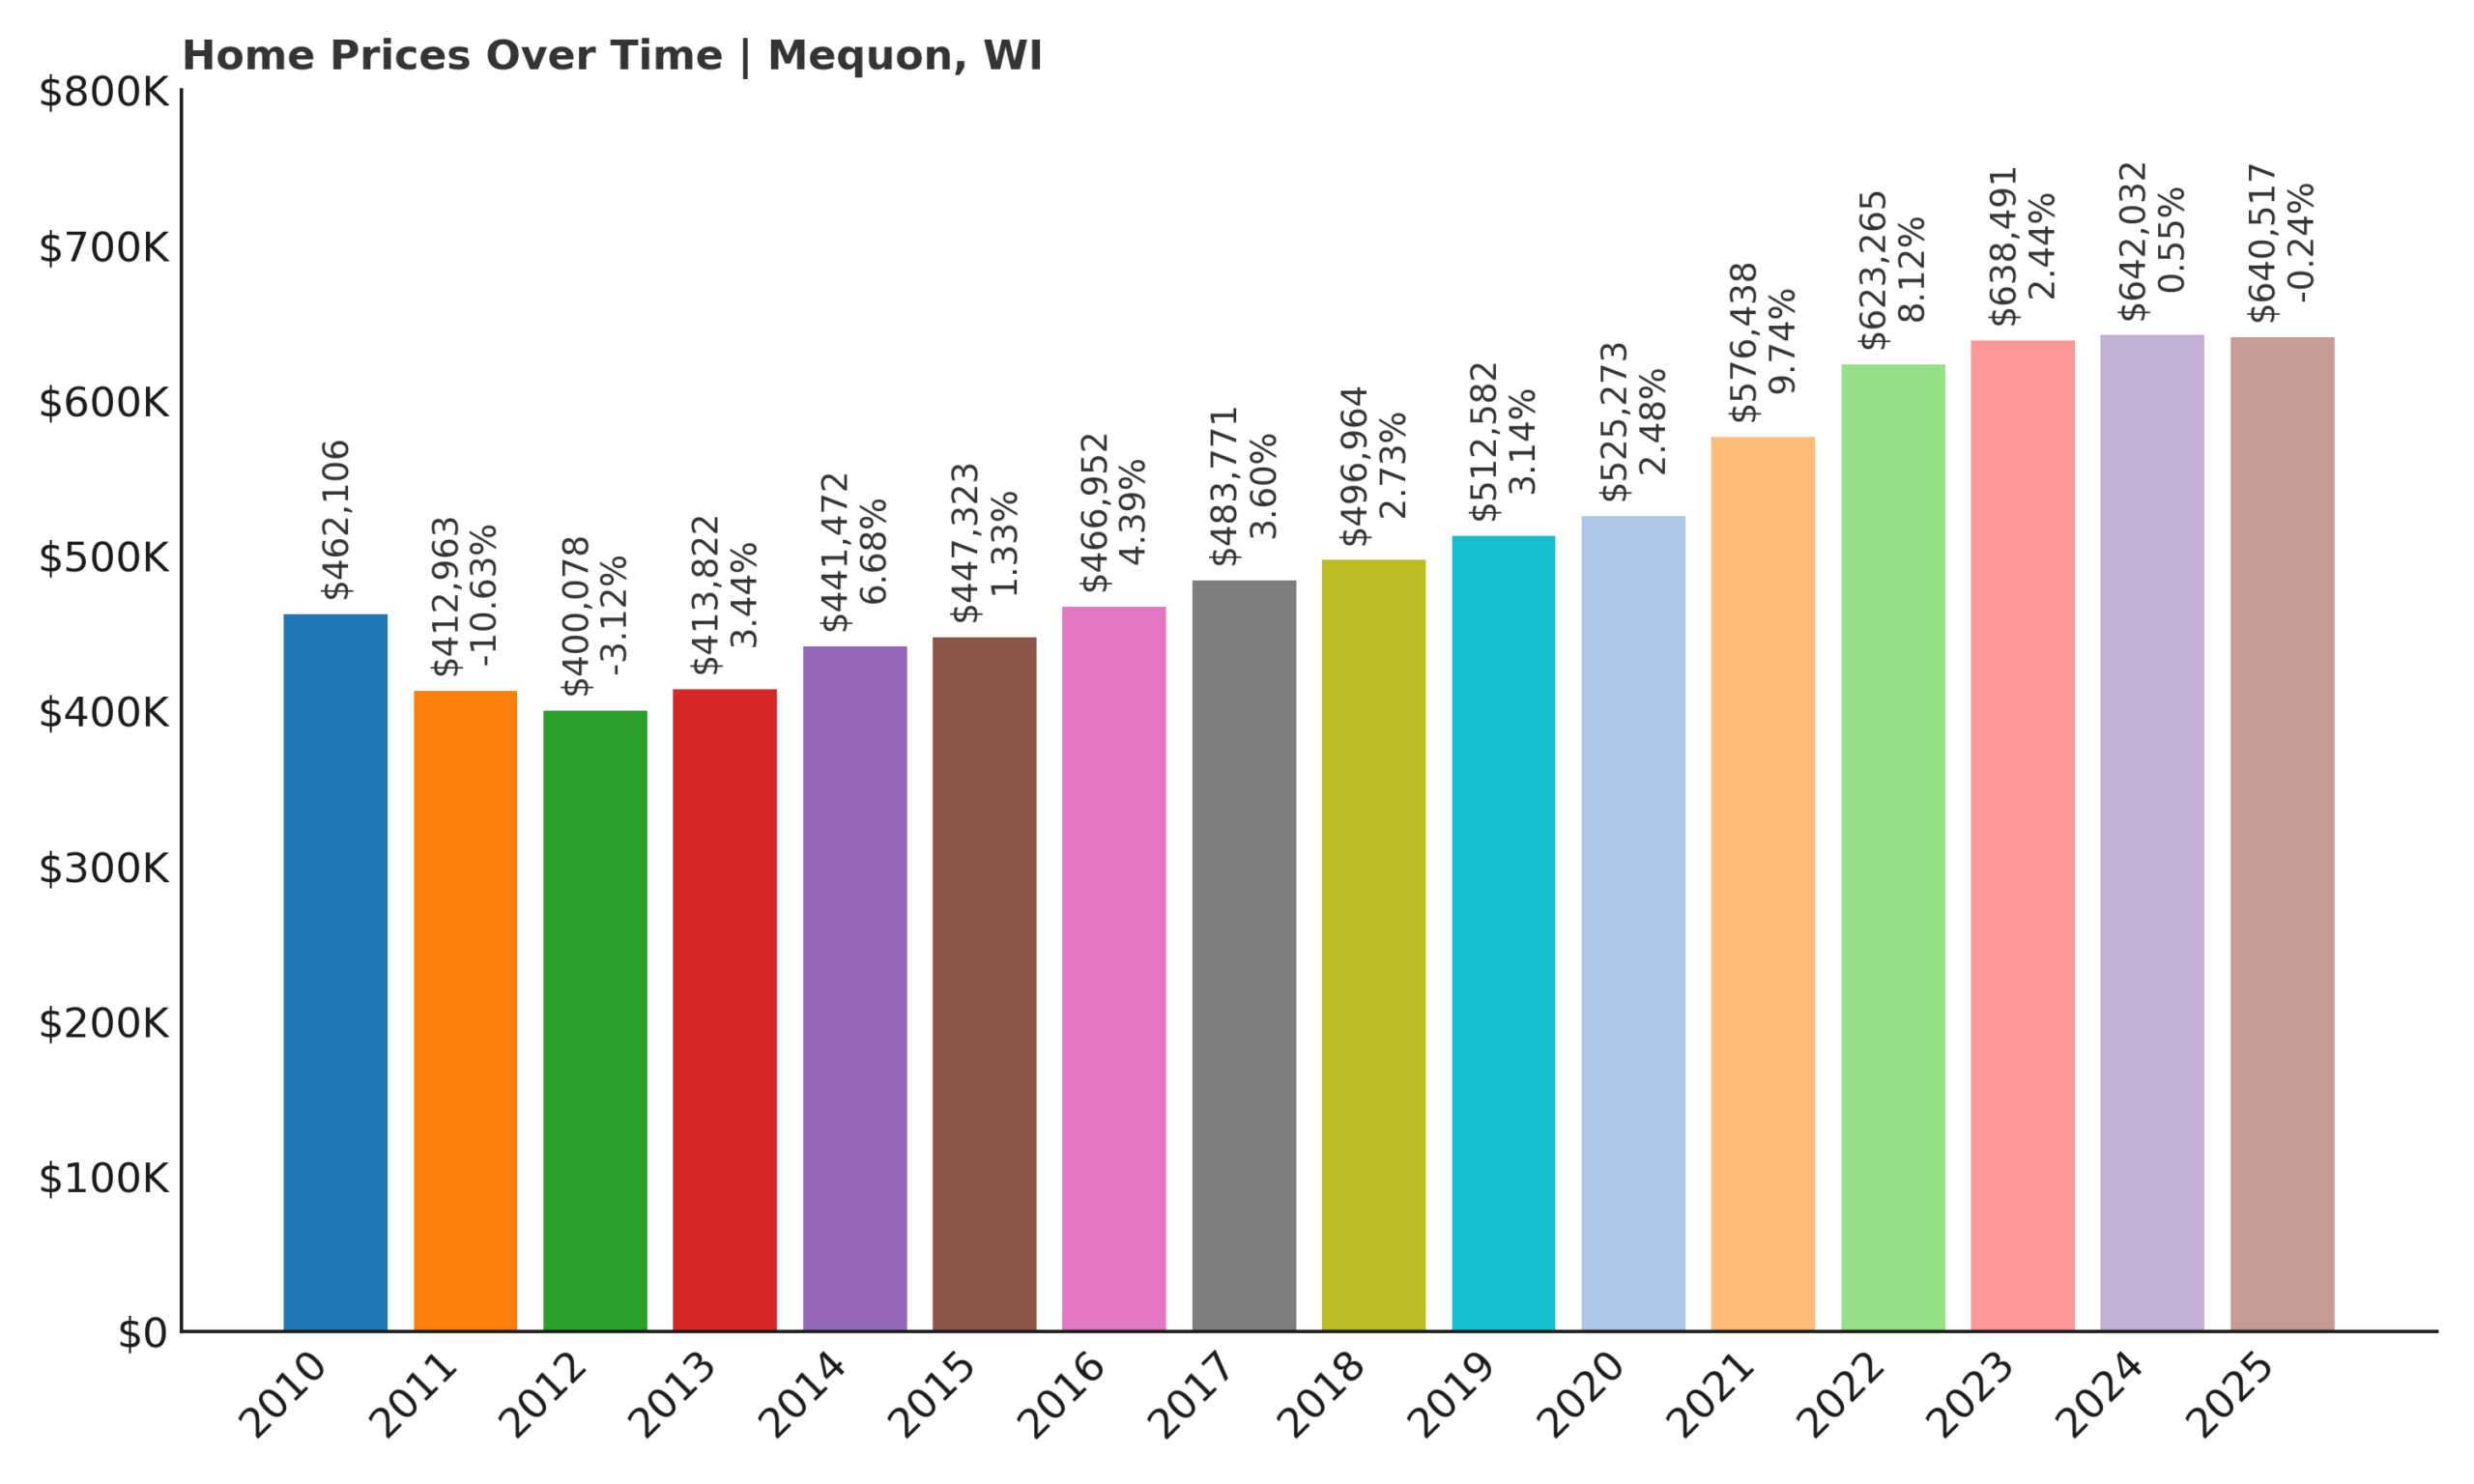
- 2010: $462,106
- 2011: $412,963 (-$49,143, -10.63% from previous year)
- 2012: $400,078 (-$12,884, -3.12% from previous year)
- 2013: $413,822 (+$13,744, +3.44% from previous year)
- 2014: $441,472 (+$27,650, +6.68% from previous year)
- 2015: $447,323 (+$5,851, +1.33% from previous year)
- 2016: $466,952 (+$19,629, +4.39% from previous year)
- 2017: $483,771 (+$16,819, +3.60% from previous year)
- 2018: $496,964 (+$13,193, +2.73% from previous year)
- 2019: $512,582 (+$15,618, +3.14% from previous year)
- 2020: $525,273 (+$12,691, +2.48% from previous year)
- 2021: $576,438 (+$51,165, +9.74% from previous year)
- 2022: $623,265 (+$46,827, +8.12% from previous year)
- 2023: $638,491 (+$15,226, +2.44% from previous year)
- 2024: $642,032 (+$3,541, +0.55% from previous year)
- 2025: $640,517 (-$1,514, -0.24% from previous year)
Mequon has seen a 60% rise in home values since 2012, though the trajectory hasn’t been as smooth as in some other towns on this list. After bottoming out in 2012, prices began a slow and steady recovery, picking up steam between 2020 and 2022 when values jumped by over $100,000. Since then, the rate of growth has slowed considerably, and 2025 marks a slight decrease. Still, average prices are now above $640,000, and the town’s long-term performance keeps it firmly planted among Wisconsin’s most expensive communities.
Mequon – Prestige and Space on Milwaukee’s North Shore

Mequon has long been known as one of the most affluent suburbs of Milwaukee, offering a mix of spacious homes, wooded lots, and lakefront estates. Located in Ozaukee County, it stretches along the western shore of Lake Michigan and features a mix of historic properties and custom-built homes. The town is notable for its quiet, spread-out residential areas and strong zoning protections that limit dense development, preserving the upscale, semi-rural atmosphere that buyers here expect. The area’s top-rated schools and easy access to I-43 add to its appeal, particularly for families and professionals who want high-end living with room to breathe.
Much of Mequon’s housing demand comes from repeat buyers trading up in the market—many of whom are looking for homes over $500,000 with architectural character or modern upgrades. While 2025 has seen a small dip in values, the broader trend remains upward, and inventory remains tight. Mequon’s high cost of entry and desirable amenities mean it consistently attracts high-income households and long-term residents. These characteristics make short-term fluctuations less relevant in the big picture—Mequon remains a bellwether for the region’s luxury residential sector.
13. Fontana – 99% Home Price Increase Since 2012
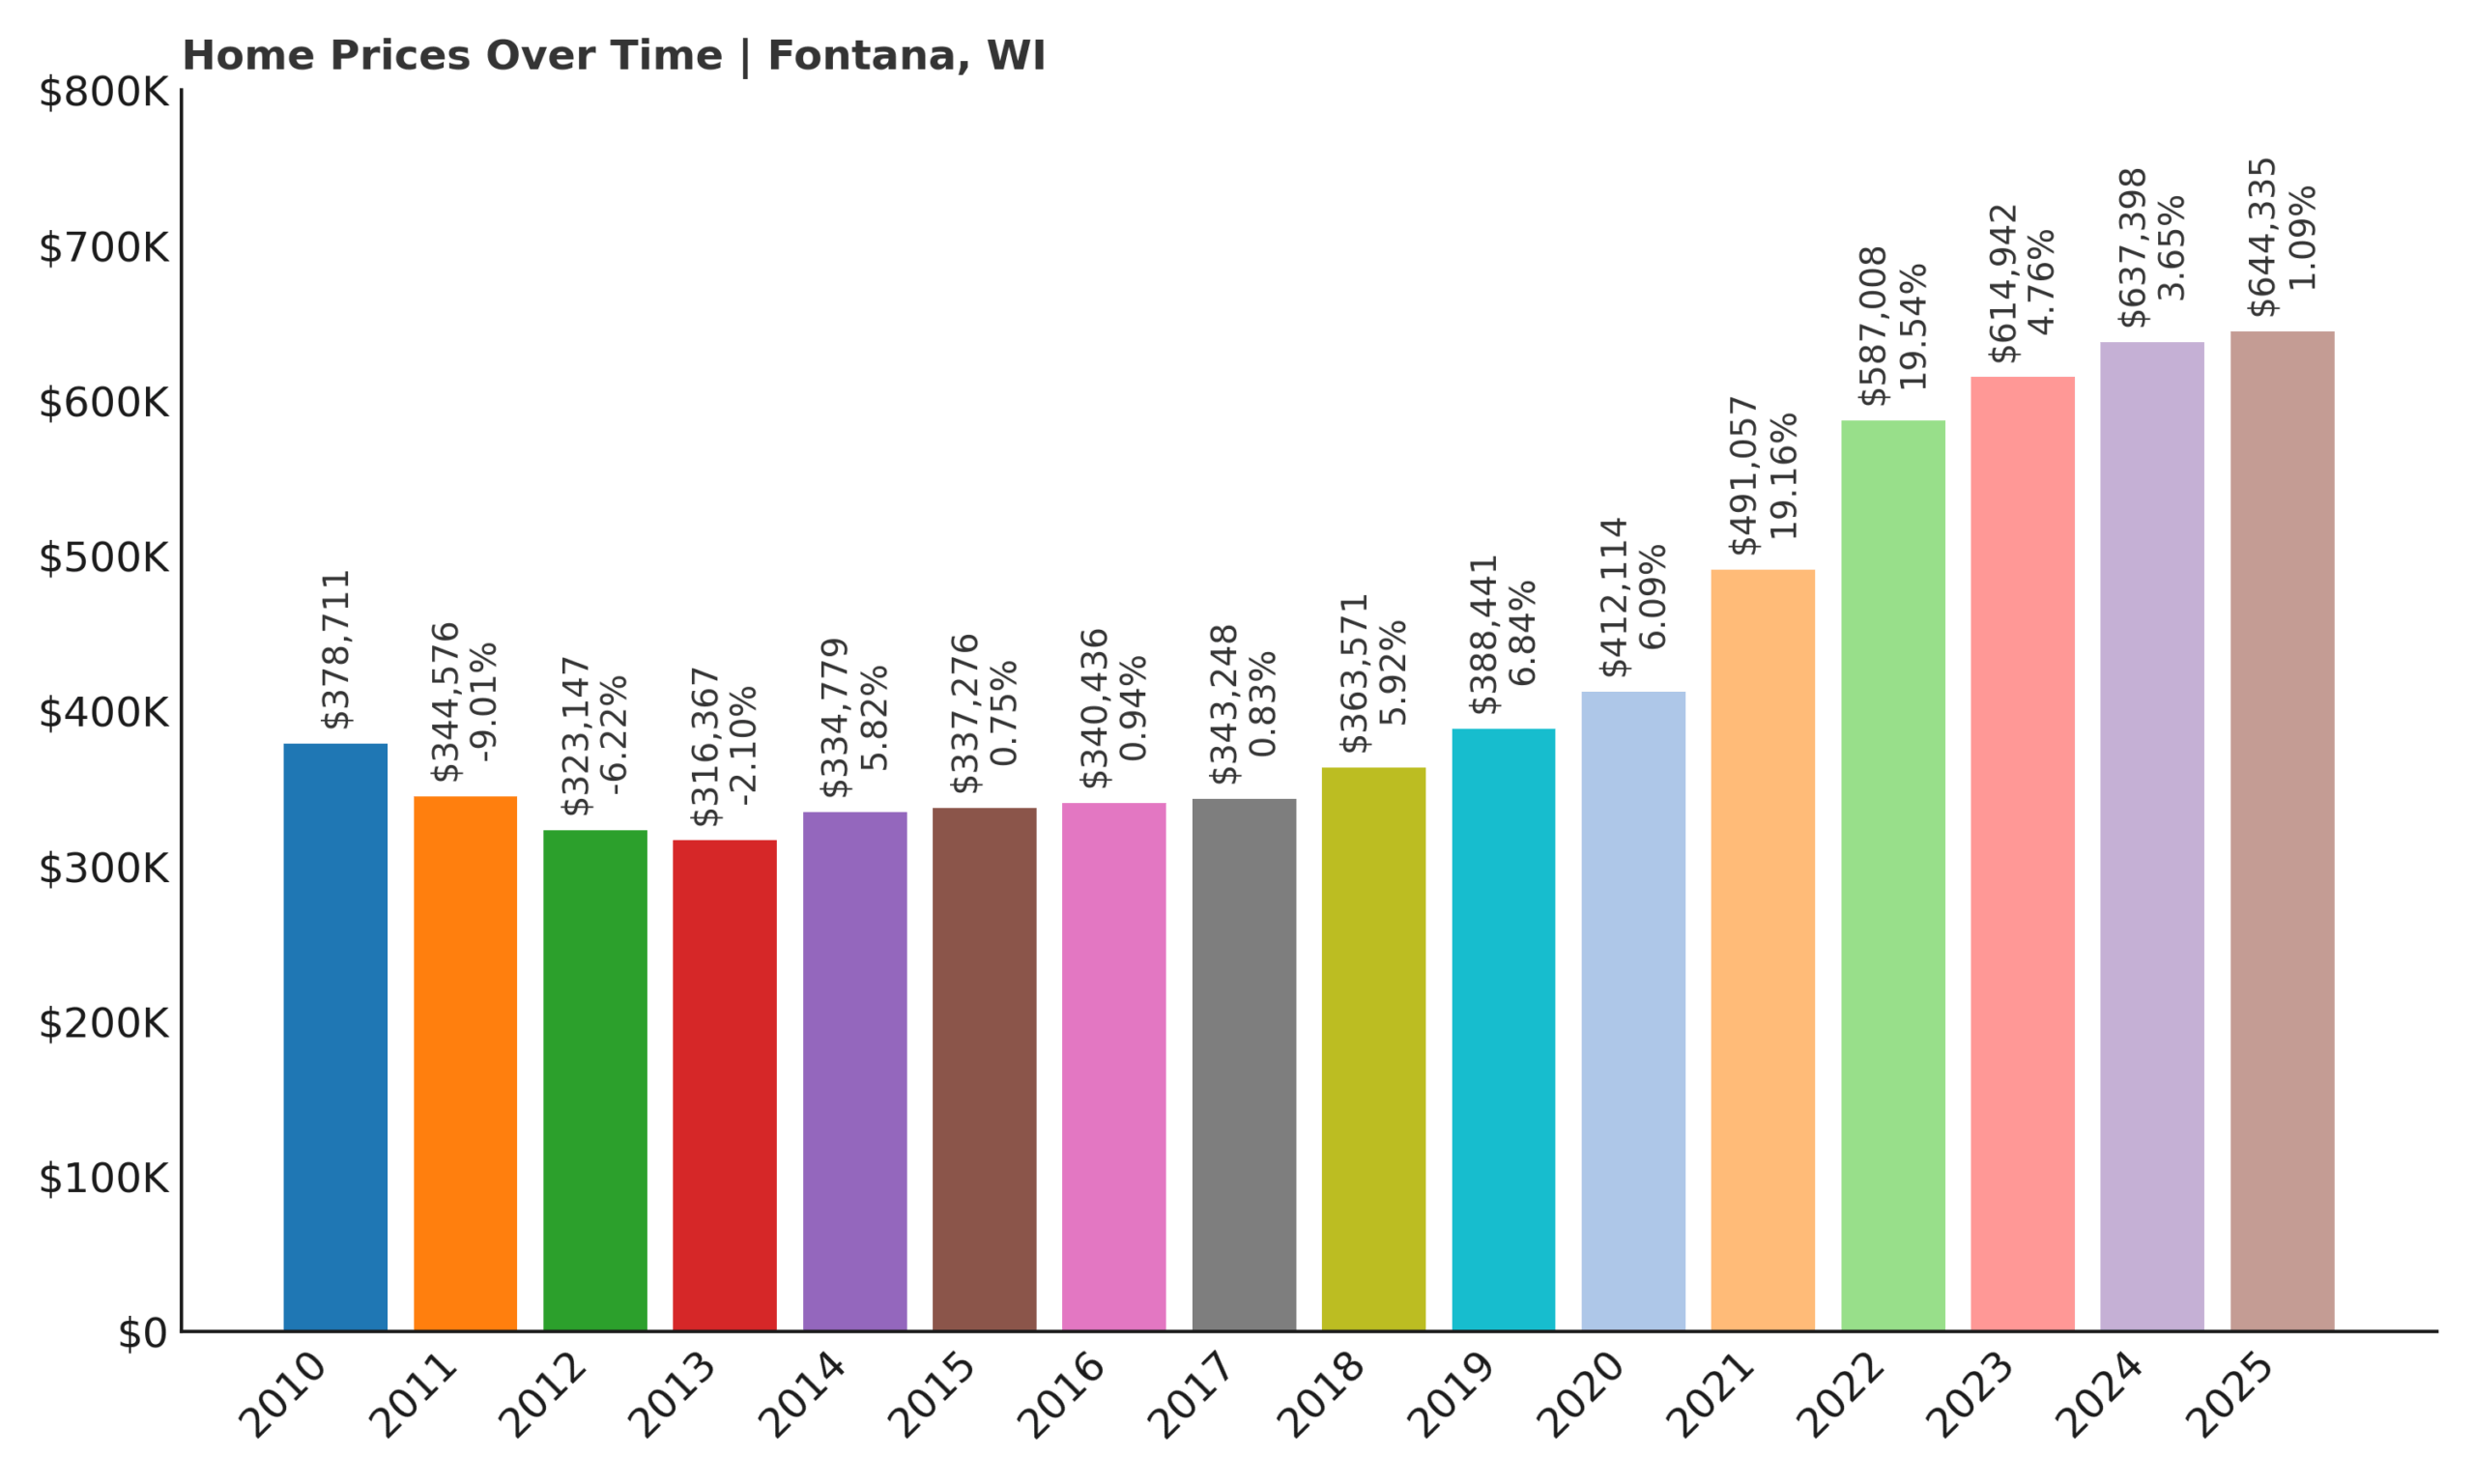
- 2010: $378,711
- 2011: $344,576 (-$34,136, -9.01% from previous year)
- 2012: $323,147 (-$21,428, -6.22% from previous year)
- 2013: $316,367 (-$6,780, -2.10% from previous year)
- 2014: $334,779 (+$18,412, +5.82% from previous year)
- 2015: $337,276 (+$2,497, +0.75% from previous year)
- 2016: $340,436 (+$3,160, +0.94% from previous year)
- 2017: $343,248 (+$2,812, +0.83% from previous year)
- 2018: $363,571 (+$20,322, +5.92% from previous year)
- 2019: $388,441 (+$24,871, +6.84% from previous year)
- 2020: $412,114 (+$23,673, +6.09% from previous year)
- 2021: $491,057 (+$78,942, +19.16% from previous year)
- 2022: $587,008 (+$95,951, +19.54% from previous year)
- 2023: $614,942 (+$27,934, +4.76% from previous year)
- 2024: $637,398 (+$22,456, +3.65% from previous year)
- 2025: $644,335 (+$6,938, +1.09% from previous year)
Fontana’s housing market has surged 99% since 2012, with prices nearly doubling over that period. After a rocky start in the early 2010s, when values dropped sharply, the town saw steady increases throughout the latter half of the decade. But it was 2021 and 2022 that truly propelled Fontana to the top tier—home values jumped by nearly $175,000 in just two years. Though 2025 shows modest growth, Fontana remains one of Wisconsin’s most desirable resort-style markets, especially for second-home buyers and retirees.
Fontana – Lake Geneva’s Quiet Western Shore

Fontana sits on the western edge of Geneva Lake in Walworth County, offering a slightly quieter but still highly sought-after alternative to more tourist-heavy towns like Lake Geneva itself. Its shoreline features a mix of luxury condos, classic lake cottages, and sprawling modern estates. The village is popular with Chicagoans looking for weekend homes and investors drawn to the area’s rental potential. The Abbey Resort and Marina also make it a destination for boaters and vacationers, keeping the real estate market competitive even in slower years.
✅ Hotel #1
✅ Hotel #2
✅ Hotel #3
AN-APP-MAR19.jpg” alt=”Get pre-approved for home equity loan” width=”1628″ height=”742″>
While many lake towns see extreme seasonal price swings, Fontana has proven surprisingly steady in recent years. Limited land availability and a tight cap on new development have created a supply ceiling, while buyer demand continues to push values upward. Even though the pandemic boosted prices in many lake communities, Fontana’s upward trend started earlier and has proven durable. As of 2025, the average home price exceeds $640,000—remarkable for a town of its size and a sign of just how valuable lake access has become in southern Wisconsin.
12. Elm Grove – 103% Home Price Increase Since 2012
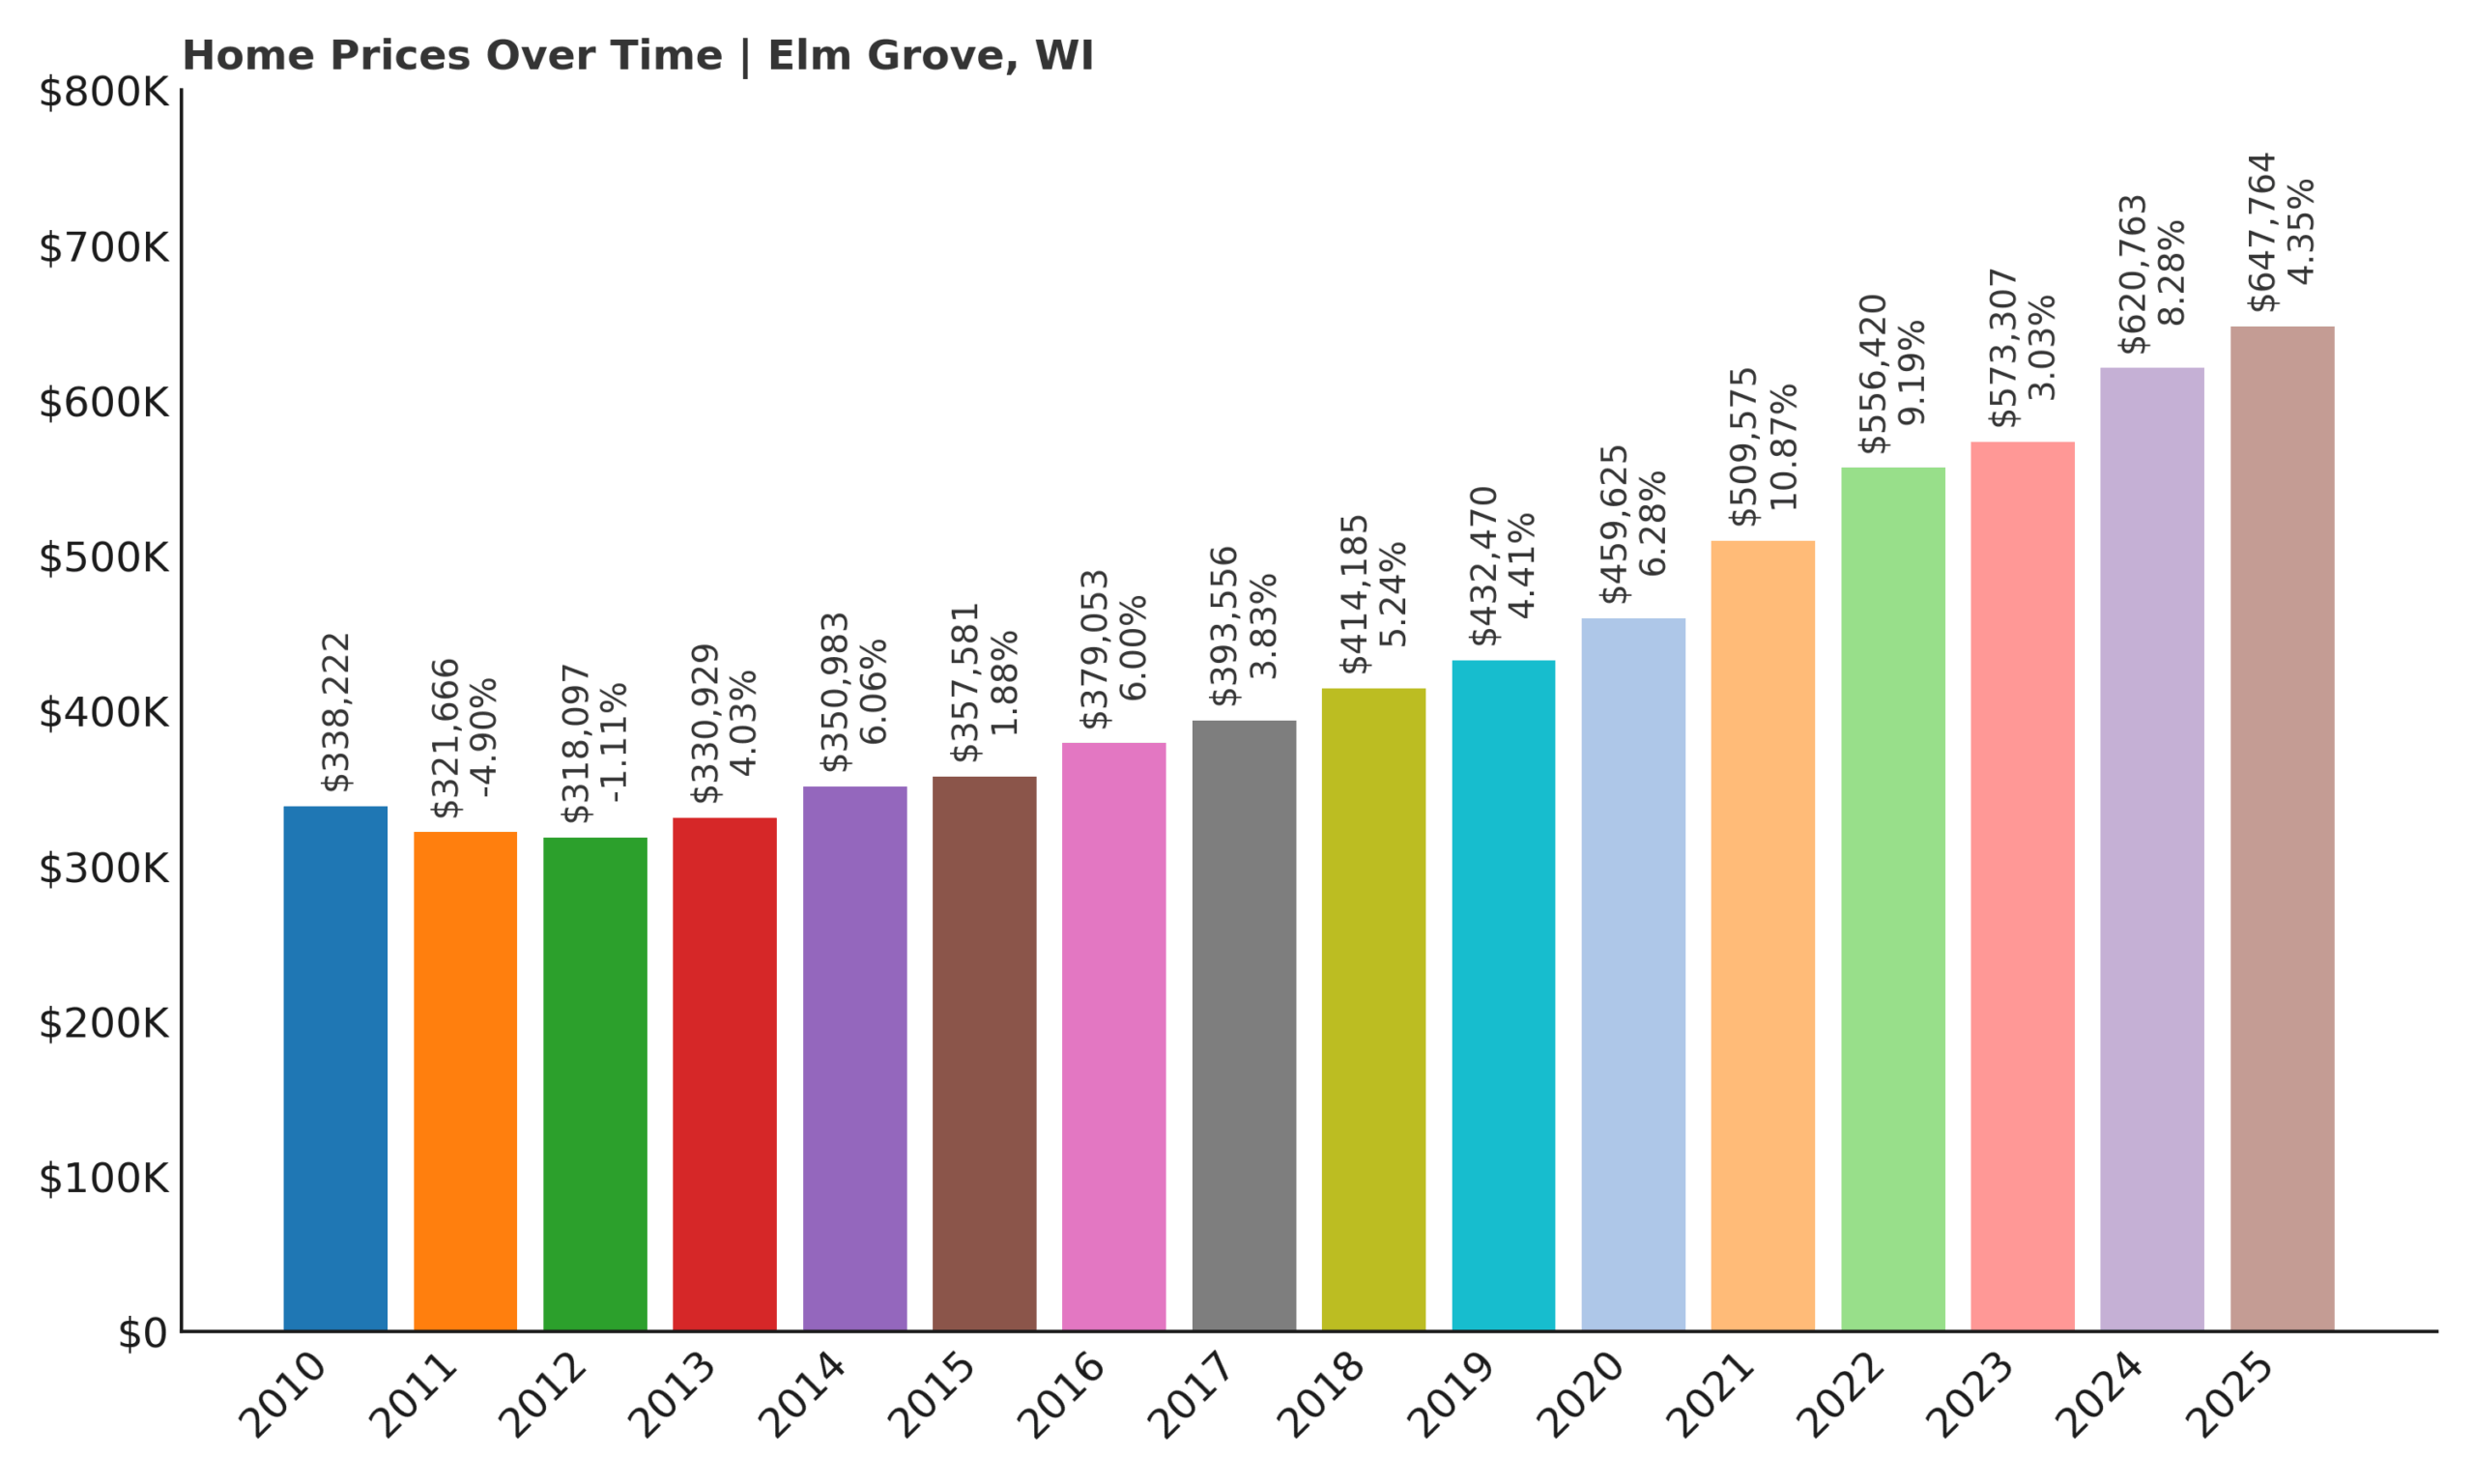
- 2010: $338,222
- 2011: $321,666 (-$16,557, -4.90% from previous year)
- 2012: $318,097 (-$3,569, -1.11% from previous year)
- 2013: $330,929 (+$12,832, +4.03% from previous year)
- 2014: $350,983 (+$20,054, +6.06% from previous year)
- 2015: $357,581 (+$6,598, +1.88% from previous year)
- 2016: $379,053 (+$21,472, +6.00% from previous year)
- 2017: $393,556 (+$14,503, +3.83% from previous year)
- 2018: $414,185 (+$20,629, +5.24% from previous year)
- 2019: $432,470 (+$18,285, +4.41% from previous year)
- 2020: $459,625 (+$27,155, +6.28% from previous year)
- 2021: $509,575 (+$49,950, +10.87% from previous year)
- 2022: $556,420 (+$46,845, +9.19% from previous year)
- 2023: $573,307 (+$16,887, +3.03% from previous year)
- 2024: $620,763 (+$47,456, +8.28% from previous year)
- 2025: $647,764 (+$27,001, +4.35% from previous year)
Elm Grove’s home values have jumped by more than 103% since 2012, one of the strongest performances on this list. Most of the town’s growth has been steady and sustained, with only a few standout years like 2021 and 2024 showing major spikes. The town’s home values now average over $647,000, and 2025 marks another strong year of appreciation. With a long track record of stability, Elm Grove continues to reward buyers who invested early and attracts new homeowners looking for top-tier suburban living.
Elm Grove – Quiet Elegance in Waukesha County

Elm Grove is a small, upscale suburb just west of Milwaukee known for its manicured streets, excellent schools, and elegant housing stock. Despite its proximity to city amenities, the village has retained its distinct character and small-town charm. Local ordinances encourage lower-density development and architectural cohesion, keeping property values high. The commercial center is compact and walkable, centered around a handful of well-loved businesses, which only adds to the community-oriented atmosphere that makes Elm Grove such a desirable address.
One of the few suburbs in the region where large lots, custom homes, and a top-rated school district intersect, Elm Grove continues to perform exceptionally well in both strong and soft housing markets. The combination of limited inventory, long-term residents, and high-income buyers has kept price appreciation strong. Even in a slowing statewide market, 2025 brought another $27,000 in average value gains. With no signs of overbuilding and consistent buyer interest, Elm Grove continues to shine as one of southeastern Wisconsin’s most prized residential communities.
11. Manitowish Waters – 118% Home Price Increase Since 2012

- 2010: N/A
- 2011: N/A
- 2012: $299,834
- 2013: $295,830 (-$4,004, -1.34% from previous year)
- 2014: $361,935 (+$66,106, +22.35% from previous year)
- 2015: $436,930 (+$74,995, +20.72% from previous year)
- 2016: $423,596 (-$13,335, -3.05% from previous year)
- 2017: $423,564 (-$32, -0.01% from previous year)
- 2018: $437,124 (+$13,560, +3.20% from previous year)
- 2019: $449,383 (+$12,260, +2.80% from previous year)
- 2020: $463,796 (+$14,412, +3.21% from previous year)
- 2021: $520,611 (+$56,815, +12.25% from previous year)
- 2022: $631,402 (+$110,791, +21.28% from previous year)
- 2023: $642,187 (+$10,785, +1.71% from previous year)
- 2024: $655,465 (+$13,278, +2.07% from previous year)
- 2025: $654,331 (-$1,134, -0.17% from previous year)
Home prices in Manitowish Waters have surged 118% since 2012, with particularly dramatic gains during the mid-2010s and again in 2021–2022. Price appreciation here has outpaced many larger towns, largely thanks to the area’s appeal as a lakeside haven with tight inventory and high-end vacation properties. While 2025 saw a marginal dip, prices remain well above their pre-2020 levels, cementing Manitowish Waters as one of northern Wisconsin’s most expensive housing markets.
Manitowish Waters – Luxury and Leisure in the Northwoods

Tucked deep into Wisconsin’s Northwoods, Manitowish Waters is known for its pristine chain of lakes, recreational tourism, and rustic luxury appeal. The town is dotted with cabins, lodges, and lakefront estates, making it a magnet for affluent buyers looking for vacation homes with natural beauty and seclusion. The area offers year-round outdoor activities—from boating and fishing in summer to snowmobiling in winter—which helps drive a steady stream of interest from buyers across the Midwest. With limited land for development and strong second-home demand, prices here tend to be high and inventory turns quickly.
What sets Manitowish Waters apart is the stability of its high-end market. Unlike flashier resort towns, this area thrives on quiet affluence and multi-generational ownership. Many properties rarely change hands, and new construction is limited by environmental regulations and zoning. These factors keep the housing supply tight and price pressure high. Even as growth cooled in 2025, average home values remain over $650,000—extraordinary for a remote town. As long as lakefront property remains scarce and lifestyle-driven demand continues, Manitowish Waters is likely to stay firmly among Wisconsin’s most elite markets.
10. Springfield – 95% Home Price Increase Since 2012
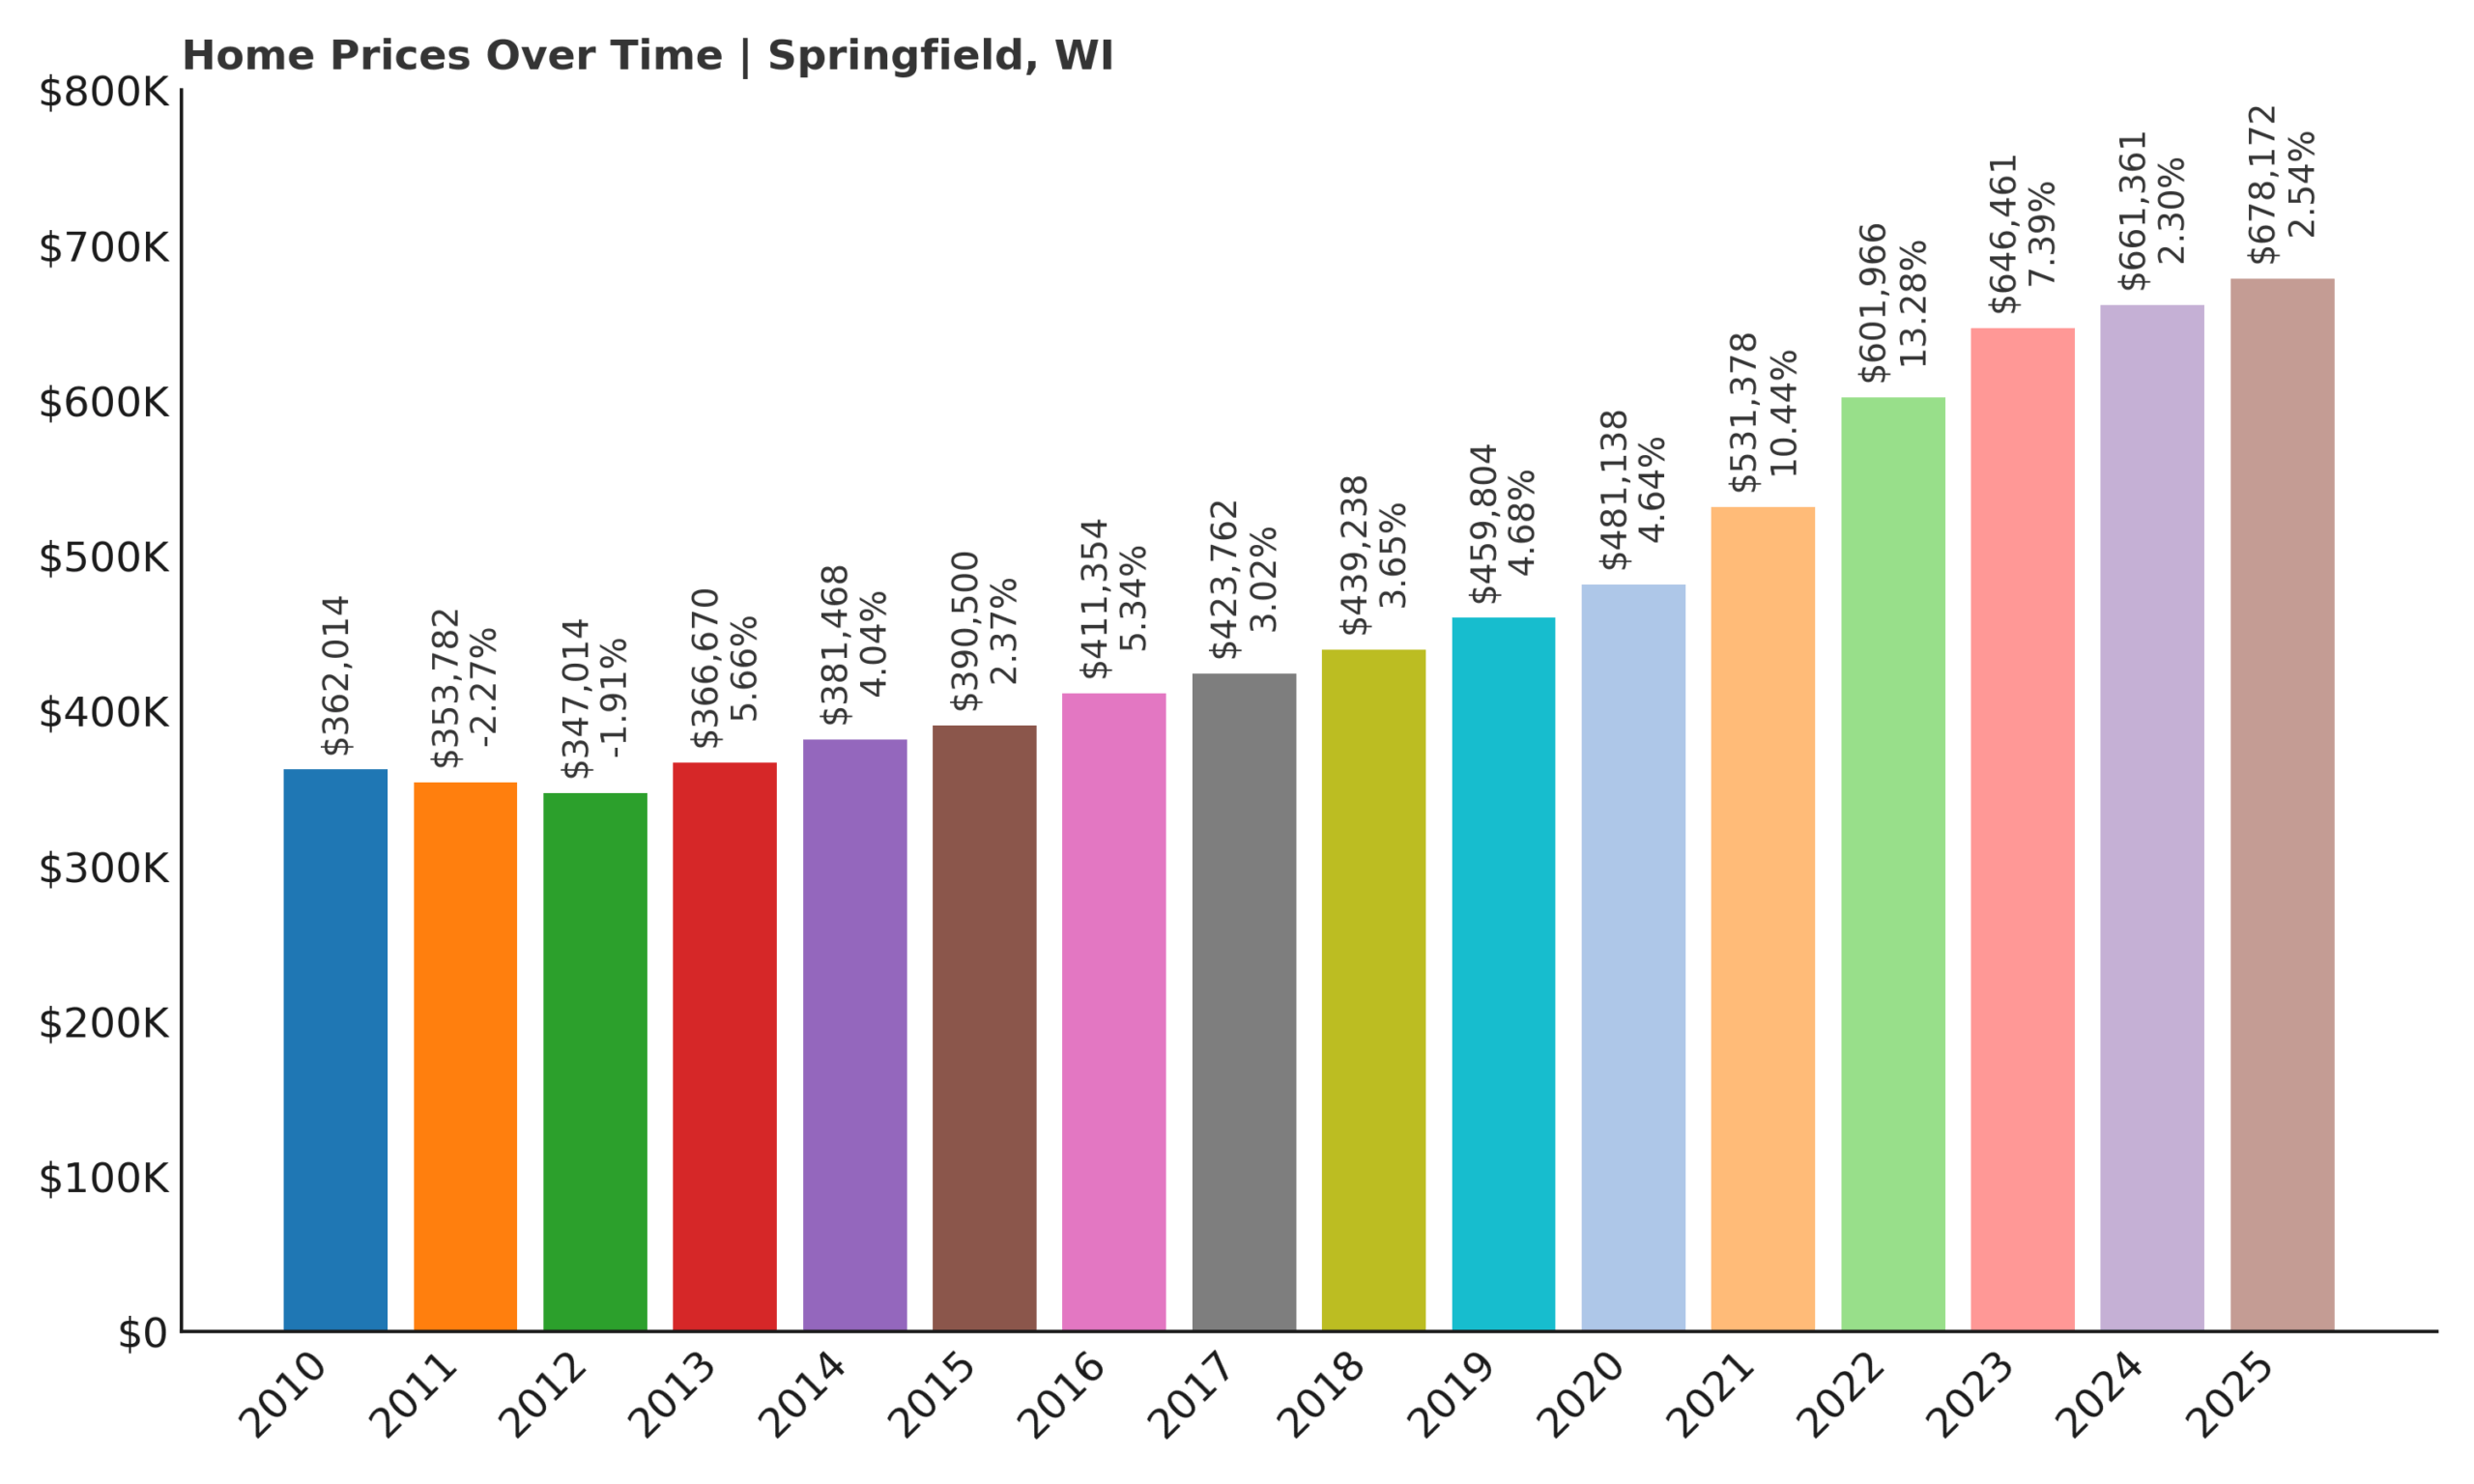
- 2010: $362,014
- 2011: $353,782 (-$8,233, -2.27% from previous year)
- 2012: $347,014 (-$6,768, -1.91% from previous year)
- 2013: $366,670 (+$19,656, +5.66% from previous year)
- 2014: $381,468 (+$14,797, +4.04% from previous year)
- 2015: $390,500 (+$9,033, +2.37% from previous year)
- 2016: $411,354 (+$20,854, +5.34% from previous year)
- 2017: $423,762 (+$12,408, +3.02% from previous year)
- 2018: $439,238 (+$15,476, +3.65% from previous year)
- 2019: $459,804 (+$20,566, +4.68% from previous year)
- 2020: $481,138 (+$21,333, +4.64% from previous year)
- 2021: $531,378 (+$50,241, +10.44% from previous year)
- 2022: $601,966 (+$70,587, +13.28% from previous year)
- 2023: $646,461 (+$44,495, +7.39% from previous year)
- 2024: $661,361 (+$14,900, +2.30% from previous year)
- 2025: $678,172 (+$16,811, +2.54% from previous year)
Springfield has seen home prices rise 95% since 2012, thanks to a long stretch of reliable appreciation and a major surge in the early 2020s. Between 2020 and 2022 alone, prices jumped by nearly $120,000, a sign of the town’s growing draw for high-income buyers. Although more recent gains have slowed, the market remains strong, and Springfield continues to command prices near $680,000 as of 2025.
Springfield – A High-Value Suburb with Quiet Strength

Located in Dane County, Springfield sits northwest of Madison and is part of the area’s outer suburban fringe. What distinguishes Springfield is its balance of open space and proximity to Wisconsin’s capital. The town features large lots, a semi-rural vibe, and a mix of traditional homes and upscale custom builds. It appeals to buyers looking to escape the city without sacrificing access to work or amenities. Local zoning has kept density low, helping preserve its peaceful atmosphere while maintaining strong demand for single-family housing.
Springfield has grown increasingly popular among professionals who want more land and a quieter lifestyle within commuting range of Madison. That demand, combined with relatively few homes on the market, has made Springfield one of the county’s most competitive micro-markets. The housing stock continues to appreciate due to limited turnover and rising land values. With little risk of overdevelopment and continued buyer interest, Springfield remains one of the most stable and high-performing towns in Wisconsin’s real estate landscape.
9. Linn – 115% Home Price Increase Since 2012
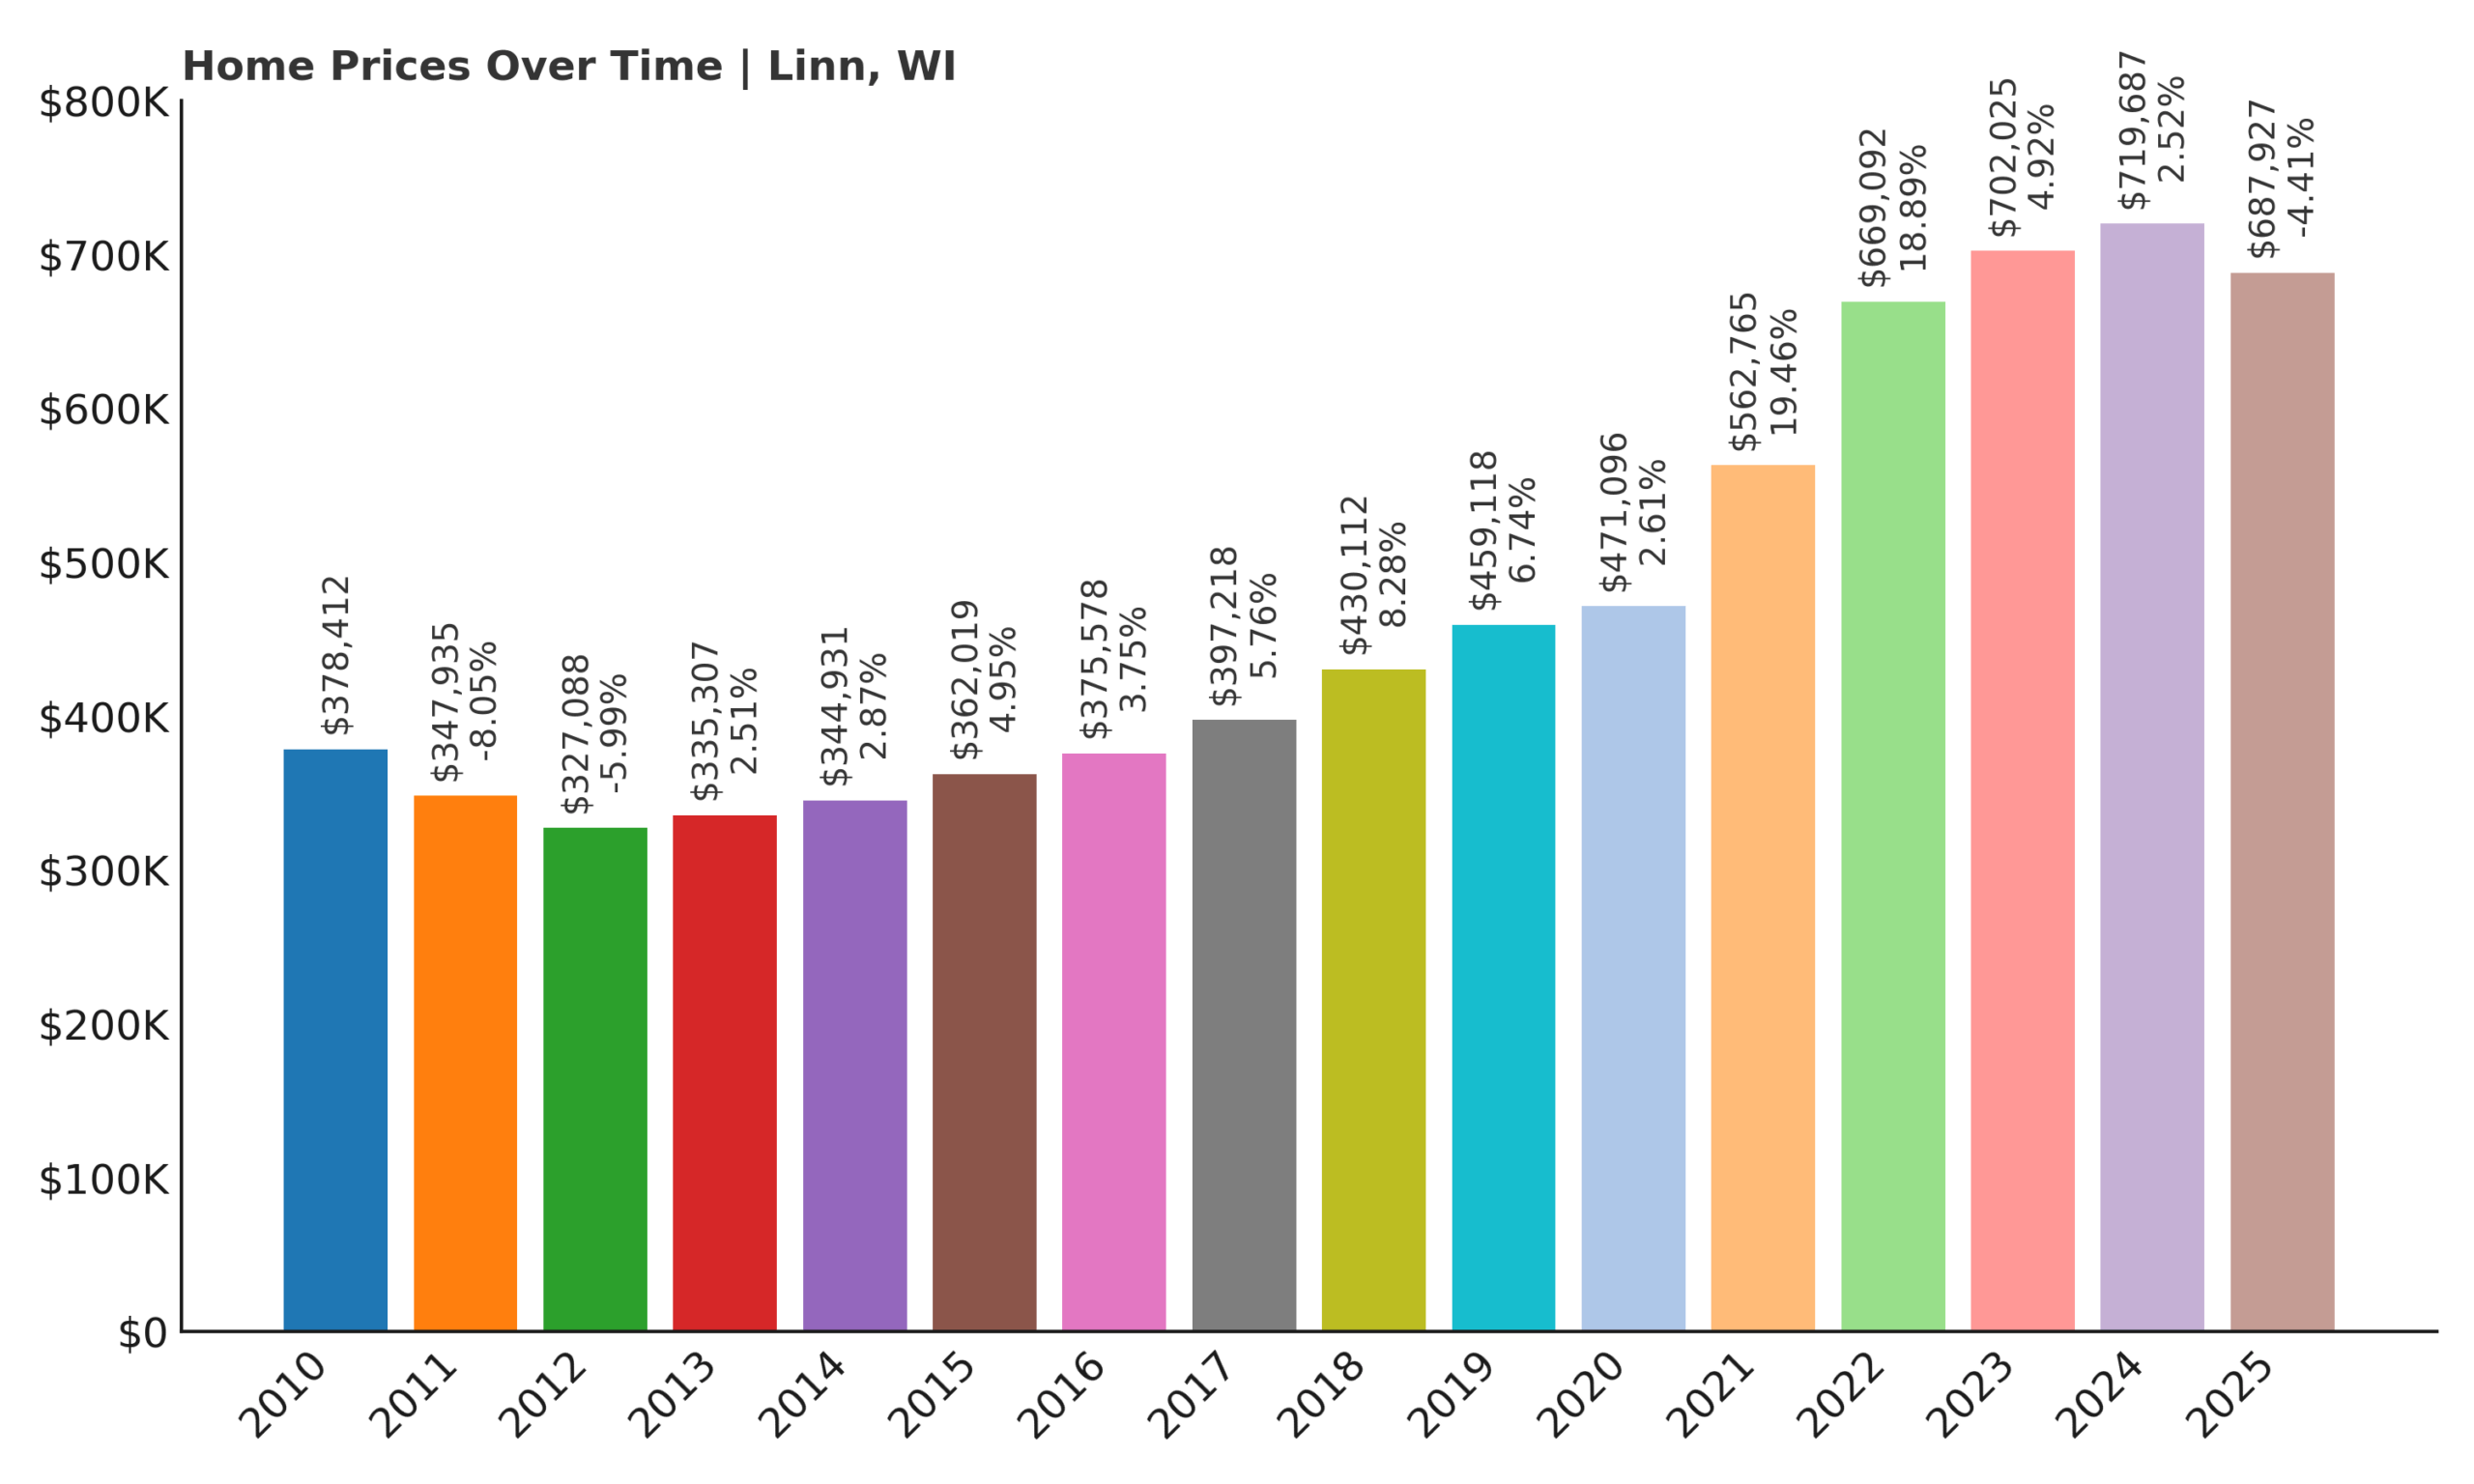
- 2010: $378,412
- 2011: $347,935 (-$30,478, -8.05% from previous year)
- 2012: $327,088 (-$20,847, -5.99% from previous year)
- 2013: $335,307 (+$8,219, +2.51% from previous year)
- 2014: $344,931 (+$9,624, +2.87% from previous year)
- 2015: $362,019 (+$17,088, +4.95% from previous year)
- 2016: $375,578 (+$13,559, +3.75% from previous year)
- 2017: $397,218 (+$21,640, +5.76% from previous year)
- 2018: $430,112 (+$32,894, +8.28% from previous year)
- 2019: $459,118 (+$29,005, +6.74% from previous year)
- 2020: $471,096 (+$11,979, +2.61% from previous year)
- 2021: $562,765 (+$91,669, +19.46% from previous year)
- 2022: $669,092 (+$106,327, +18.89% from previous year)
- 2023: $702,025 (+$32,933, +4.92% from previous year)
- 2024: $719,687 (+$17,662, +2.52% from previous year)
- 2025: $687,927 (-$31,760, -4.41% from previous year)
Despite a recent dip, Linn’s home values have soared 115% since 2012, driven by large year-over-year gains throughout the early 2020s. Prices peaked in 2024 at over $719,000 before declining slightly in 2025, but even with that correction, the town remains one of the most expensive in southern Wisconsin. High demand for luxury homes near Geneva Lake continues to fuel the market long term.
Linn – A Geneva Lake Community with Serious Value

Located on the southern and western edges of Geneva Lake, Linn is known for its estate-style lakefront homes, generous lot sizes, and private roadways. While it doesn’t have the commercial development of other Geneva Lake towns, that lack of bustle is part of Linn’s appeal. The area caters primarily to second-home buyers and longtime owners looking for tranquility and exclusivity. The town’s scenic vistas, historic mansions, and boating culture make it a premium destination for Wisconsin’s wealthiest buyers.
Because much of the shoreline is already built out, Linn has limited new construction, and many properties stay in families for generations. This tight inventory means home values rarely fall dramatically—even when broader markets fluctuate. While 2025’s drop might raise eyebrows, the long-term data shows enduring strength. With its pristine lake access and unique housing stock, Linn remains a powerhouse in Wisconsin’s luxury real estate scene.
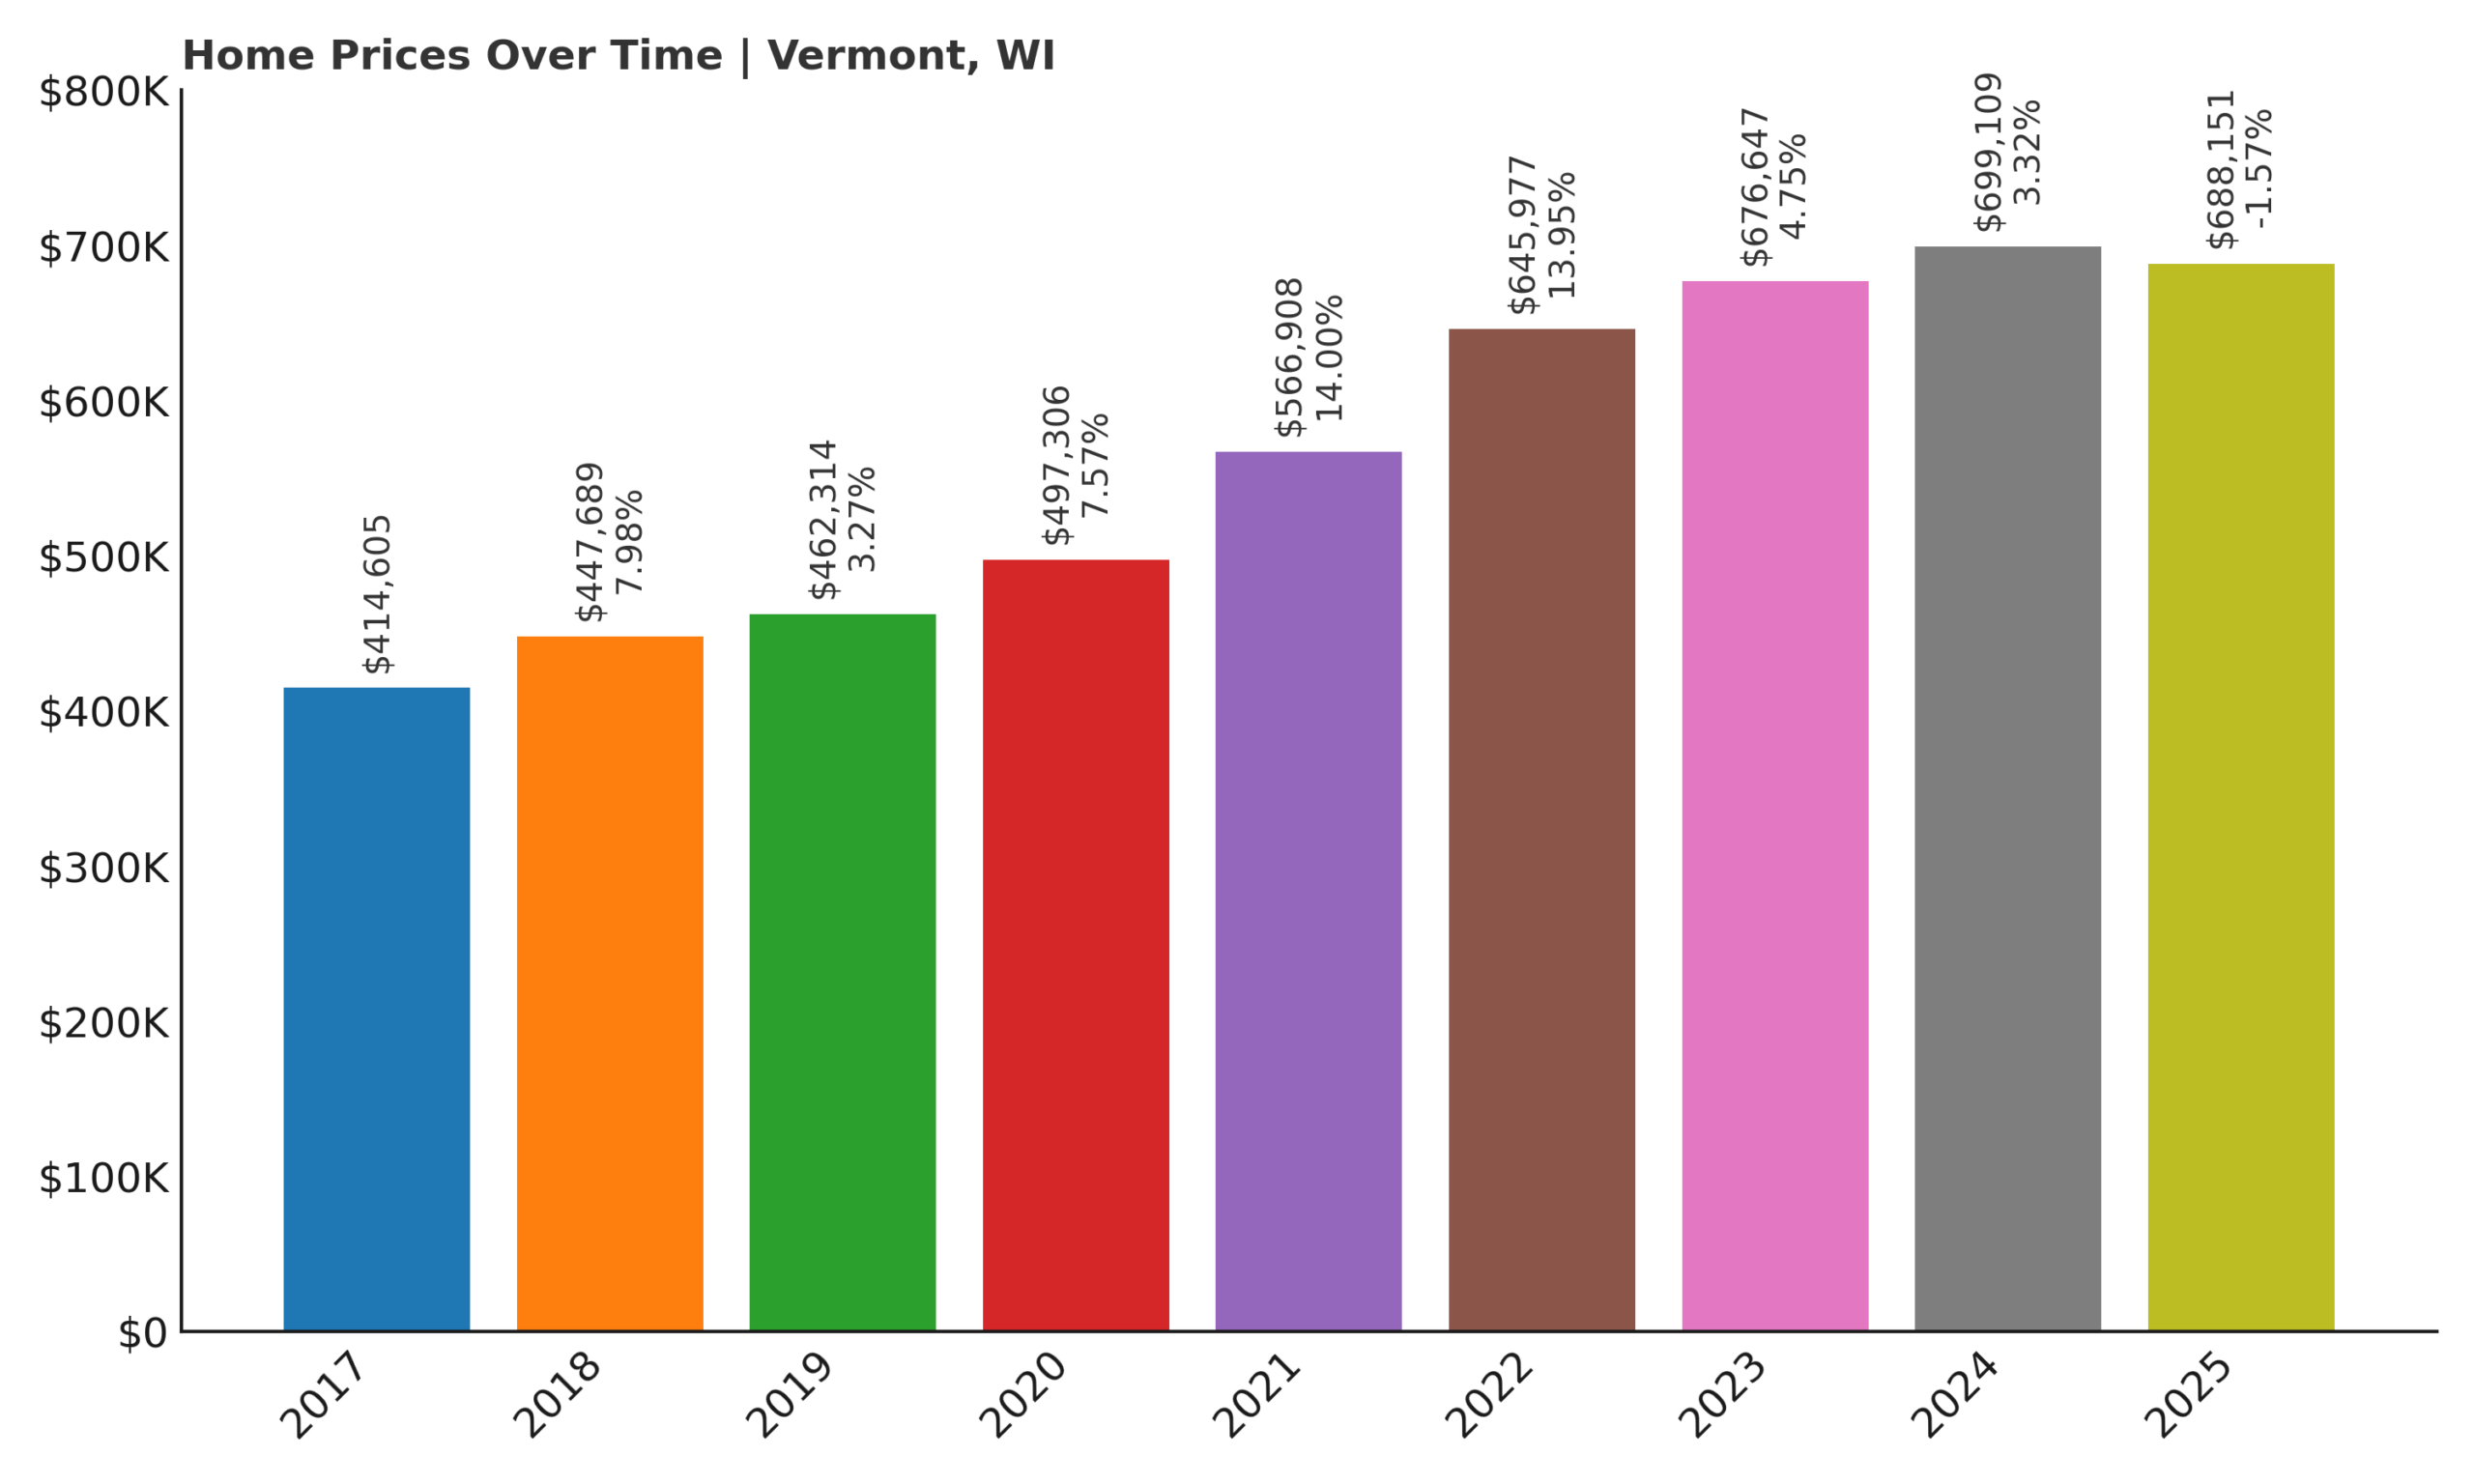
8. Vermont – 65.9% Home Price Increase Since 2017
- 2010: N/A
- 2011: N/A
- 2012: N/A
- 2013: N/A
- 2014: N/A
- 2015: N/A
- 2016: N/A
- 2017: $414,605
- 2018: $447,689 (+$33,084, +7.98% from previous year)
- 2019: $462,314 (+$14,625, +3.27% from previous year)
- 2020: $497,306 (+$34,991, +7.57% from previous year)
- 2021: $566,908 (+$69,603, +14.00% from previous year)
- 2022: $645,977 (+$79,068, +13.95% from previous year)
- 2023: $676,647 (+$30,670, +4.75% from previous year)
- 2024: $699,109 (+$22,461, +3.32% from previous year)
- 2025: $688,151 (-$10,958, -1.57% from previous year)
Since 2017, home values in Vermont have climbed nearly 66%, propelled by especially strong growth between 2020 and 2022. Prices rose rapidly during the pandemic years, driven by urban flight and heightened demand for rural, high-quality housing. Even with a modest pullback in 2025, the long-term trajectory remains firmly upward, signaling resilience and sustained interest in this growing community.
Vermont – Rural Character With Premium Appeal

Vermont, Wisconsin, not to be confused with the state, is a small and scenic township in Dane County that has quietly become one of the more desirable places for buyers seeking a mix of privacy, space, and accessibility. Nestled northwest of Madison, the town offers rolling farmland, wide-open skies, and winding country roads that appeal to those looking for peaceful living. Many homes here are custom-built on large lots, giving Vermont a distinctly upscale rural character. The town’s zoning regulations have limited overdevelopment, which in turn has helped preserve its natural feel and buoyed home values. Buyers are often drawn to Vermont by its proximity to Middleton and Cross Plains, allowing for an easy commute while still offering a retreat from suburban congestion. As more people look for homes with breathing room and long-term investment potential, Vermont has carved out a unique spot in the region. Unlike more crowded markets, its value lies not just in its housing stock but in the land and lifestyle it provides.
Recent years have seen Vermont attract a broader pool of buyers, including remote professionals, retirees, and high-income households looking for estate-style living. The boom in work-from-home culture has allowed more people to consider towns like Vermont, where quality of life takes priority and space is abundant. The housing stock ranges from modern farmhouses to sprawling ranches, and while the market remains relatively small, competition is stiff due to low turnover. Schools in the nearby areas are strong, and infrastructure continues to improve, further enhancing Vermont’s appeal. Residents value the quiet, the privacy, and the connection to nature that the town offers—a far cry from fast-paced urban life. This blend of luxury, space, and rural charm has made Vermont one of the more surprising real estate success stories of the last decade. Though 2025 saw a slight price dip, Vermont’s fundamentals remain strong, and it continues to hold its own as a premium destination within Dane County.
7. Nashotah – 100.5% Home Price Increase Since 2010

- 2010: $350,519
- 2011: $342,709 (-$7,811, -2.23% from previous year)
- 2012: $342,159 (-$550, -0.16% from previous year)
- 2013: $358,849 (+$16,690, +4.88% from previous year)
- 2014: $392,319 (+$33,471, +9.33% from previous year)
- 2015: $405,881 (+$13,562, +3.46% from previous year)
- 2016: $426,171 (+$20,290, +5.00% from previous year)
- 2017: $444,926 (+$18,755, +4.40% from previous year)
- 2018: $466,250 (+$21,325, +4.79% from previous year)
- 2019: $491,463 (+$25,213, +5.41% from previous year)
- 2020: $512,438 (+$20,975, +4.27% from previous year)
- 2021: $575,188 (+$62,750, +12.25% from previous year)
- 2022: $629,506 (+$54,317, +9.44% from previous year)
- 2023: $674,870 (+$45,364, +7.21% from previous year)
- 2024: $691,445 (+$16,575, +2.46% from previous year)
- 2025: $702,678 (+$11,233, +1.62% from previous year)
Nashotah’s home values have more than doubled over the past 15 years, climbing from around $350,000 in 2010 to over $700,000 in 2025. The town saw particularly sharp growth after 2020, with multiple years of 9–12% increases that helped push it into the top tier of Wisconsin’s housing market. While growth has moderated slightly in the past two years, the gains remain solid and sustainable.
Nashotah – Lake Country Sophistication With Small-Town Roots

Nashotah is part of Wisconsin’s desirable “Lake Country” region in Waukesha County, offering a quiet, refined alternative to busier neighboring towns like Delafield and Hartland. Its reputation is built on serenity, natural beauty, and a small-town lifestyle that still keeps buyers close to modern conveniences. The area features a mix of classic colonial homes, newer estates, and high-end properties tucked around nearby lakes and woodlands. For those who want lake access without the summer crowds, Nashotah delivers with its proximity to Upper Nashotah Lake and surrounding recreational areas. The town is also known for its excellent public schools and safe neighborhoods, both of which make it popular with families and retirees. Because of limited land for new development, inventory remains tight, which further contributes to the steady rise in home values. That scarcity also ensures that Nashotah retains its peaceful feel, avoiding the kind of overbuilding that has impacted other growing suburbs.
Much of the recent price acceleration in Nashotah came from its newfound popularity with remote workers and executives seeking refuge from city life. Buyers are increasingly drawn to the town’s spacious lots, upscale finishes, and quiet lifestyle—without having to sacrifice access to major roads and commerce. Even with prices now north of $700,000, homes don’t stay on the market long. Nashotah has also benefited from regional improvements in infrastructure and broadband, making it more feasible for professionals to live farther out. The town maintains a strong civic identity and takes pride in preserving its charm, making it appealing for those who value heritage and stability. As more urban buyers seek long-term security and better living environments, Nashotah’s reputation continues to grow. The town’s high price point reflects both its intrinsic appeal and the demand it consistently commands. With no signs of oversupply and strong buyer interest, Nashotah remains one of the safest and most prestigious real estate bets in the region.
6. Summit – 79.6% Home Price Increase Since 2010
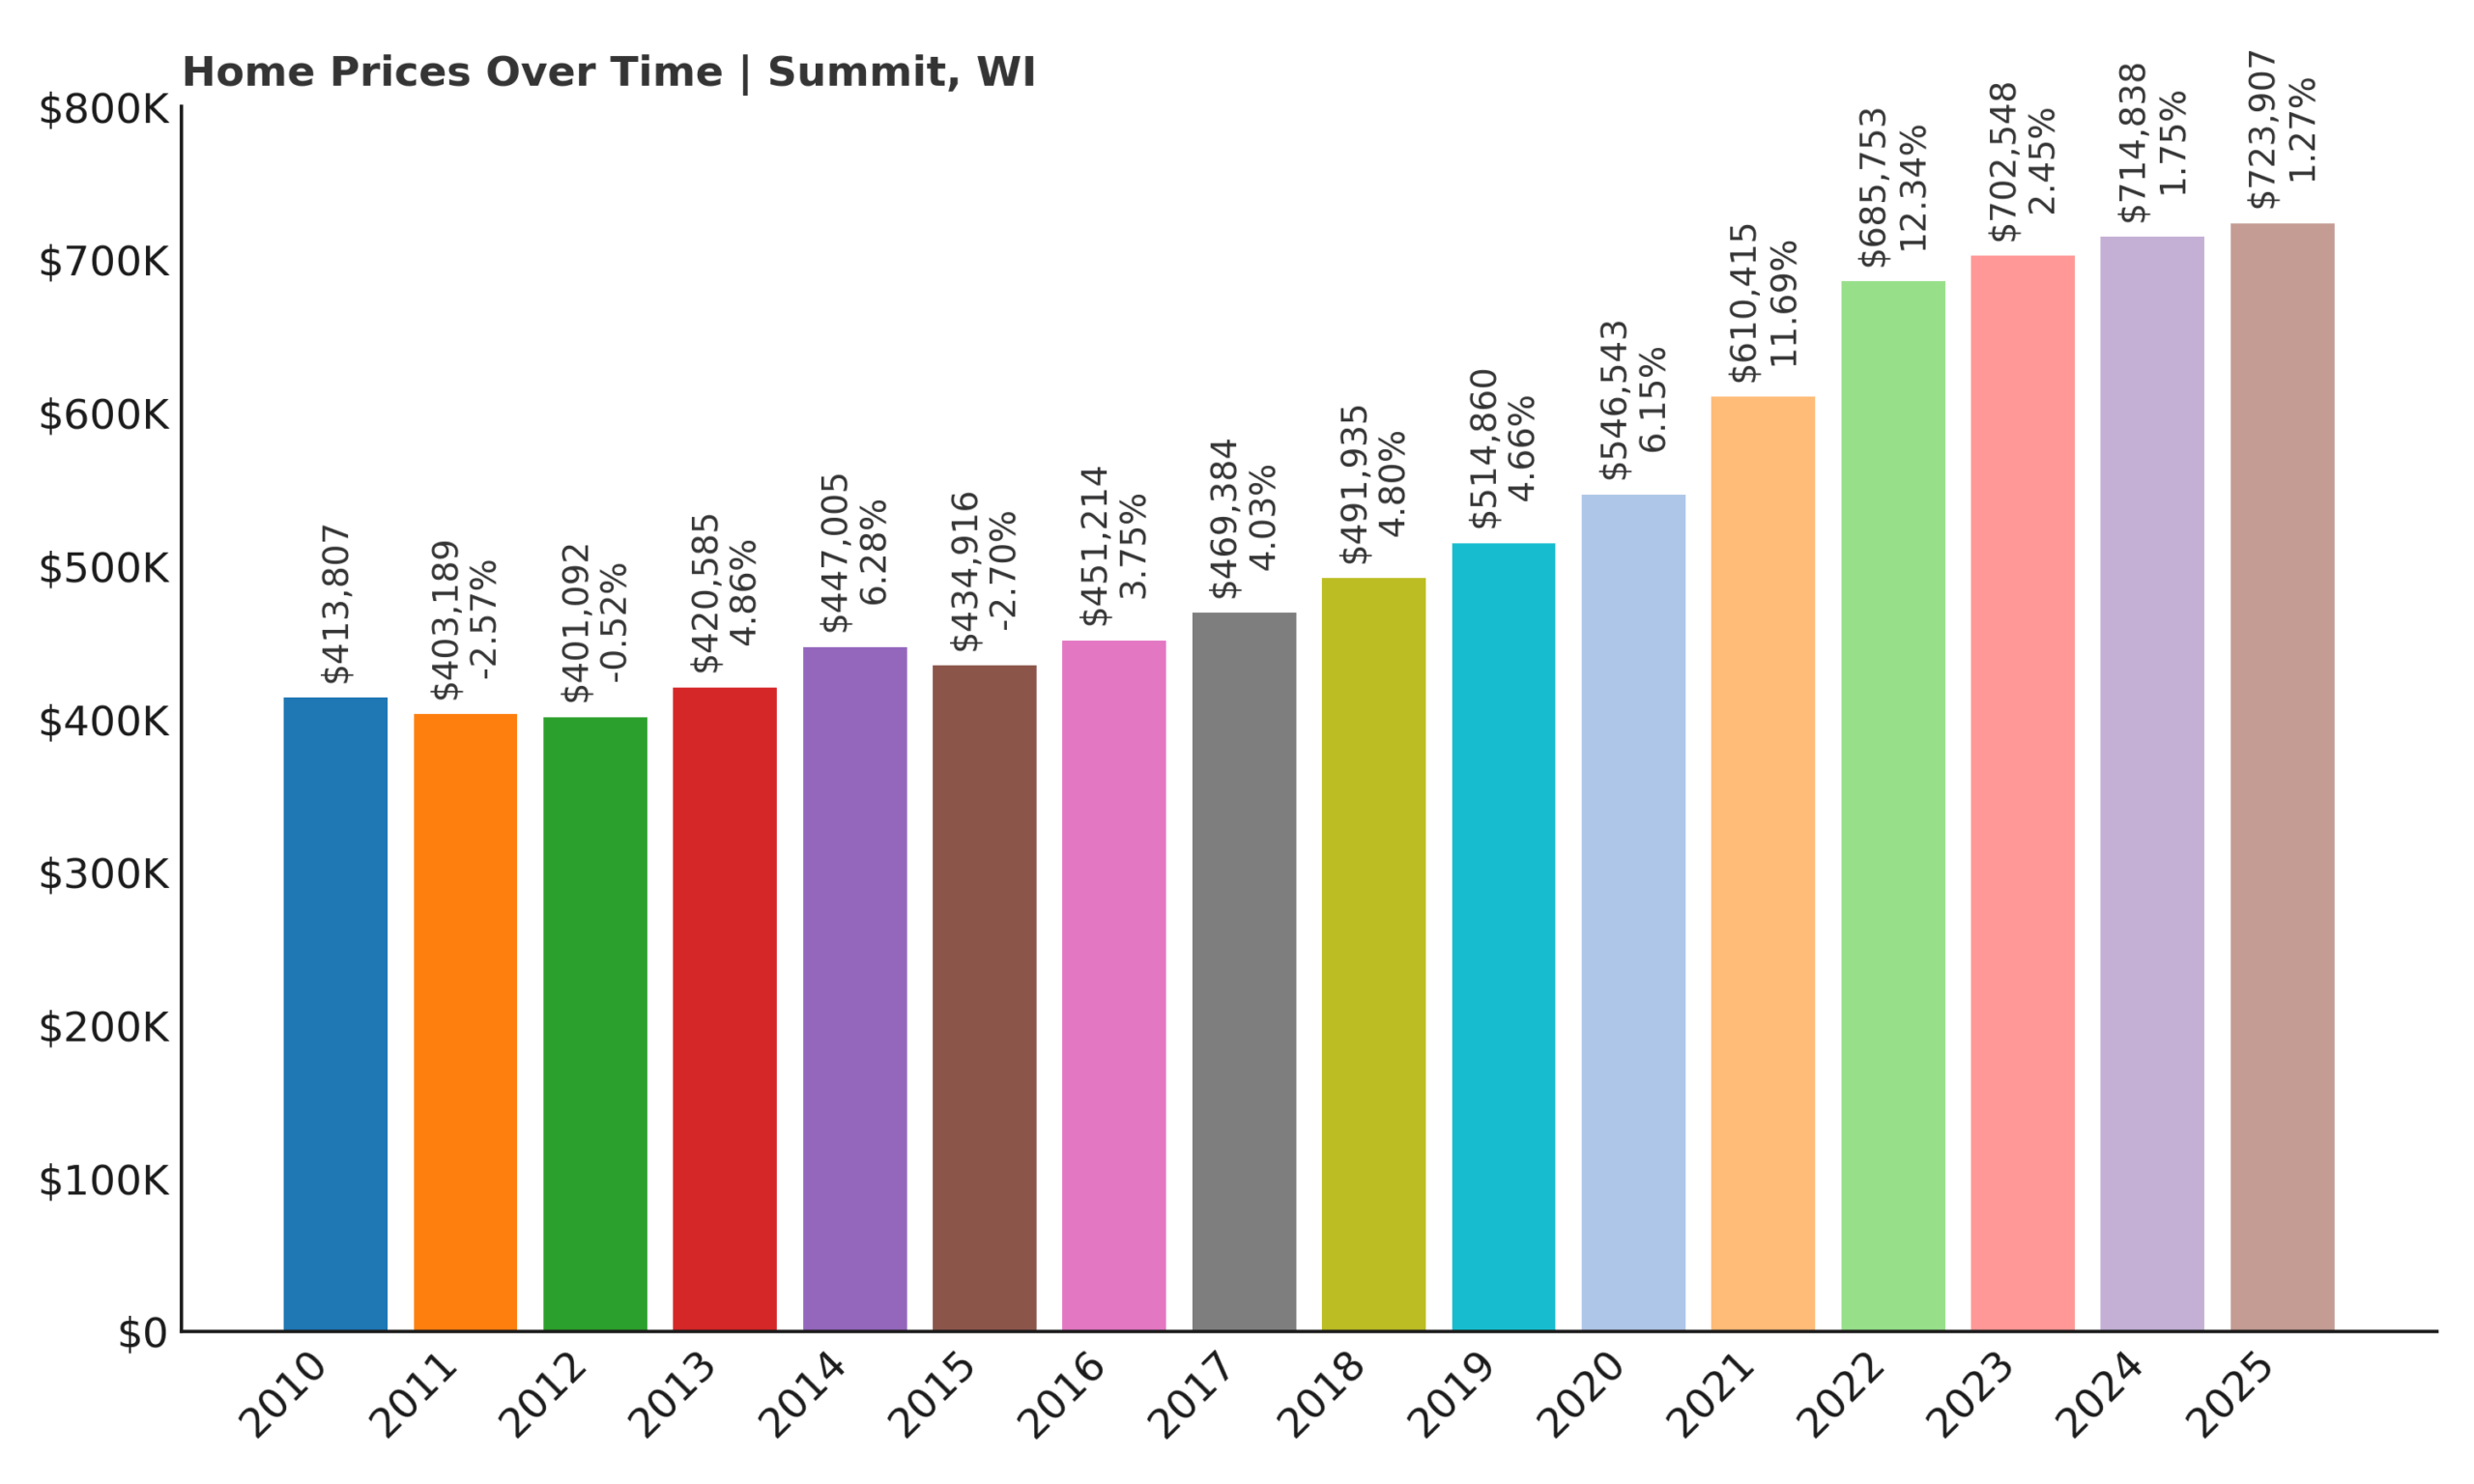
- 2010: $413,807
- 2011: $403,189 (-$10,618, -2.57% from previous year)
- 2012: $401,092 (-$2,097, -0.52% from previous year)
- 2013: $420,585 (+$19,494, +4.86% from previous year)
- 2014: $447,005 (+$26,419, +6.28% from previous year)
- 2015: $434,916 (-$12,088, -2.70% from previous year)
- 2016: $451,214 (+$16,298, +3.75% from previous year)
- 2017: $469,384 (+$18,170, +4.03% from previous year)
- 2018: $491,935 (+$22,551, +4.80% from previous year)
- 2019: $514,860 (+$22,924, +4.66% from previous year)
- 2020: $546,543 (+$31,684, +6.15% from previous year)
- 2021: $610,415 (+$63,872, +11.69% from previous year)
- 2022: $685,753 (+$75,338, +12.34% from previous year)
- 2023: $702,548 (+$16,795, +2.45% from previous year)
- 2024: $714,838 (+$12,290, +1.75% from previous year)
- 2025: $723,907 (+$9,069, +1.27% from previous year)
Summit’s home prices have increased by nearly 80% since 2010, with the sharpest gains happening between 2020 and 2022. These years saw growth of over 24% combined, propelling the town into the ranks of Wisconsin’s most expensive housing markets. While growth has cooled slightly in the last two years, home values have continued to edge upward.
Summit – Suburban Serenity With a Touch of Luxury

Summit is another Waukesha County standout, located just west of Oconomowoc, offering a blend of upscale suburban living and rural tranquility. The town is dotted with executive homes, small lakes, and wooded enclaves, creating an atmosphere of quiet elegance. Residents enjoy easy access to I-94, making Summit a viable option for commuters heading into Milwaukee or Madison. The town’s real estate market is driven largely by owner-occupied homes on spacious lots, many with modern amenities and high-end finishes. Unlike more densely packed suburbs, Summit offers room to breathe—something more buyers have been seeking post-pandemic. Its proximity to Oconomowoc’s shopping and dining scene adds convenience without the need to live in the middle of it. Strong school districts and stable property values have made it a consistent favorite among families looking for a longer-term residence.
Home prices in Summit have remained resilient thanks to limited inventory and sustained demand from high-income buyers. Remote workers and urban transplants have increasingly targeted the area, attracted by the mix of accessibility and lifestyle perks. Homes in Summit are often newer builds or extensively renovated, and the design aesthetic leans toward modern farmhouse, craftsman, and transitional styles. The community is known for its strong neighborhood associations, quiet streets, and overall sense of pride in ownership. While it doesn’t have the name recognition of places like Delafield or Pewaukee, Summit has been quietly outperforming them in terms of price growth. As Wisconsin’s Lake Country continues to attract attention, Summit’s combination of location, lot size, and livability positions it well for continued gains. It remains a smart buy for those who want a peaceful retreat with upscale credentials.
✅ Hotel #1
✅ Hotel #2
✅ Hotel #3
AN-APP-MAR19.jpg” alt=”Get pre-approved for home equity loan” width=”1628″ height=”742″>
5. Delafield – 75.5% Home Price Increase Since 2010
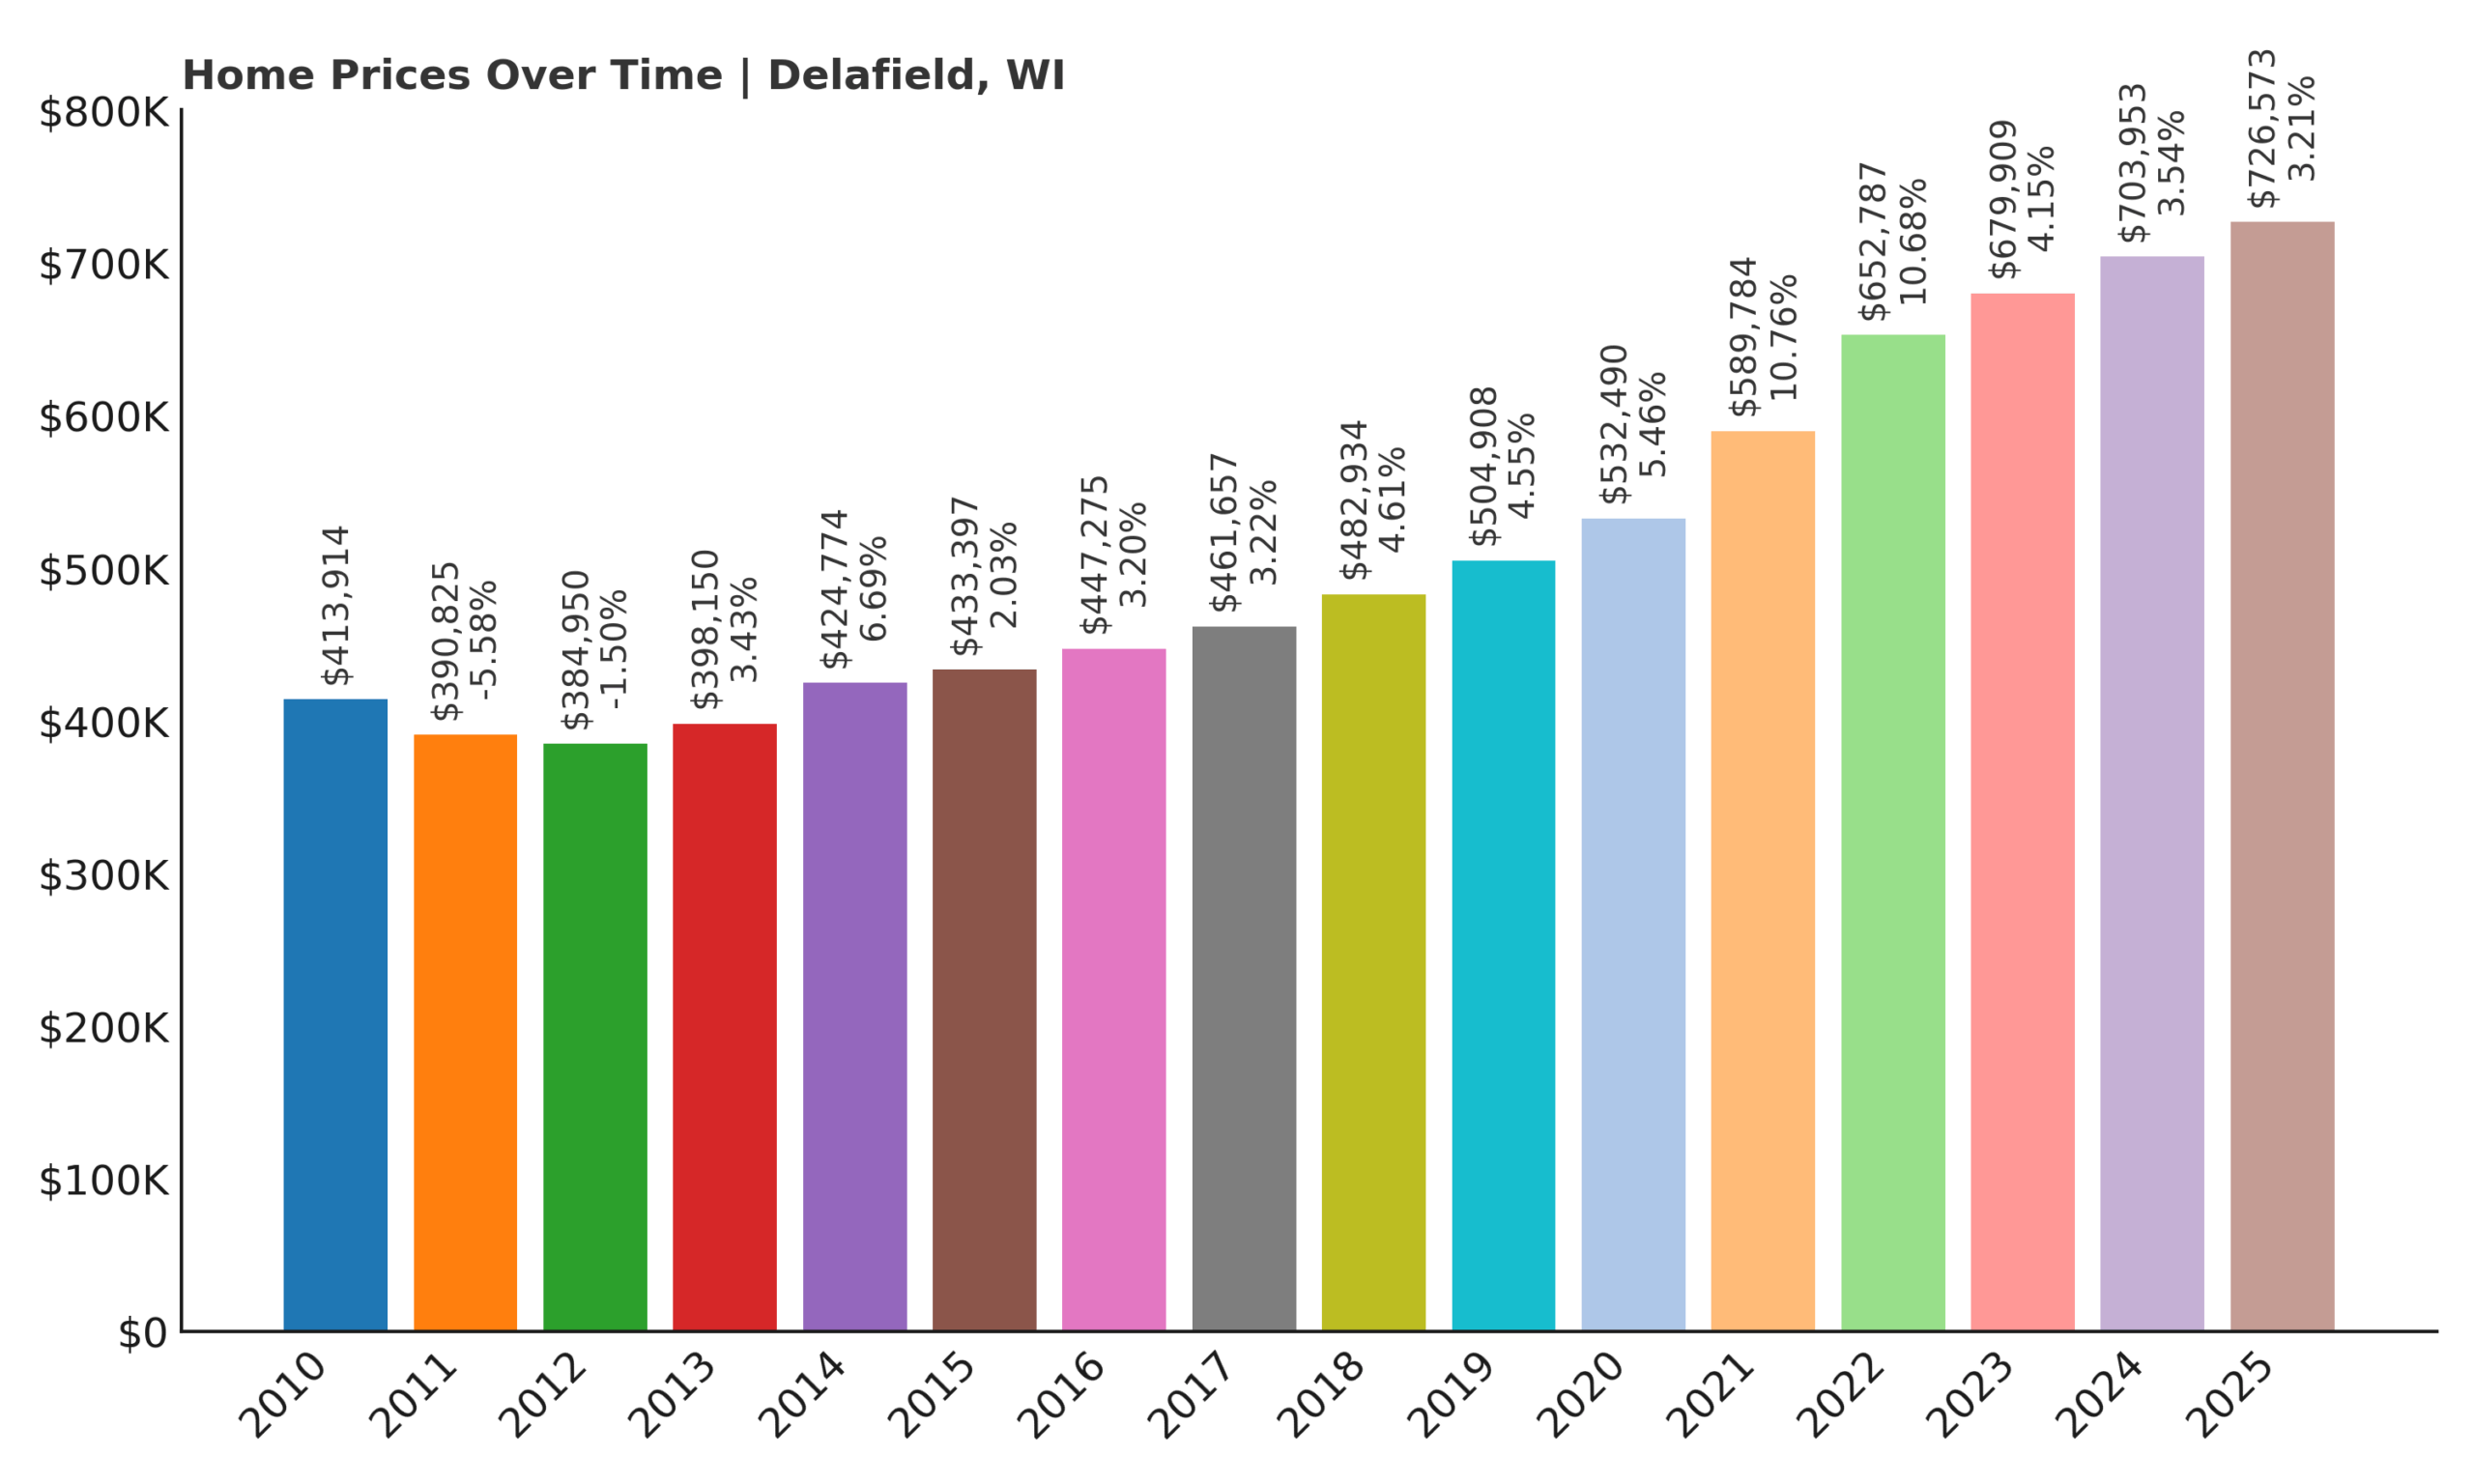
- 2010: $413,914
- 2011: $390,825 (-$23,089, -5.58% from previous year)
- 2012: $384,950 (-$5,875, -1.50% from previous year)
- 2013: $398,150 (+$13,200, +3.43% from previous year)
- 2014: $424,774 (+$26,625, +6.69% from previous year)
- 2015: $433,397 (+$8,623, +2.03% from previous year)
- 2016: $447,275 (+$13,878, +3.20% from previous year)
- 2017: $461,657 (+$14,382, +3.22% from previous year)
- 2018: $482,934 (+$21,277, +4.61% from previous year)
- 2019: $504,908 (+$21,974, +4.55% from previous year)
- 2020: $532,490 (+$27,582, +5.46% from previous year)
- 2021: $589,784 (+$57,293, +10.76% from previous year)
- 2022: $652,787 (+$63,003, +10.68% from previous year)
- 2023: $679,909 (+$27,122, +4.15% from previous year)
- 2024: $703,953 (+$24,045, +3.54% from previous year)
- 2025: $726,573 (+$22,620, +3.21% from previous year)
Home prices in Delafield have risen steadily from just over $413,000 in 2010 to more than $726,000 by 2025. After some early dips, the market turned around in 2013 and never looked back, with especially strong growth from 2020 through 2022. The town’s long-term stability and high buyer demand have made it a consistent standout in Waukesha County.
Delafield – Where Classic Charm Meets Modern Demand

Delafield offers the perfect blend of small-town charm and upscale living. Nestled between lakes, woodlands, and hills, the town is one of Lake Country’s most beloved destinations. Its historic downtown features boutique shops, cafes, and lakefront views, while its residential areas boast a range of home styles—from restored Victorians to modern estates. Delafield’s appeal lies in its walkability and its mix of recreational, cultural, and educational offerings. Families appreciate the top-tier schools, while commuters value the quick access to I-94. The town also features year-round events and a strong sense of community, drawing residents who want a more engaging and connected lifestyle. While homes here come at a premium, they’re seen as a worthwhile investment in both lifestyle and value. It’s no surprise that Delafield consistently ranks among the most expensive towns in the state.
The town’s high home prices are backed by consistent demand and tight inventory. There’s limited space for new development, and many properties are held long-term by owners who see Delafield as their forever home. That means fewer listings and fierce competition when quality homes do hit the market. During the pandemic, Delafield saw a wave of incoming buyers seeking scenic surroundings and work-from-home convenience, driving up prices quickly. While growth has moderated in recent years, values have continued to climb—just more sustainably. Its mix of architectural character, community engagement, and location make it a rare find in the Wisconsin housing market. In short, Delafield offers more than just a house—it offers a lifestyle that’s increasingly in demand across age groups and buyer types.
4. River Hills – 49.2% Home Price Increase Since 2010
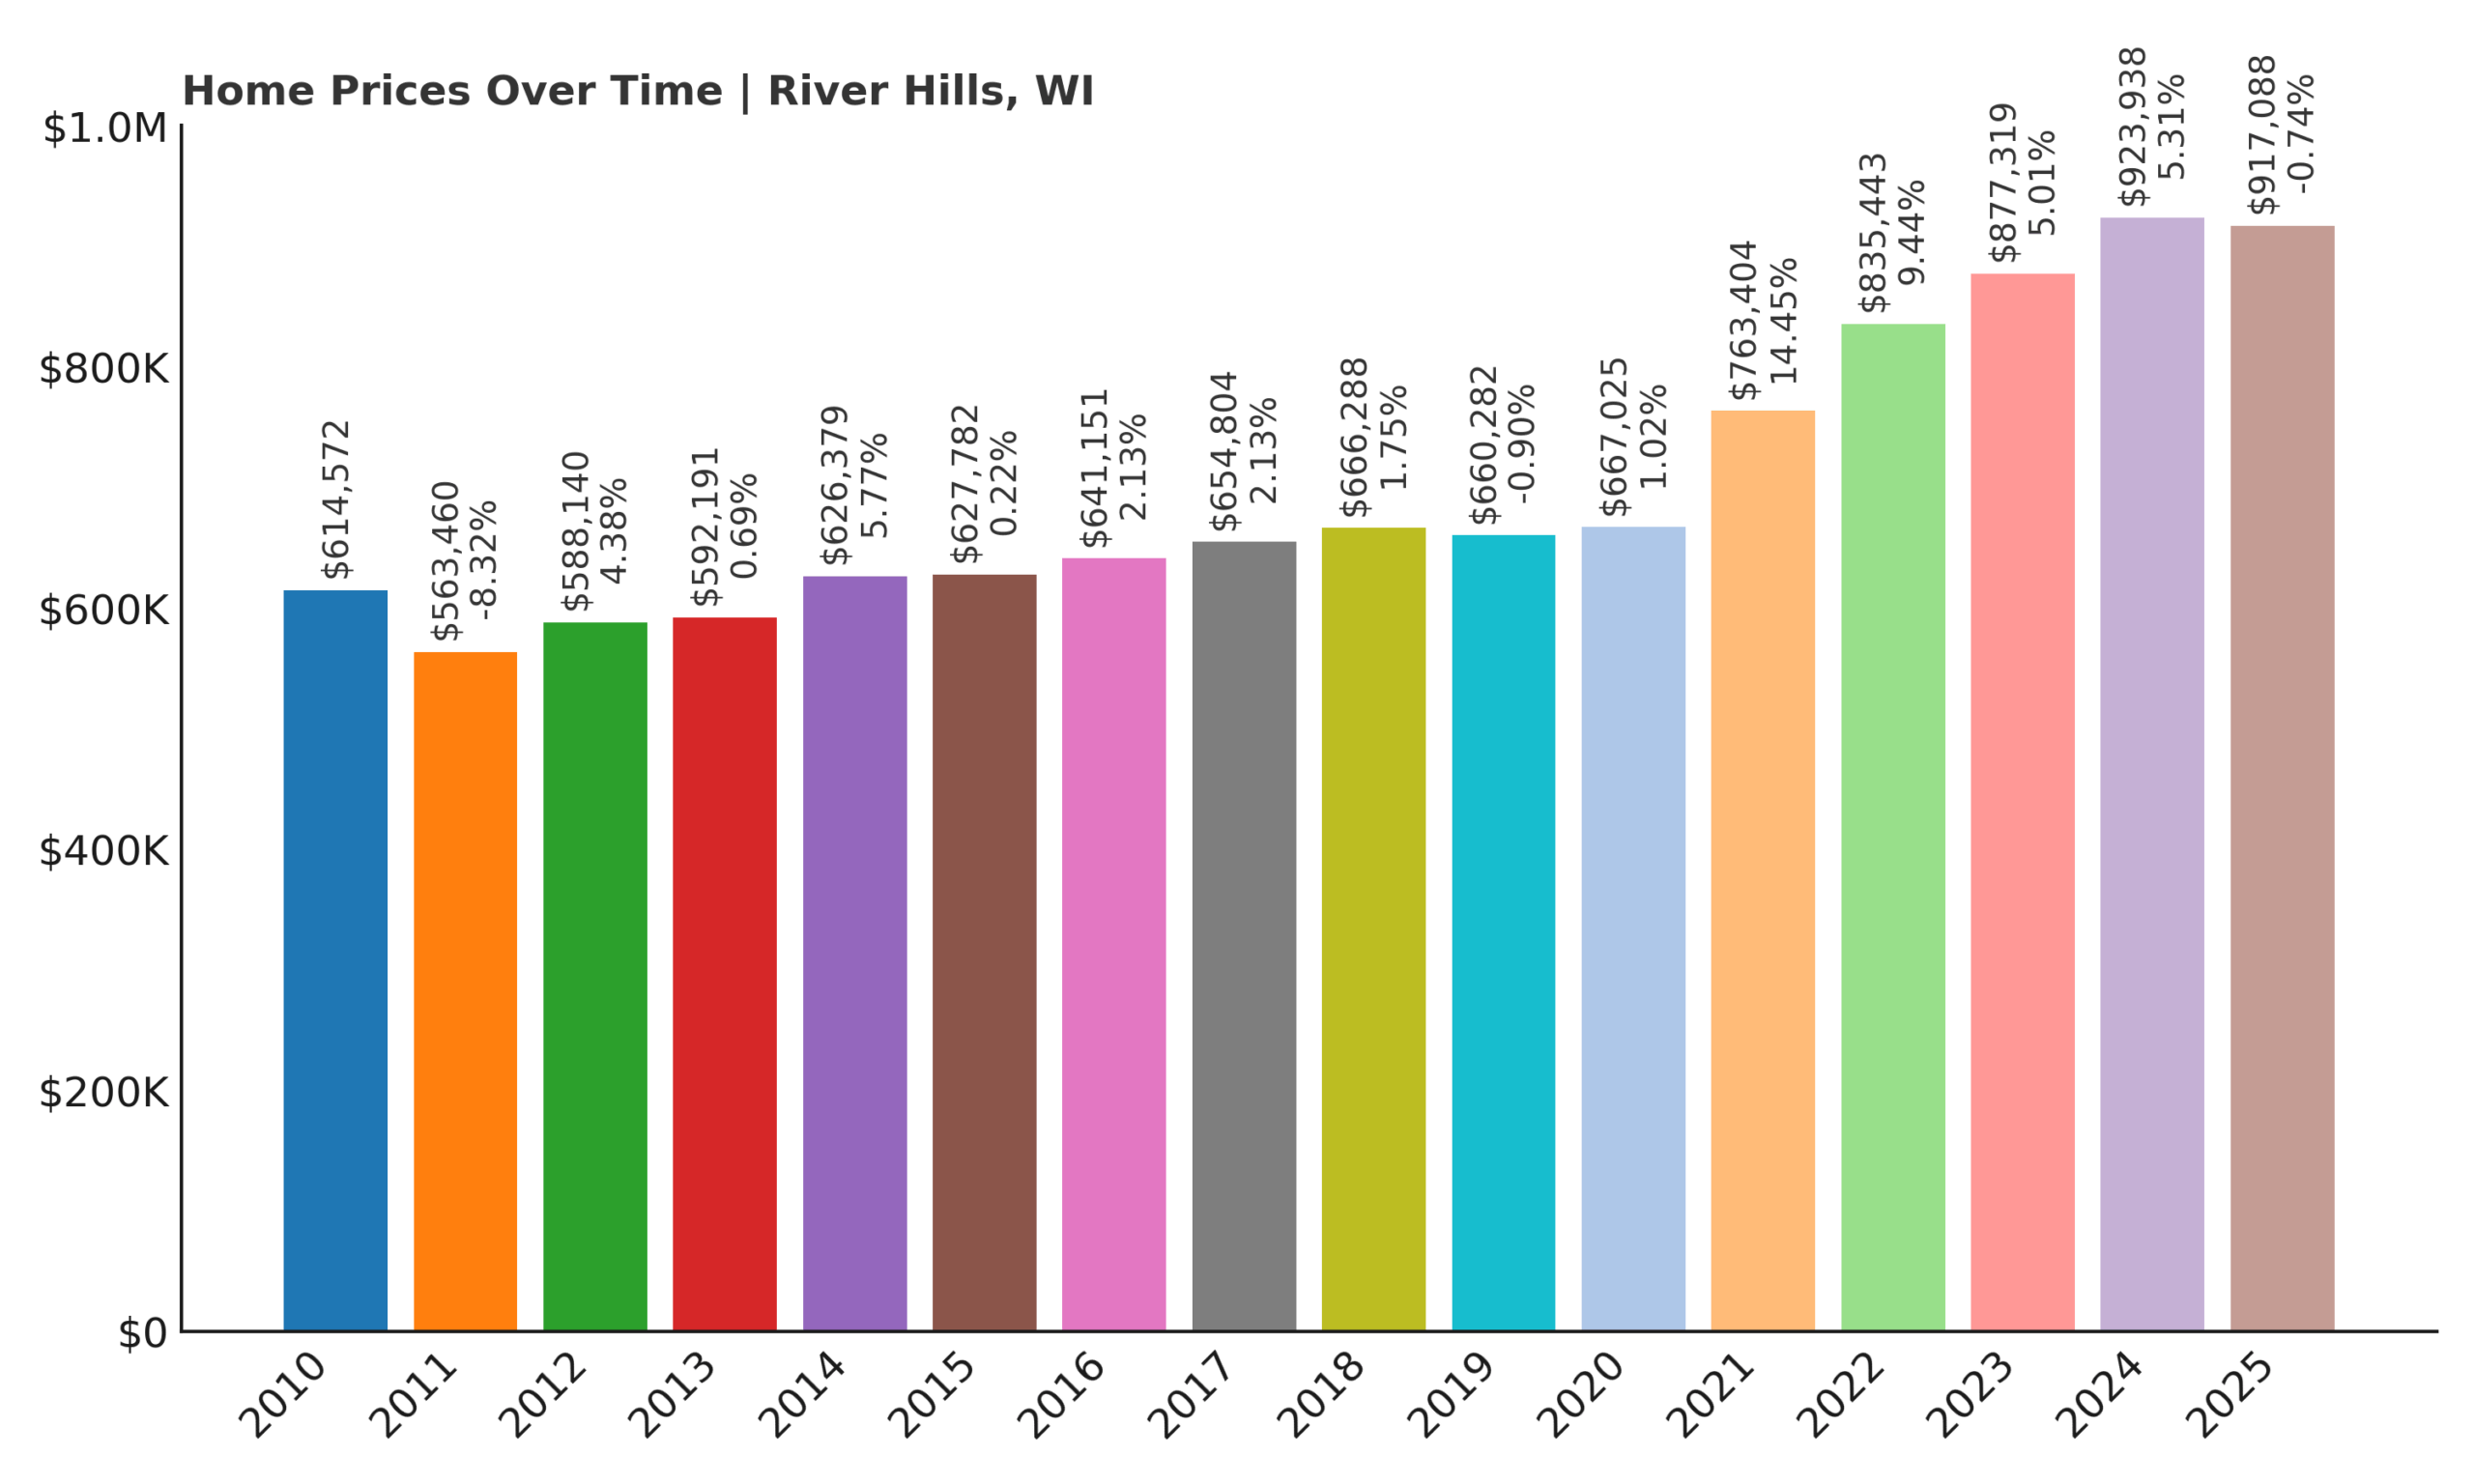
- 2010: $614,572
- 2011: $563,460 (-$51,112, -8.32% from previous year)
- 2012: $588,140 (+$24,680, +4.38% from previous year)
- 2013: $592,191 (+$4,051, +0.69% from previous year)
- 2014: $626,379 (+$34,188, +5.77% from previous year)
- 2015: $627,782 (+$1,403, +0.22% from previous year)
- 2016: $641,151 (+$13,368, +2.13% from previous year)
- 2017: $654,804 (+$13,653, +2.13% from previous year)
- 2018: $666,288 (+$11,484, +1.75% from previous year)
- 2019: $660,282 (-$6,007, -0.90% from previous year)
- 2020: $667,025 (+$6,743, +1.02% from previous year)
- 2021: $763,404 (+$96,380, +14.45% from previous year)
- 2022: $835,443 (+$72,038, +9.44% from previous year)
- 2023: $877,319 (+$41,877, +5.01% from previous year)
- 2024: $923,938 (+$46,618, +5.31% from previous year)
- 2025: $917,088 (-$6,850, -0.74% from previous year)
River Hills has seen its home values rise nearly 50% since 2010, with the biggest jumps occurring during 2021 and 2022. While values dipped slightly in 2025, the town remains one of the priciest areas in Wisconsin thanks to its exclusivity, large lot sizes, and prestigious reputation. Its housing market is defined by long-term ownership and limited turnover, contributing to persistent upward pressure on prices.
River Hills – Privacy, Prestige, and Estate Living

River Hills is one of the few remaining estate-style communities in the state, offering a level of privacy and space that’s increasingly rare. Located just north of Milwaukee, it features sprawling lots, gated driveways, and custom-built homes often hidden from view. Zoning laws require minimum lot sizes of five acres, which ensures the area maintains its quiet, wooded character. This setup appeals to those who want luxury without the visibility, making it popular with executives, professionals, and longtime residents who value seclusion. River Hills is also known for its proximity to top private schools, golf clubs, and country estates, which reinforce its elite status. Because of strict development limits, available homes are few—and prices reflect that scarcity. Buyers here aren’t just purchasing property; they’re buying into a legacy of affluence and privacy that defines the River Hills experience.
The pandemic-era housing surge gave River Hills a noticeable lift, with prices jumping by more than $168,000 between 2020 and 2022 alone. These gains were driven by a renewed interest in space and security, with many high-income buyers leaving denser areas for properties like those in River Hills. Even after a modest dip in 2025, the town’s long-term price history speaks to its enduring value. Unlike flashier new developments, River Hills offers old-world appeal rooted in tradition, landscaping, and timeless architecture. Many homes are passed down within families or held for decades, keeping inventory extremely limited. The result is a market that moves slowly—but with significant weight when it does. For buyers who prioritize space, legacy, and discretion, River Hills continues to be one of Wisconsin’s most exclusive—and stable—places to live.
3. Maple Bluff – 117.3% Home Price Increase Since 2010

- 2010: $459,002
- 2011: $443,708 (-$15,294, -3.33% from previous year)
- 2012: $443,055 (-$653, -0.15% from previous year)
- 2013: $456,191 (+$13,136, +2.96% from previous year)
- 2014: $467,733 (+$11,542, +2.53% from previous year)
- 2015: $474,042 (+$6,309, +1.35% from previous year)
- 2016: $503,771 (+$29,728, +6.27% from previous year)
- 2017: $531,363 (+$27,593, +5.48% from previous year)
- 2018: $554,079 (+$22,716, +4.28% from previous year)
- 2019: $596,912 (+$42,833, +7.73% from previous year)
- 2020: $619,686 (+$22,774, +3.82% from previous year)
- 2021: $721,579 (+$101,893, +16.44% from previous year)
- 2022: $833,324 (+$111,746, +15.49% from previous year)
- 2023: $887,042 (+$53,717, +6.45% from previous year)
- 2024: $939,637 (+$52,595, +5.93% from previous year)
- 2025: $997,230 (+$57,592, +6.13% from previous year)
Maple Bluff’s home values have more than doubled since 2010, rising from just under $460,000 to nearly $1 million in 2025. The steepest increases came in the early 2020s, when the town saw multiple years of double-digit growth, including a staggering 16% jump in 2021 alone. Maple Bluff’s consistent demand and elite status have made it one of the strongest-performing luxury markets in the state.
Maple Bluff – Lakeside Living With Historic Prestige

Perched on the eastern shore of Lake Mendota, Maple Bluff is one of Madison’s oldest and most affluent neighborhoods. The town is home to the Wisconsin Governor’s Mansion and some of the most stately lakefront properties in the region. Streets are lined with mature trees, historic homes, and manicured lawns that have been carefully preserved for generations. The town’s layout and zoning preserve low-density charm, making it feel more like a private enclave than a typical suburb. Residents enjoy sweeping lake views, private docks, and access to elite institutions like Maple Bluff Country Club. It’s not just the location that commands high prices—it’s the exclusivity and the community’s long-standing reputation. Very few homes become available each year, and when they do, they rarely sit on the market for long. Maple Bluff isn’t just a neighborhood—it’s a legacy destination for Wisconsin’s old and new wealth.
As Madison has grown, Maple Bluff has only become more desirable, thanks to its proximity to the city’s downtown and university district. Wealthy professionals and longtime residents compete for limited inventory, and renovations in recent years have brought modern luxury into homes with historical character. While other areas have seen boom-and-bust cycles, Maple Bluff has remained consistently upward, even during slower economic periods. Its value is underpinned by scarcity—there’s simply nowhere else in the area that offers the same blend of history, water access, and exclusivity. In 2025, prices continue to climb, driven by a mix of local affluence and out-of-state buyers who recognize the neighborhood’s unique status. For those seeking permanence, prestige, and stunning lakefront property, Maple Bluff remains at the top of the Wisconsin housing market.
2. Shorewood Hills – 110.5% Home Price Increase Since 2010

- 2010: $532,966
- 2011: $519,472 (-$13,494, -2.53% from previous year)
- 2012: $500,612 (-$18,860, -3.63% from previous year)
- 2013: $532,381 (+$31,770, +6.35% from previous year)
- 2014: $557,936 (+$25,555, +4.80% from previous year)
- 2015: $571,010 (+$13,073, +2.34% from previous year)
- 2016: $592,113 (+$21,103, +3.70% from previous year)
- 2017: $610,356 (+$18,243, +3.08% from previous year)
- 2018: $650,002 (+$39,647, +6.50% from previous year)
- 2019: $663,431 (+$13,428, +2.07% from previous year)
- 2020: $689,970 (+$26,539, +4.00% from previous year)
- 2021: $771,075 (+$81,106, +11.75% from previous year)
- 2022: $880,692 (+$109,616, +14.22% from previous year)
- 2023: $931,250 (+$50,558, +5.74% from previous year)
- 2024: $1,038,290 (+$107,040, +11.49% from previous year)
- 2025: $1,122,196 (+$83,907, +8.08% from previous year)
Shorewood Hills has more than doubled in value since 2010, rising from just over $530,000 to over $1.1 million in 2025. The town experienced particularly explosive growth in the early 2020s, including back-to-back years of 11% and 14% price gains. It now ranks as one of Wisconsin’s most expensive and sought-after communities.
Shorewood Hills – Academic Prestige and Lakeside Luxury

Shorewood Hills is a rare mix of intellectual prestige and natural beauty, nestled along Lake Mendota and adjacent to the University of Wisconsin-Madison. The town’s roots as a planned community are evident in its winding streets, wooded lots, and carefully preserved mid-century modern architecture. Its residents include university faculty, physicians, researchers, and professionals who are drawn to its proximity to UW Hospital and downtown Madison. Homes in Shorewood Hills are often custom-designed, with unique layouts and architecture that reflect the area’s cultured, academic vibe. The community places a strong emphasis on education, walkability, and sustainability, creating an ideal environment for high-achieving families. Parks, bike trails, and water access enhance its appeal, and the sense of neighborhood pride is palpable. With only a few hundred homes and very low turnover, Shorewood Hills has remained one of the most exclusive zip codes in the state.
The housing market here is as competitive as it is stable. Buyers know that listings are limited and demand is persistent, driving up prices year after year. Even as broader markets have cooled, Shorewood Hills has continued to see price appreciation, thanks to its unique location and reputation. Renovated properties and newly built homes on teardown lots have introduced modern amenities while preserving the neighborhood’s architectural character. High demand among university affiliates and medical professionals has provided a steady stream of qualified buyers. The area’s walkability to campus, downtown, and lakefront parks only strengthens its desirability. As of 2025, Shorewood Hills continues to command prices well above the state average, reinforcing its place at the top of Madison’s luxury housing market. For those who value location, education, and community, it remains unmatched.
1. Oconomowoc Lake – 76.8% Home Price Increase Since 2010
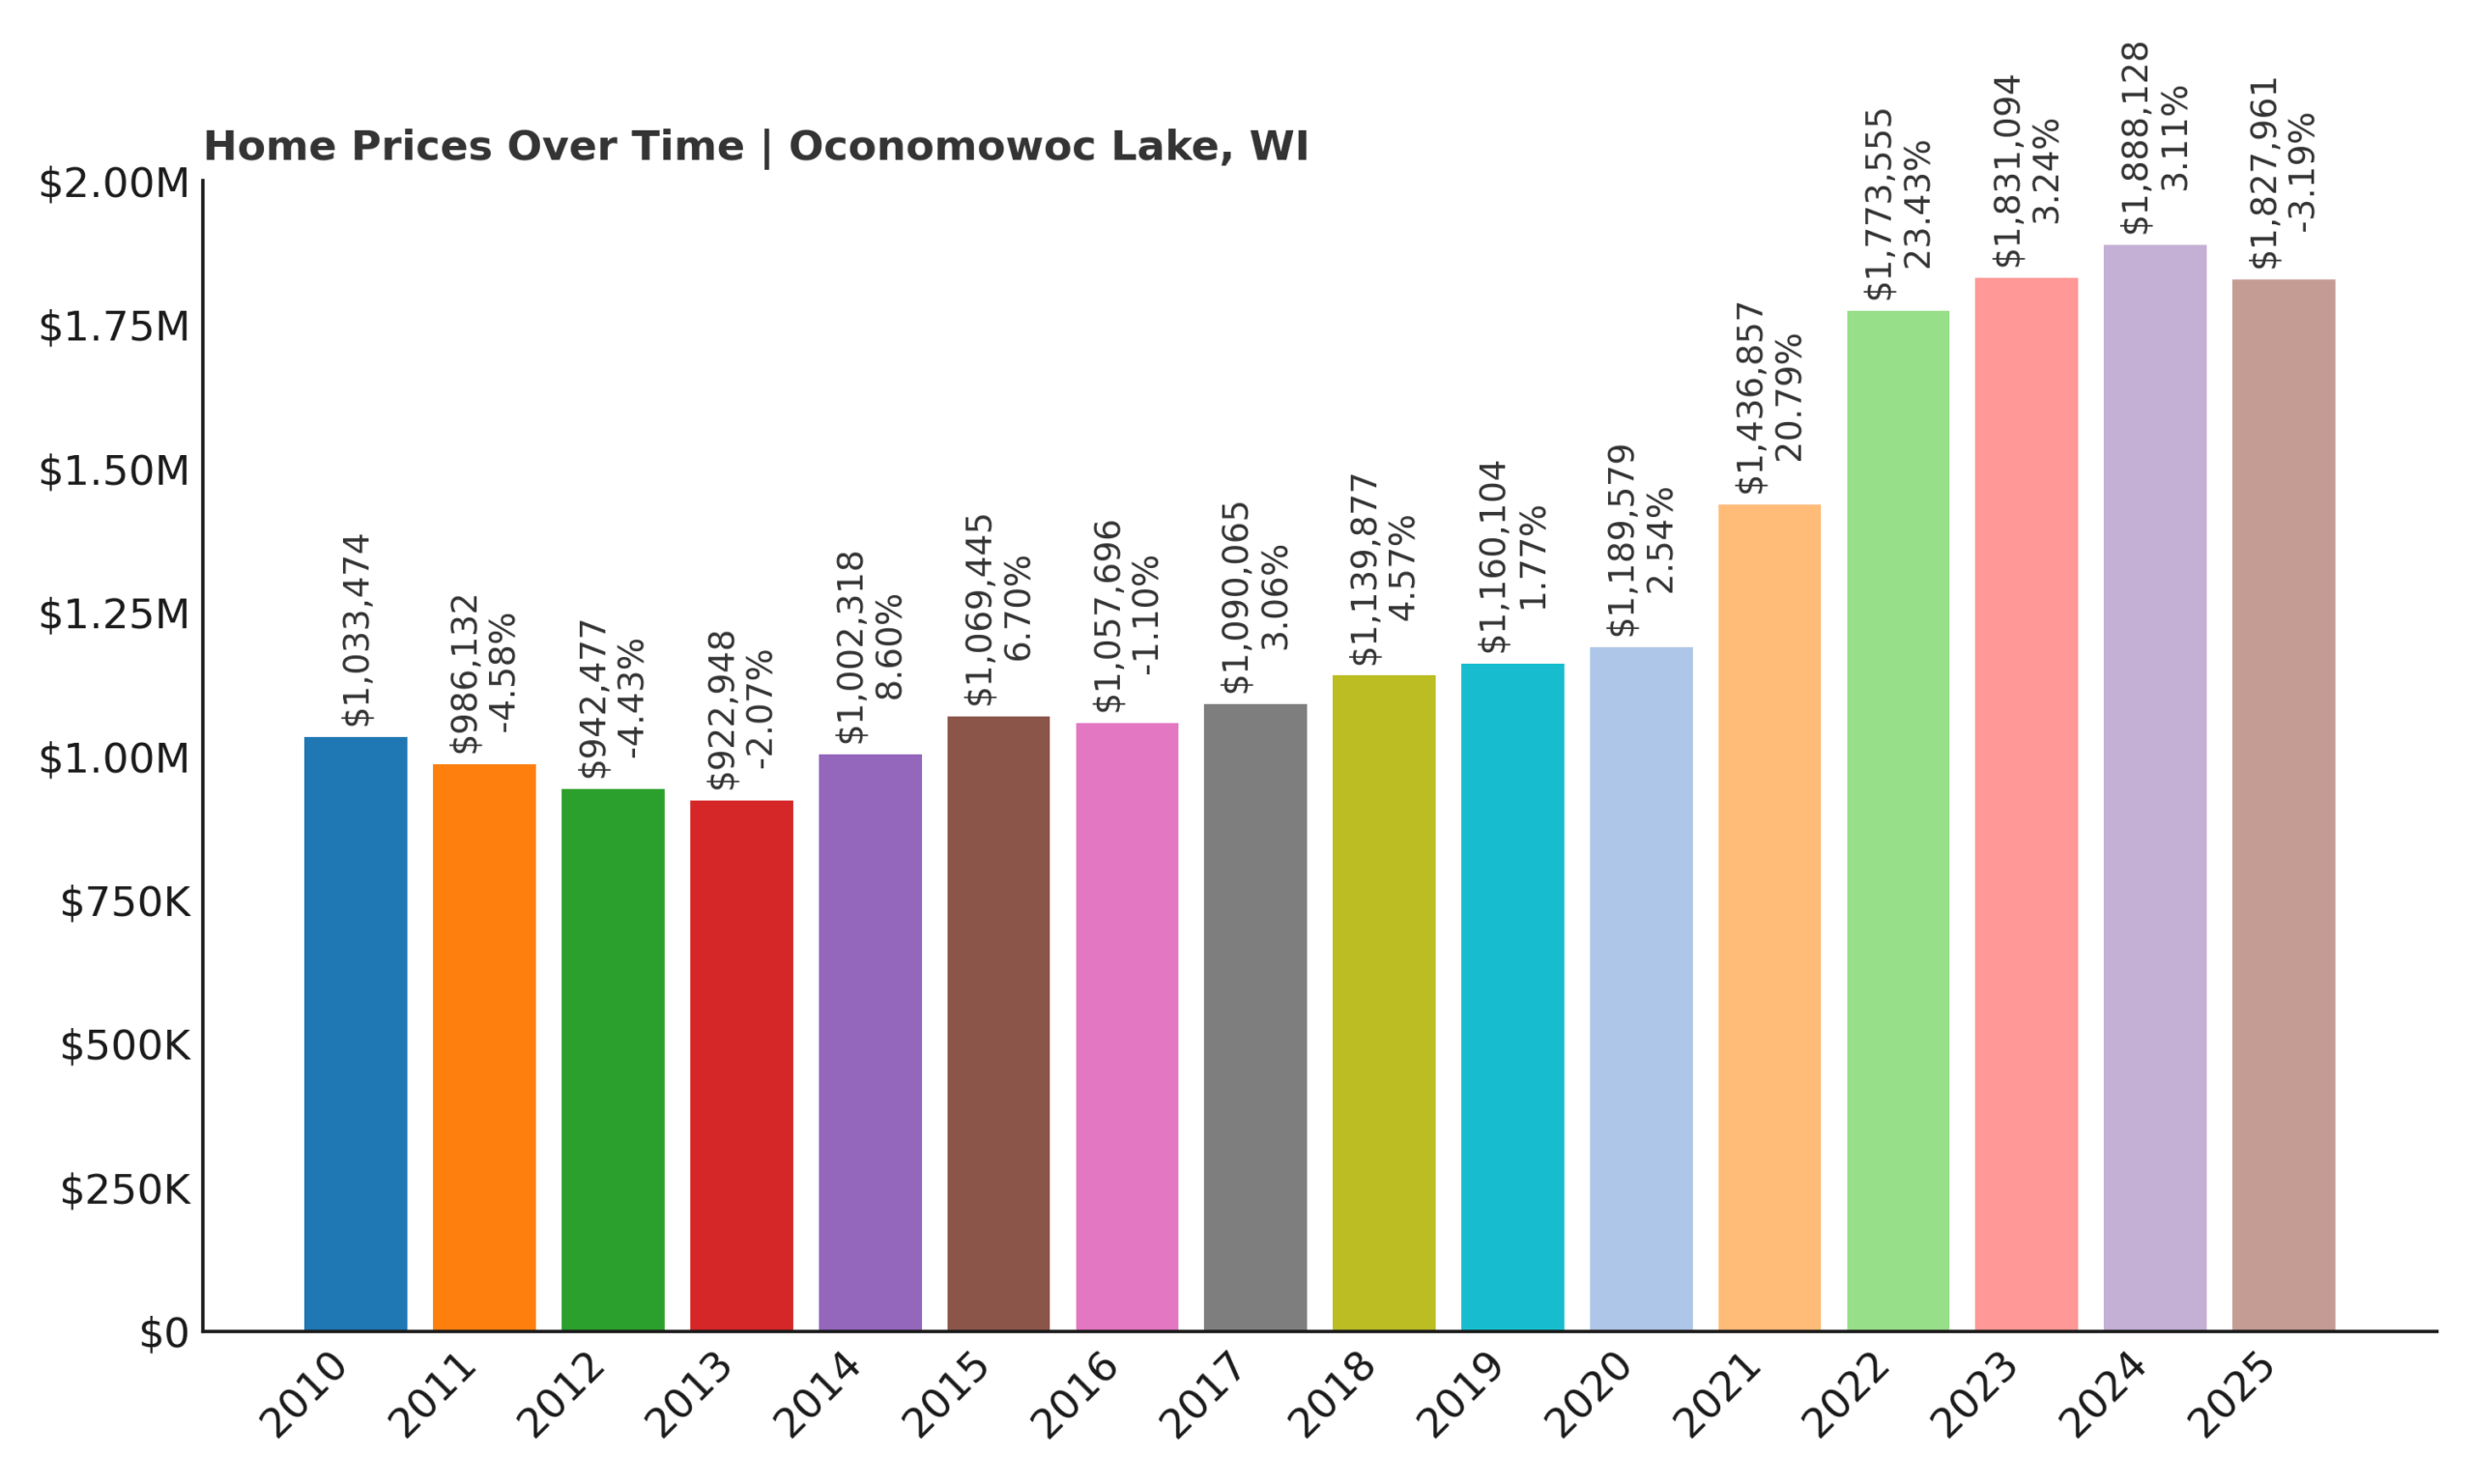
- 2010: $1,033,474
- 2011: $986,132 (-$47,342, -4.58% from previous year)
- 2012: $942,477 (-$43,655, -4.43% from previous year)
- 2013: $922,948 (-$19,529, -2.07% from previous year)
- 2014: $1,002,318 (+$79,371, +8.60% from previous year)
- 2015: $1,069,445 (+$67,127, +6.70% from previous year)
- 2016: $1,057,696 (-$11,748, -1.10% from previous year)
- 2017: $1,090,065 (+$32,368, +3.06% from previous year)
- 2018: $1,139,877 (+$49,813, +4.57% from previous year)
- 2019: $1,160,104 (+$20,227, +1.77% from previous year)
- 2020: $1,189,579 (+$29,475, +2.54% from previous year)
- 2021: $1,436,857 (+$247,278, +20.79% from previous year)
- 2022: $1,773,555 (+$336,698, +23.43% from previous year)
- 2023: $1,831,094 (+$57,539, +3.24% from previous year)
- 2024: $1,888,128 (+$57,034, +3.11% from previous year)
- 2025: $1,827,961 (-$60,168, -3.19% from previous year)
Oconomowoc Lake holds the title for the most expensive town in Wisconsin, with home values averaging over $1.82 million in 2025. Prices have surged nearly 77% since 2010, with an extraordinary run between 2020 and 2022 where values jumped by more than $580,000. Even with a minor decline this past year, Oconomowoc Lake remains in a league of its own.
Oconomowoc Lake – Wisconsin’s Ultimate Waterfront Enclave

Oconomowoc Lake is synonymous with luxury. Located about halfway between Milwaukee and Madison, this private lakefront village has long been a retreat for Wisconsin’s wealthiest families. Properties here are often gated estates with boat houses, private docks, and long winding driveways hidden by thick woods. The village has strict zoning and a fiercely protective community that limits development and ensures privacy. Homes rarely come on the market, and when they do, they attract high-end buyers looking for both exclusivity and tranquility. The entire shoreline is residential, with no public beaches or commercial activity—making it one of the most private lake communities in the Midwest. From century-old mansions to sleek contemporary compounds, the area offers top-tier real estate that continues to command multi-million-dollar price tags.
Much of the price growth here has been driven by out-of-state interest, remote workers, and high-net-worth individuals seeking less crowded luxury alternatives. While nearby towns offer lake access, none match the complete privacy and architectural prestige of Oconomowoc Lake. The pandemic made this difference even more pronounced, as demand for high-end lake properties surged. That demand remains strong, though the market has leveled out slightly after its meteoric rise in 2021 and 2022. Despite a modest dip in 2025, the long-term outlook remains solid, with limited inventory and enduring buyer interest supporting continued strength. Residents value the discretion and elegance that the village provides—it’s not about status signaling here, it’s about enjoying space, beauty, and heritage. Oconomowoc Lake isn’t just the most expensive—it’s the most exclusive, and it has the price history to prove it.