
New Mexico’s most expensive housing markets aren’t limited to Santa Fe. Across the state, prices have surged in upscale mountain towns, artsy enclaves, and desert communities with luxury appeal. Based on the Zillow Home Values Index, 18 towns now stand out for having the highest property prices as of May 2025. Some have seen home values double since 2010, while others have held luxury status through slower, steady growth. Whether driven by natural scenery or buyer demand, these are New Mexico’s priciest places to own a home right now.
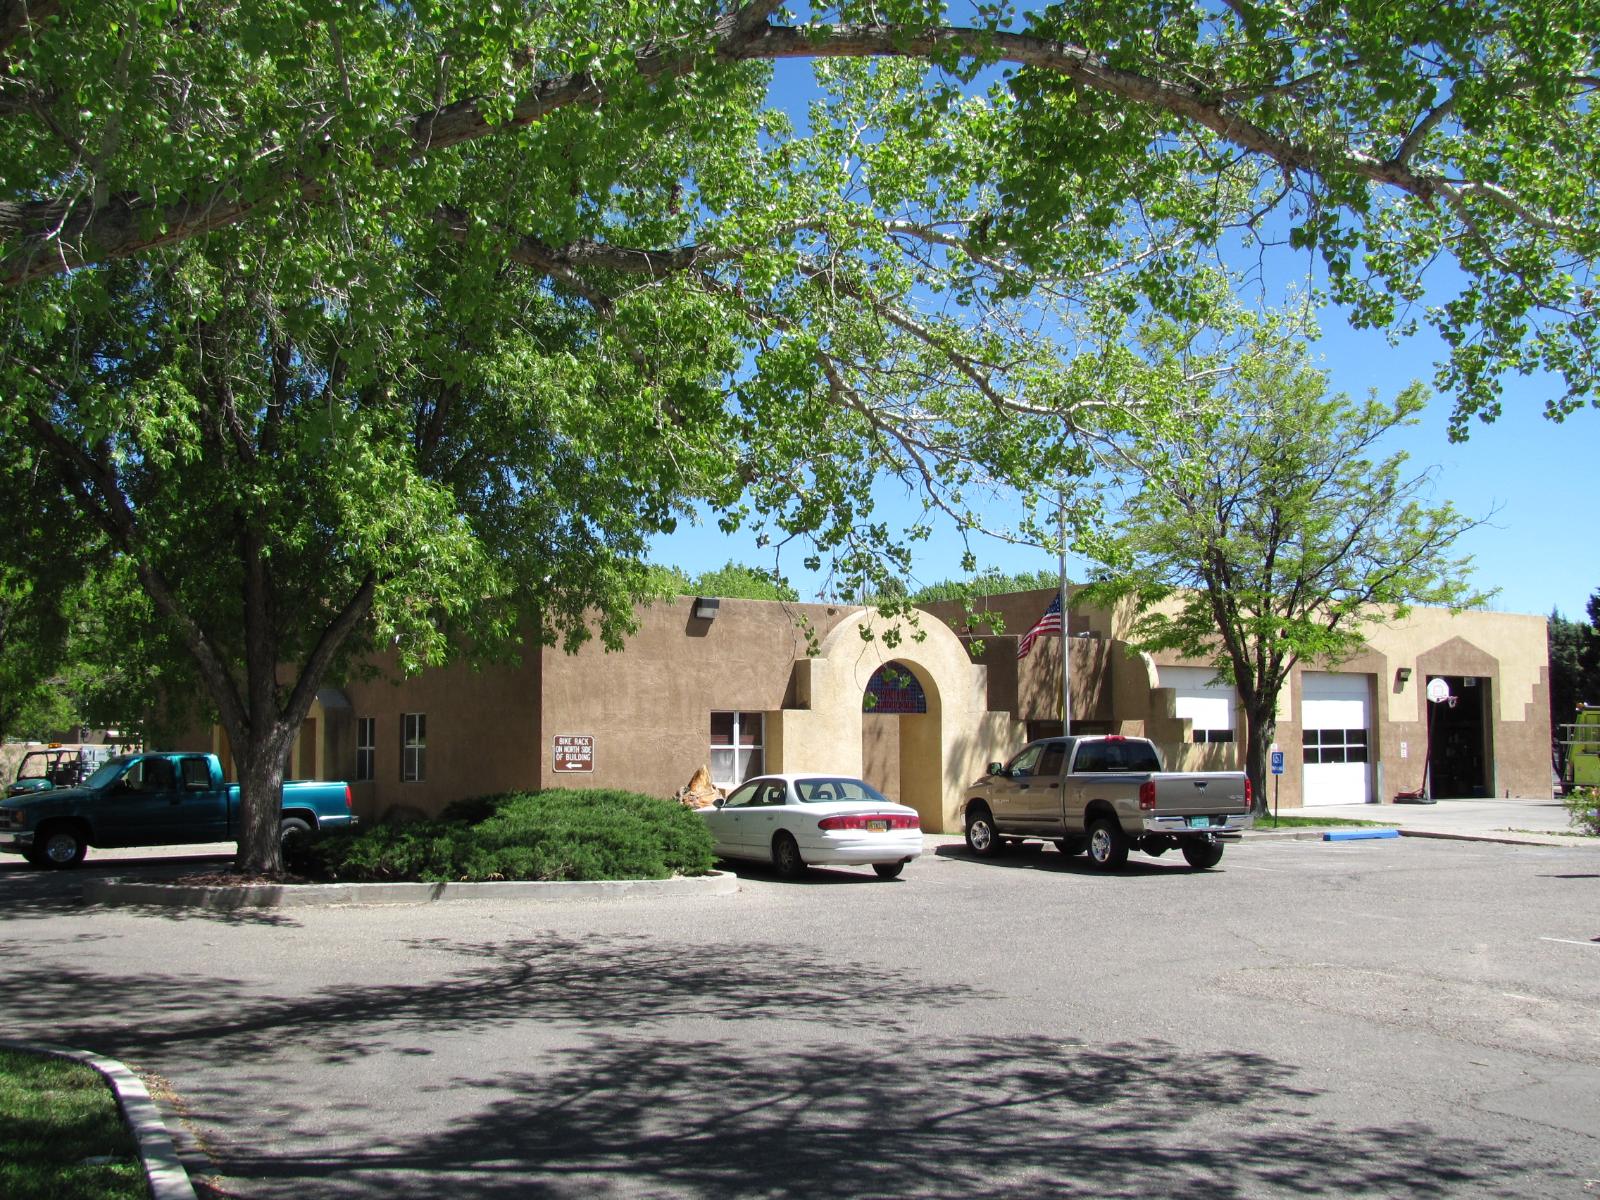
18. Bosque Farms – 133% Home Price Increase Since 2011
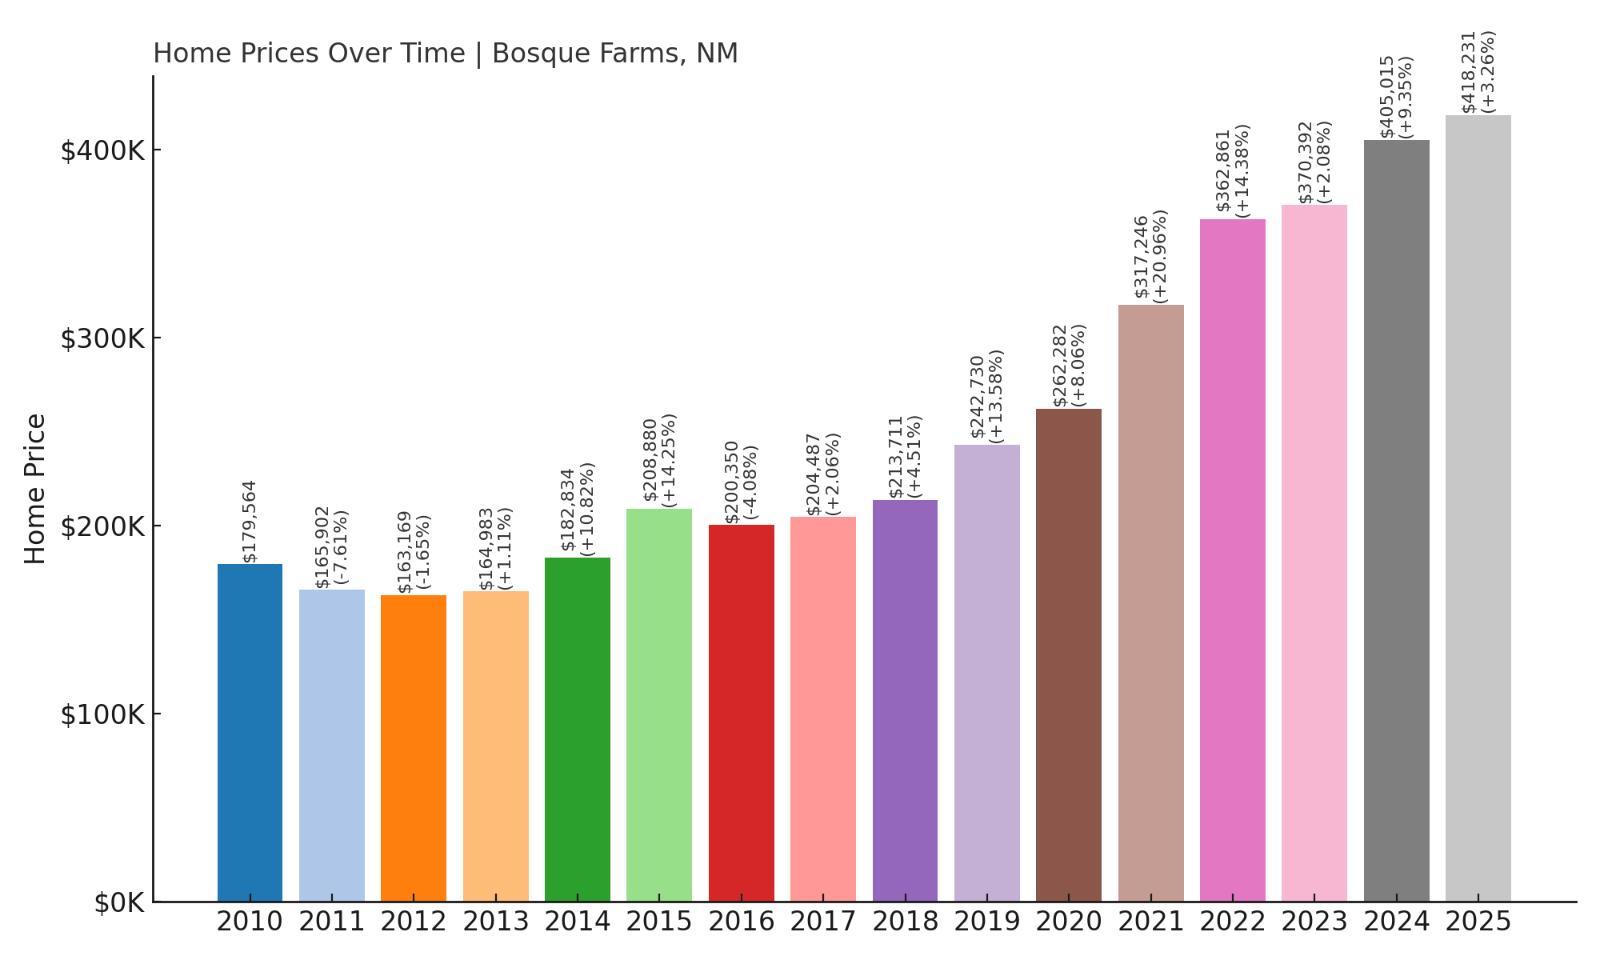
- 2010: $179,564
- 2011: $165,902 (-$13,663, -7.61% from previous year)
- 2012: $163,169 (-$2,732, -1.65% from previous year)
- 2013: $164,983 (+$1,814, +1.11% from previous year)
- 2014: $182,834 (+$17,851, +10.82% from previous year)
- 2015: $208,880 (+$26,046, +14.25% from previous year)
- 2016: $200,350 (-$8,530, -4.08% from previous year)
- 2017: $204,487 (+$4,137, +2.07% from previous year)
- 2018: $213,711 (+$9,223, +4.51% from previous year)
- 2019: $242,730 (+$29,019, +13.58% from previous year)
- 2020: $262,282 (+$19,552, +8.06% from previous year)
- 2021: $317,246 (+$54,964, +20.96% from previous year)
- 2022: $362,861 (+$45,614, +14.38% from previous year)
- 2023: $370,392 (+$7,531, +2.08% from previous year)
- 2024: $405,015 (+$34,624, +9.35% from previous year)
- 2025: $418,231 (+$13,215, +3.26% from previous year)
Bosque Farms has seen home values climb by approximately 133% since 2011, with the median home price reaching $418,231 in 2025. After a slow decline in the early 2010s, values began climbing steadily, hitting major strides during the pandemic-era housing surge. The jump between 2020 and 2021 alone was nearly 21%. Even in recent years, prices have continued to rise, albeit at a more moderate pace. Buyers drawn to semi-rural living within commuting distance to Albuquerque have helped fuel consistent demand.
Bosque Farms – Popular With Commuters and Semi-Rural Buyers
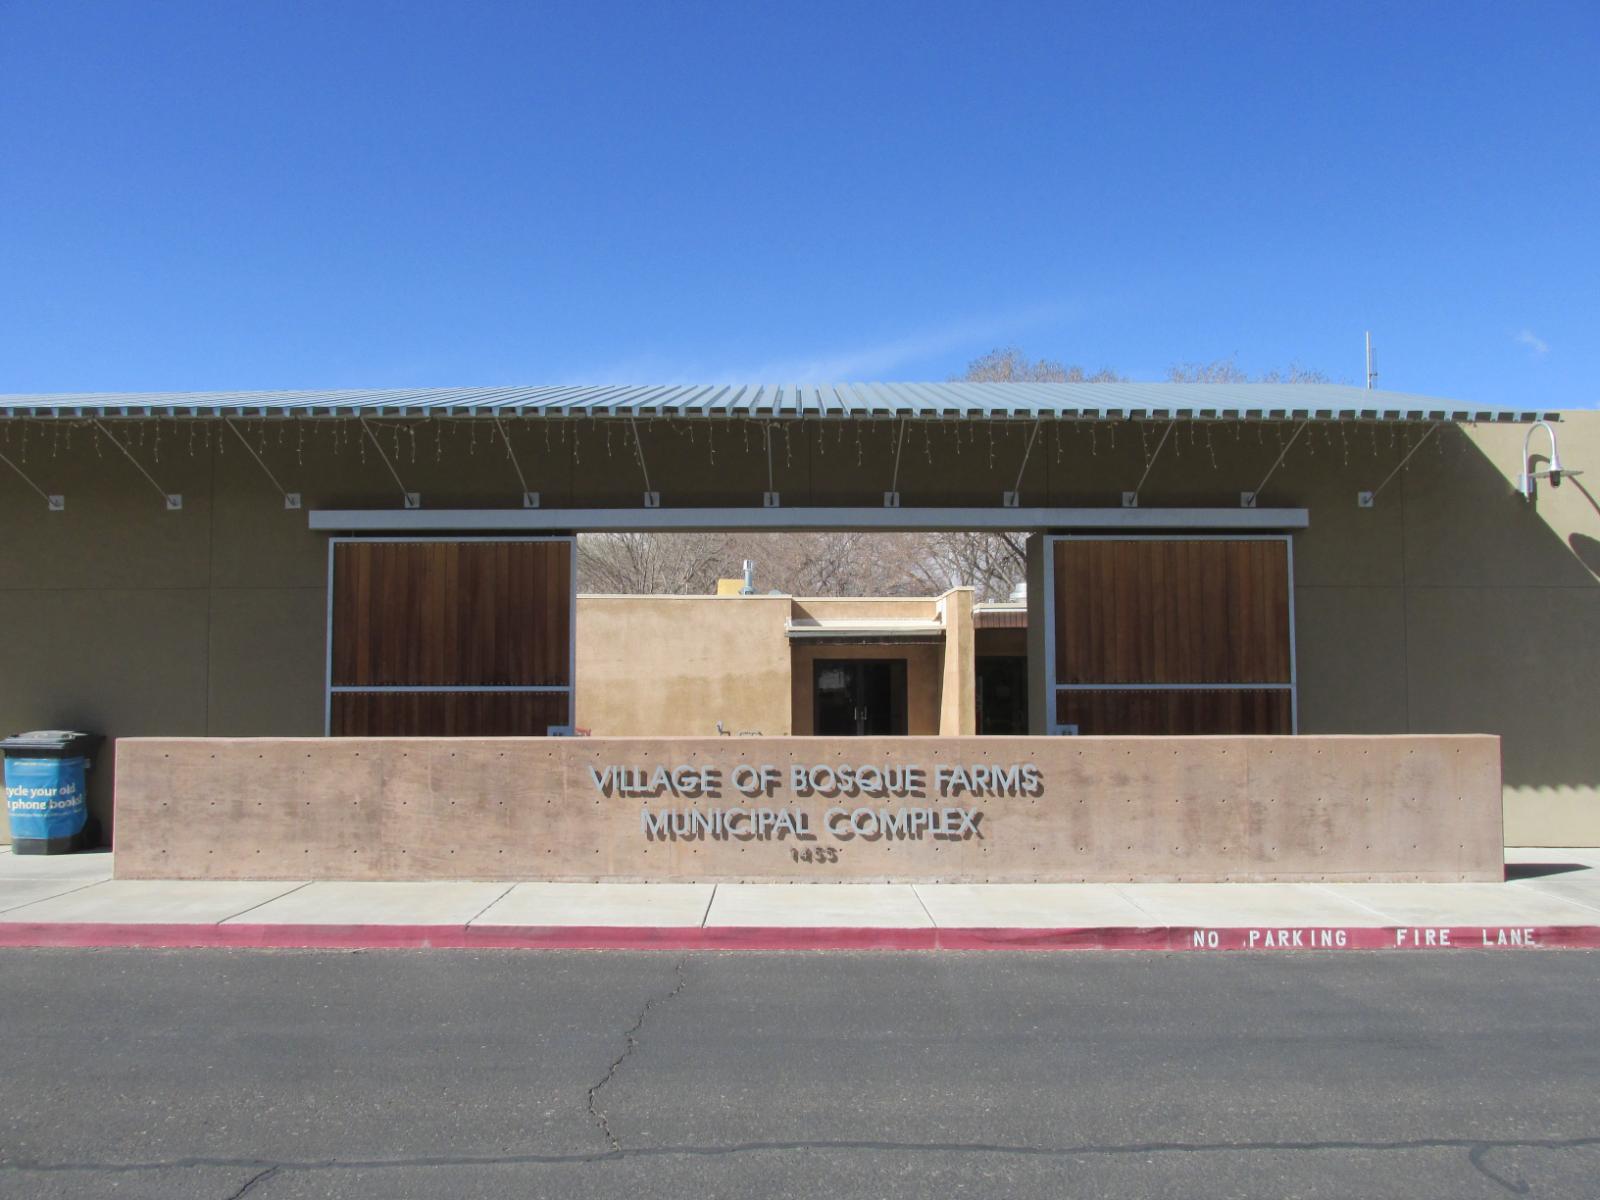
Located just 20 minutes south of Albuquerque, Bosque Farms offers a rare combination of quiet living with easy city access. This small village is known for its horse properties, open space, and relaxed pace of life, making it a favorite for professionals who want space without sacrificing convenience. Over the past decade, infrastructure improvements and steady growth in Albuquerque’s job market have made Bosque Farms increasingly attractive for homebuyers priced out of the metro core.
Unlike resort towns or tourism-heavy regions, Bosque Farms has maintained a stable residential character. The upward price movement here reflects long-term buyer interest in large lots and single-family homes, not short-term speculation. Schools and local services are modest but dependable, and while the commercial scene is limited, nearby Los Lunas and Albuquerque fill in the gaps. In short, Bosque Farms’ housing market reflects the draw of rural living within reach of a larger economy.
17. Red River – N/A% Home Price Increase (Data Begins 2024)

- 2010: N/A
- 2011: N/A
- 2012: N/A
- 2013: N/A
- 2014: N/A
- 2015: N/A
- 2016: N/A
- 2017: N/A
- 2018: N/A
- 2019: N/A
- 2020: N/A
- 2021: N/A
- 2022: N/A
- 2023: N/A
- 2024: $424,462
- 2025: $422,899 (-$1,563, -0.37% from previous year)
Reliable data for Red River home prices begins only in 2024, with a slight dip noted in 2025 to $422,899. This makes year-over-year analysis limited, but even with the small drop, Red River’s placement among New Mexico’s most expensive towns speaks to its premium real estate profile. Surrounded by the Sangre de Cristo Mountains, Red River’s desirability is deeply tied to its location and its role as a year-round recreational destination.
Red River – A Rocky Mountain Retreat with Seasonal Pull
Red River is one of northern New Mexico’s best-known mountain resort towns, attracting skiers in winter and hikers, anglers, and mountain bikers in summer. It sits at nearly 8,700 feet in elevation, and its housing stock includes a mix of rustic cabins, vacation homes, and high-end ski chalets. Demand is driven by both short-term rentals and second-home buyers, which creates upward pressure on prices despite its remote location.
While local amenities are limited to seasonal shops, outfitters, and dining, the area’s natural appeal gives it staying power. Red River’s tight housing inventory often leads to sharp pricing, and even minor market fluctuations can cause big shifts in reported value. The mild dip in 2025 doesn’t necessarily indicate a downward trend but reflects price stabilization after years of growth that occurred before public data was tracked. As tourism rebounds and remote work continues to allow mountain living, Red River is expected to remain among the priciest areas in the state.
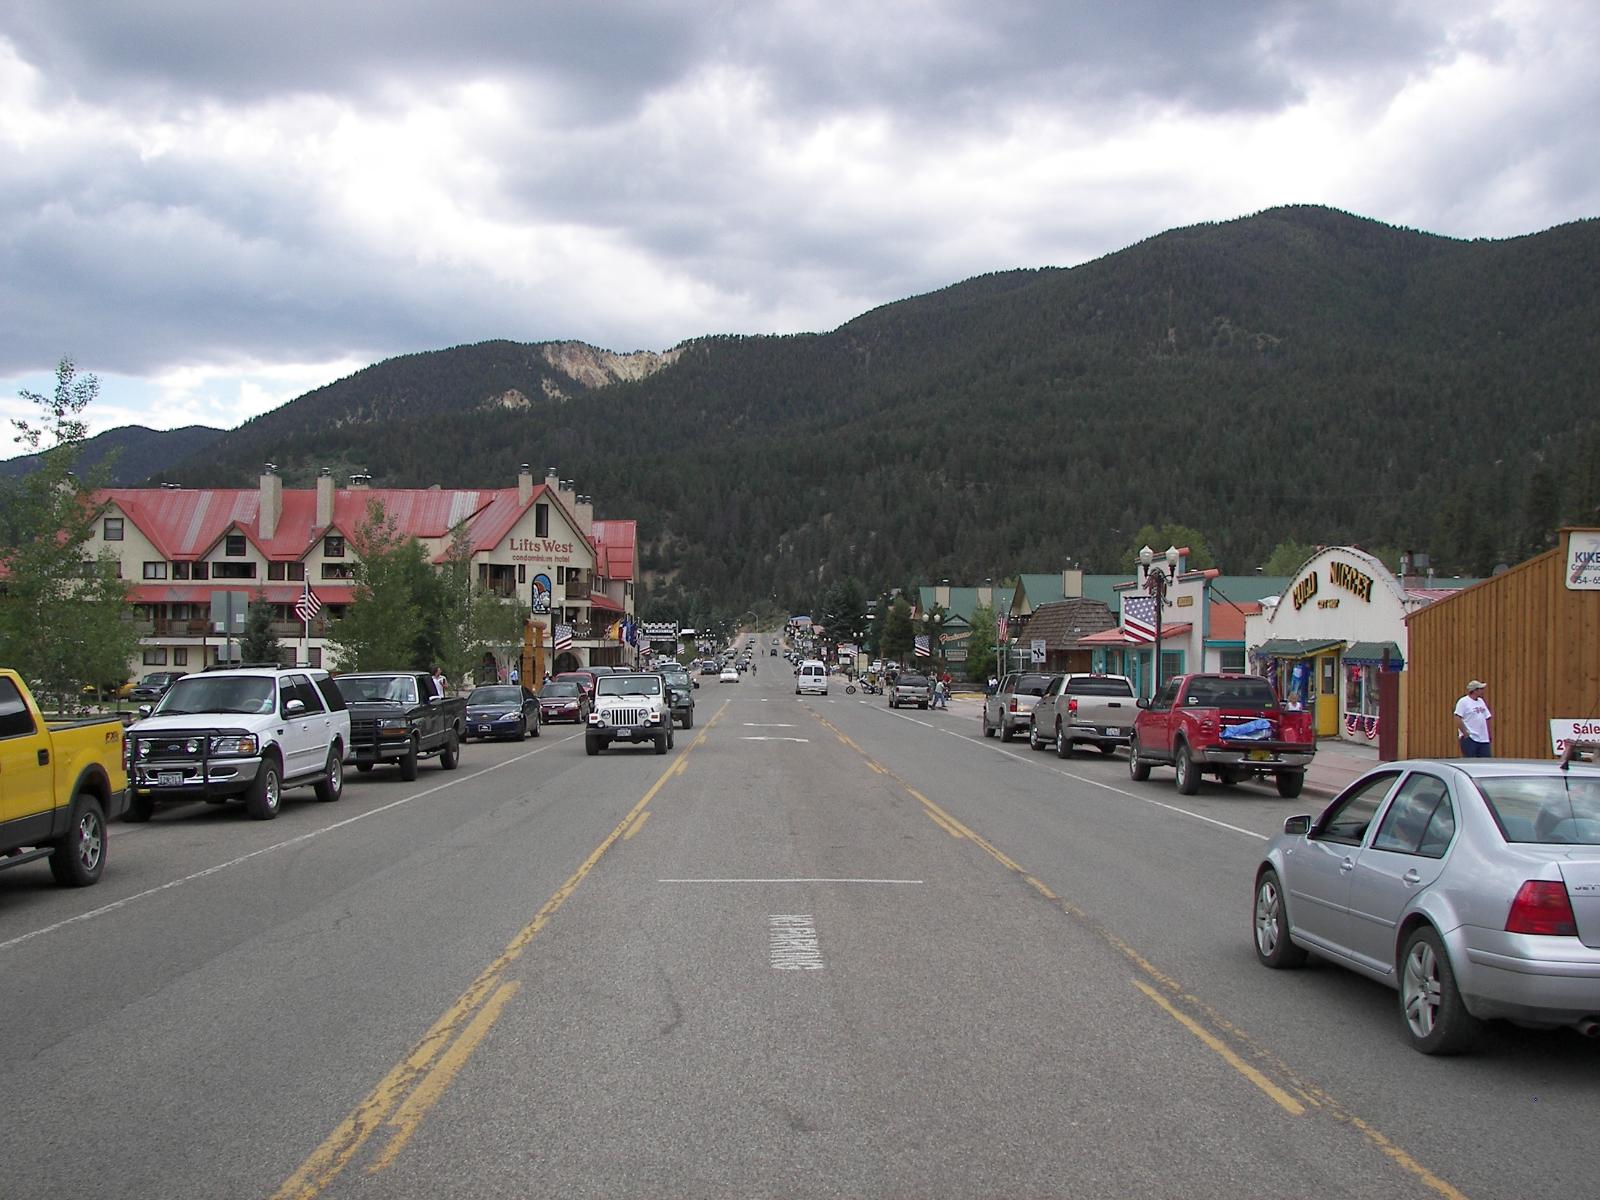
16. Tijeras – 93% Home Price Increase Since 2012
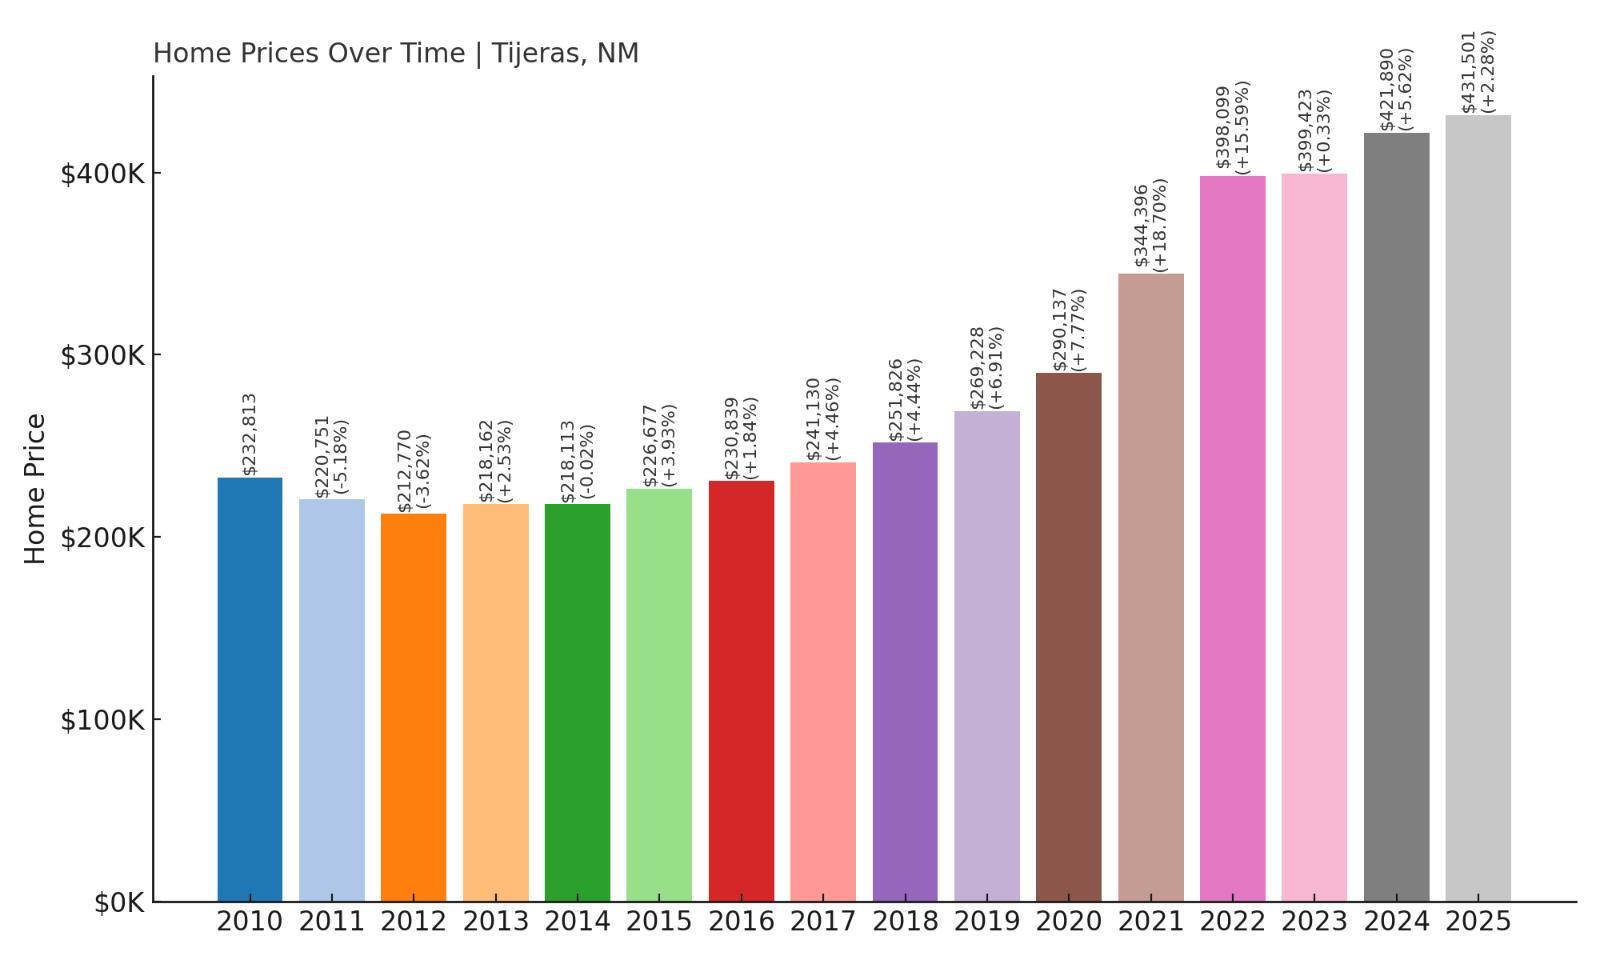
- 2010: $232,813
- 2011: $220,751 (-$12,062, -5.18% from previous year)
- 2012: $212,770 (-$7,981, -3.62% from previous year)
- 2013: $218,162 (+$5,391, +2.53% from previous year)
- 2014: $218,113 (-$48, -0.02% from previous year)
- 2015: $226,677 (+$8,564, +3.93% from previous year)
- 2016: $230,839 (+$4,162, +1.84% from previous year)
- 2017: $241,130 (+$10,290, +4.46% from previous year)
- 2018: $251,826 (+$10,696, +4.44% from previous year)
- 2019: $269,228 (+$17,403, +6.91% from previous year)
- 2020: $290,137 (+$20,909, +7.77% from previous year)
- 2021: $344,396 (+$54,259, +18.70% from previous year)
- 2022: $398,099 (+$53,703, +15.59% from previous year)
- 2023: $399,423 (+$1,325, +0.33% from previous year)
- 2024: $421,890 (+$22,467, +5.62% from previous year)
- 2025: $431,501 (+$9,611, +2.28% from previous year)
Tijeras has experienced a 93% increase in home values since 2012, climbing from $212,770 to $431,501 in 2025. Growth has been steady, with notable acceleration beginning around 2020, followed by double-digit gains in 2021 and 2022. While growth has cooled since then, the upward trajectory remains intact, suggesting enduring appeal and demand.
Tijeras – Affordable Forest Living Near Albuquerque
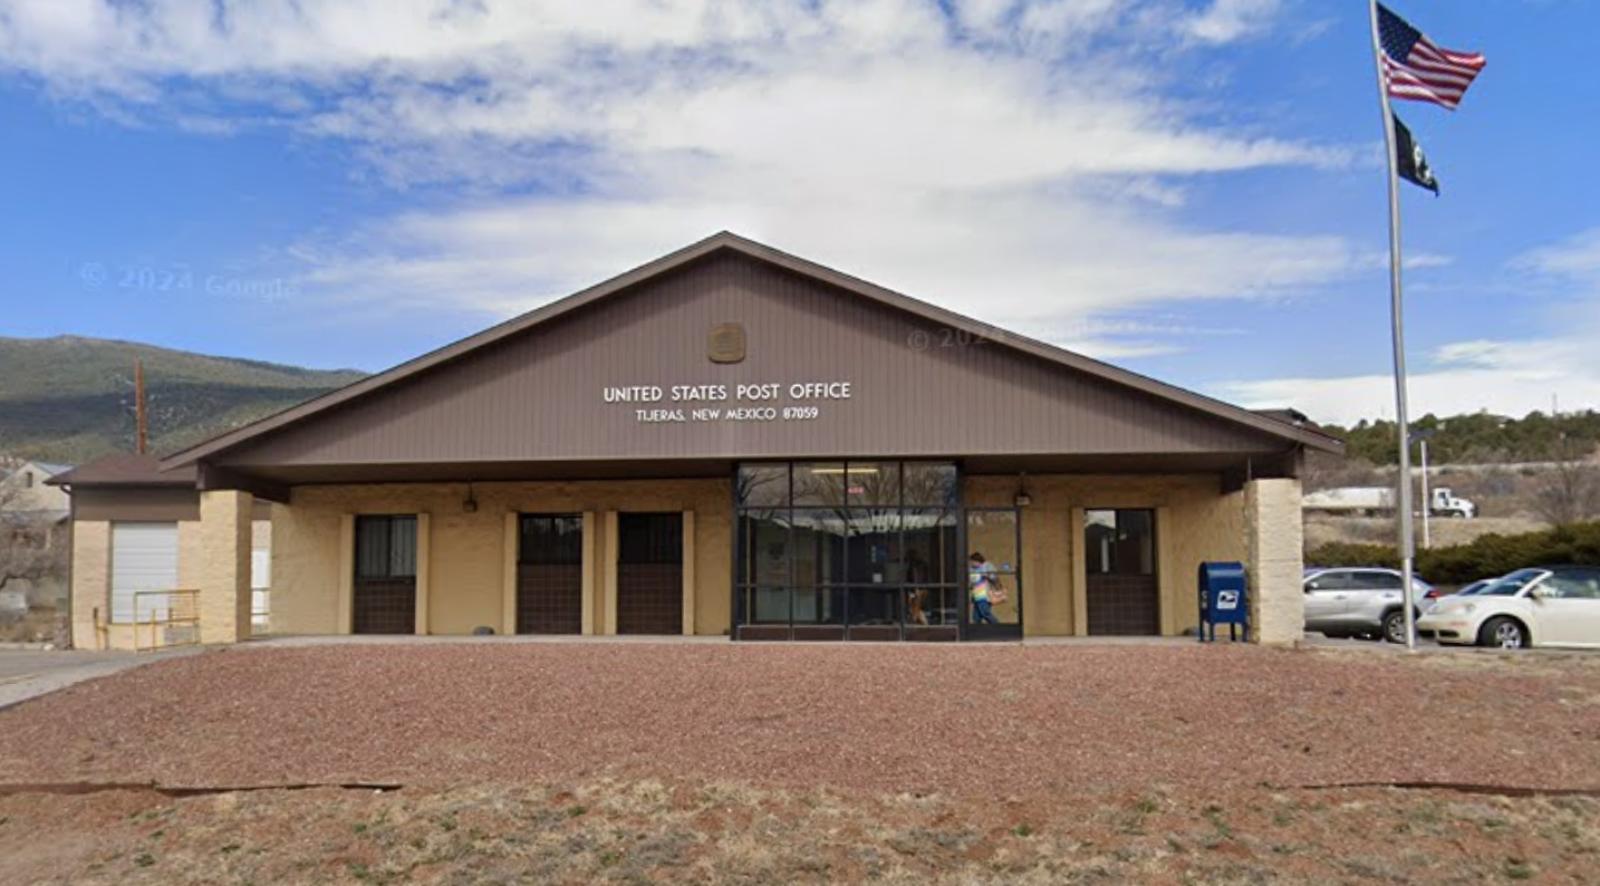
Tijeras is nestled in the Sandia Mountains just east of Albuquerque and offers wooded landscapes, mountain air, and direct access to outdoor activities. Despite its rustic charm, it remains connected to the city via Interstate 40, making it a viable home base for commuters who want to live away from the sprawl. This balance of privacy and proximity has made it popular among retirees, remote workers, and outdoor enthusiasts alike.
The housing stock is composed mostly of detached homes on spacious lots, many of which take advantage of mountain views and forested surroundings. Price spikes during the pandemic reflected the area’s appeal to buyers seeking space and serenity. Continued moderate growth since 2023 shows that while the frenzy may have passed, Tijeras retains its status as one of the more desirable—and therefore expensive—spots in New Mexico real estate.
15. Ranchos de Taos – 68% Home Price Increase Since 2012
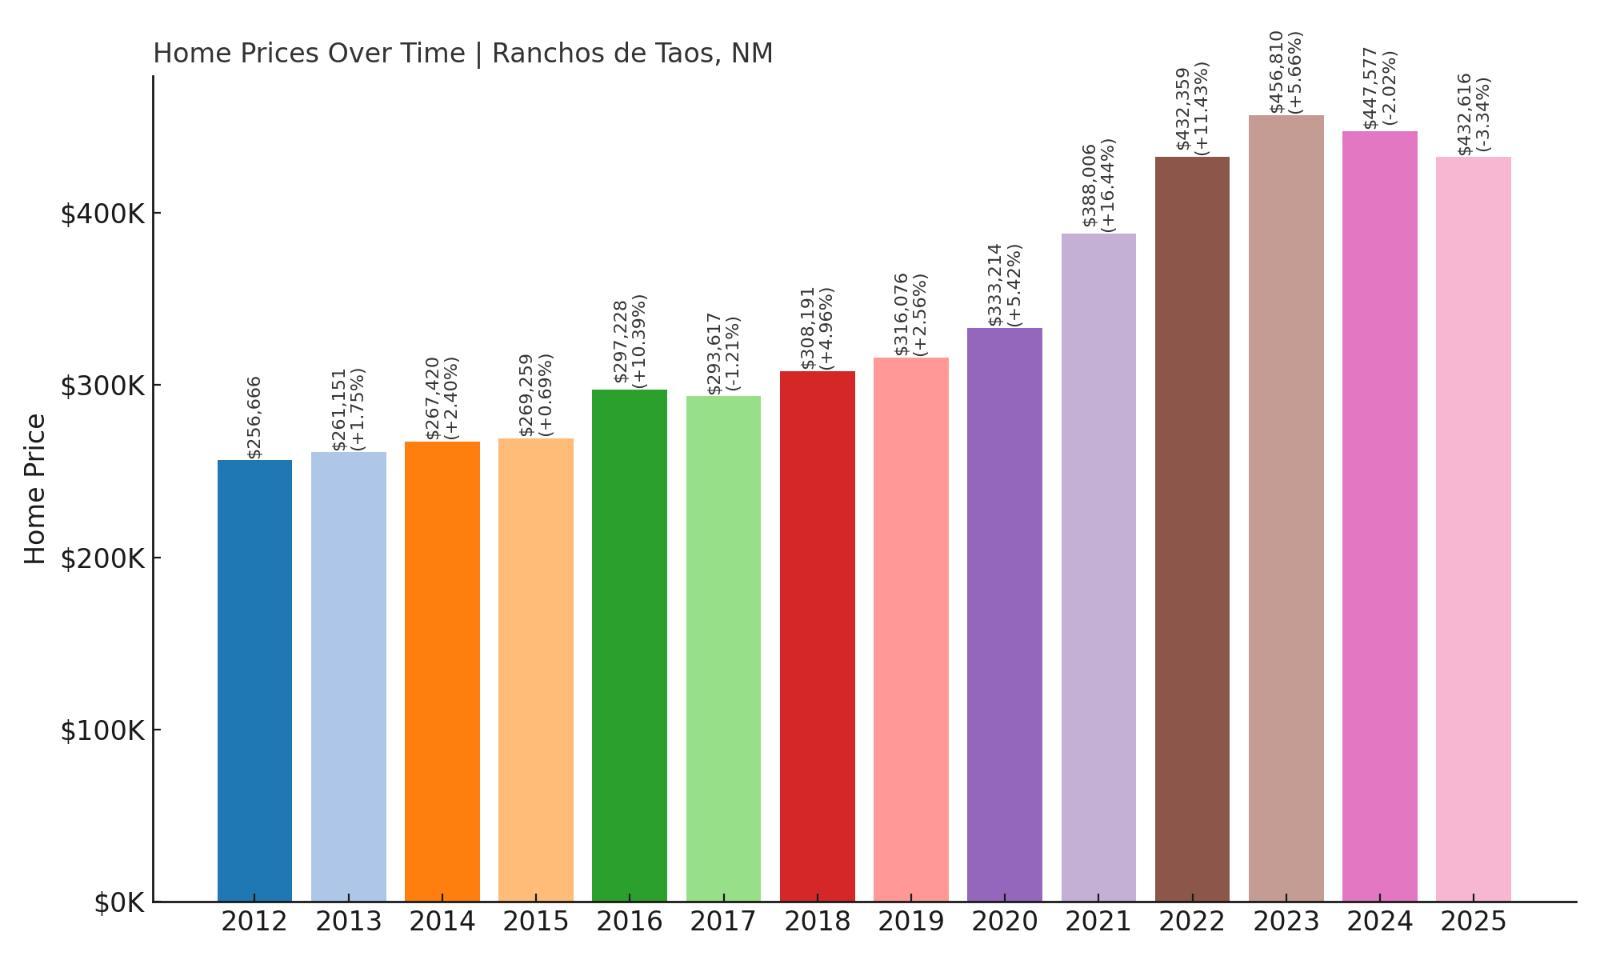
- 2010: N/A
- 2011: N/A
- 2012: $256,666
- 2013: $261,151 (+$4,485, +1.75% from previous year)
- 2014: $267,420 (+$6,269, +2.40% from previous year)
- 2015: $269,259 (+$1,839, +0.69% from previous year)
- 2016: $297,228 (+$27,969, +10.39% from previous year)
- 2017: $293,617 (-$3,611, -1.21% from previous year)
- 2018: $308,191 (+$14,574, +4.96% from previous year)
- 2019: $316,076 (+$7,886, +2.56% from previous year)
- 2020: $333,214 (+$17,137, +5.42% from previous year)
- 2021: $388,006 (+$54,792, +16.44% from previous year)
- 2022: $432,359 (+$44,353, +11.43% from previous year)
- 2023: $456,810 (+$24,452, +5.66% from previous year)
- 2024: $447,577 (-$9,234, -2.02% from previous year)
- 2025: $432,616 (-$14,960, -3.34% from previous year)
Home prices in Ranchos de Taos have increased 68% since 2012, despite recent pullbacks. The peak came in 2023 at over $456K, followed by two years of slight decline to $432,616 in 2025. The overall trend reflects strong appreciation over the last decade, with particularly steep gains during the pandemic-fueled market.
Ranchos de Taos – Historic Adobe Charm Meets Market Demand
Ranchos de Taos is perhaps best known for the iconic San Francisco de Asís Mission Church, but this small village just south of Taos has more to offer than postcard charm. With its adobe-style homes, art culture, and easy access to both nature and the city of Taos, it remains a desirable location for both full-time residents and second-home buyers. The area’s cultural appeal and architectural distinctiveness contribute to its strong housing demand.
Though not immune to market corrections, prices in Ranchos de Taos have stayed relatively high due to limited housing inventory and its continued popularity among retirees, artists, and out-of-state buyers. The slight price dips in 2024 and 2025 may reflect broader market adjustments, but the long-term price trajectory underscores its lasting allure as one of New Mexico’s more upscale real estate markets.
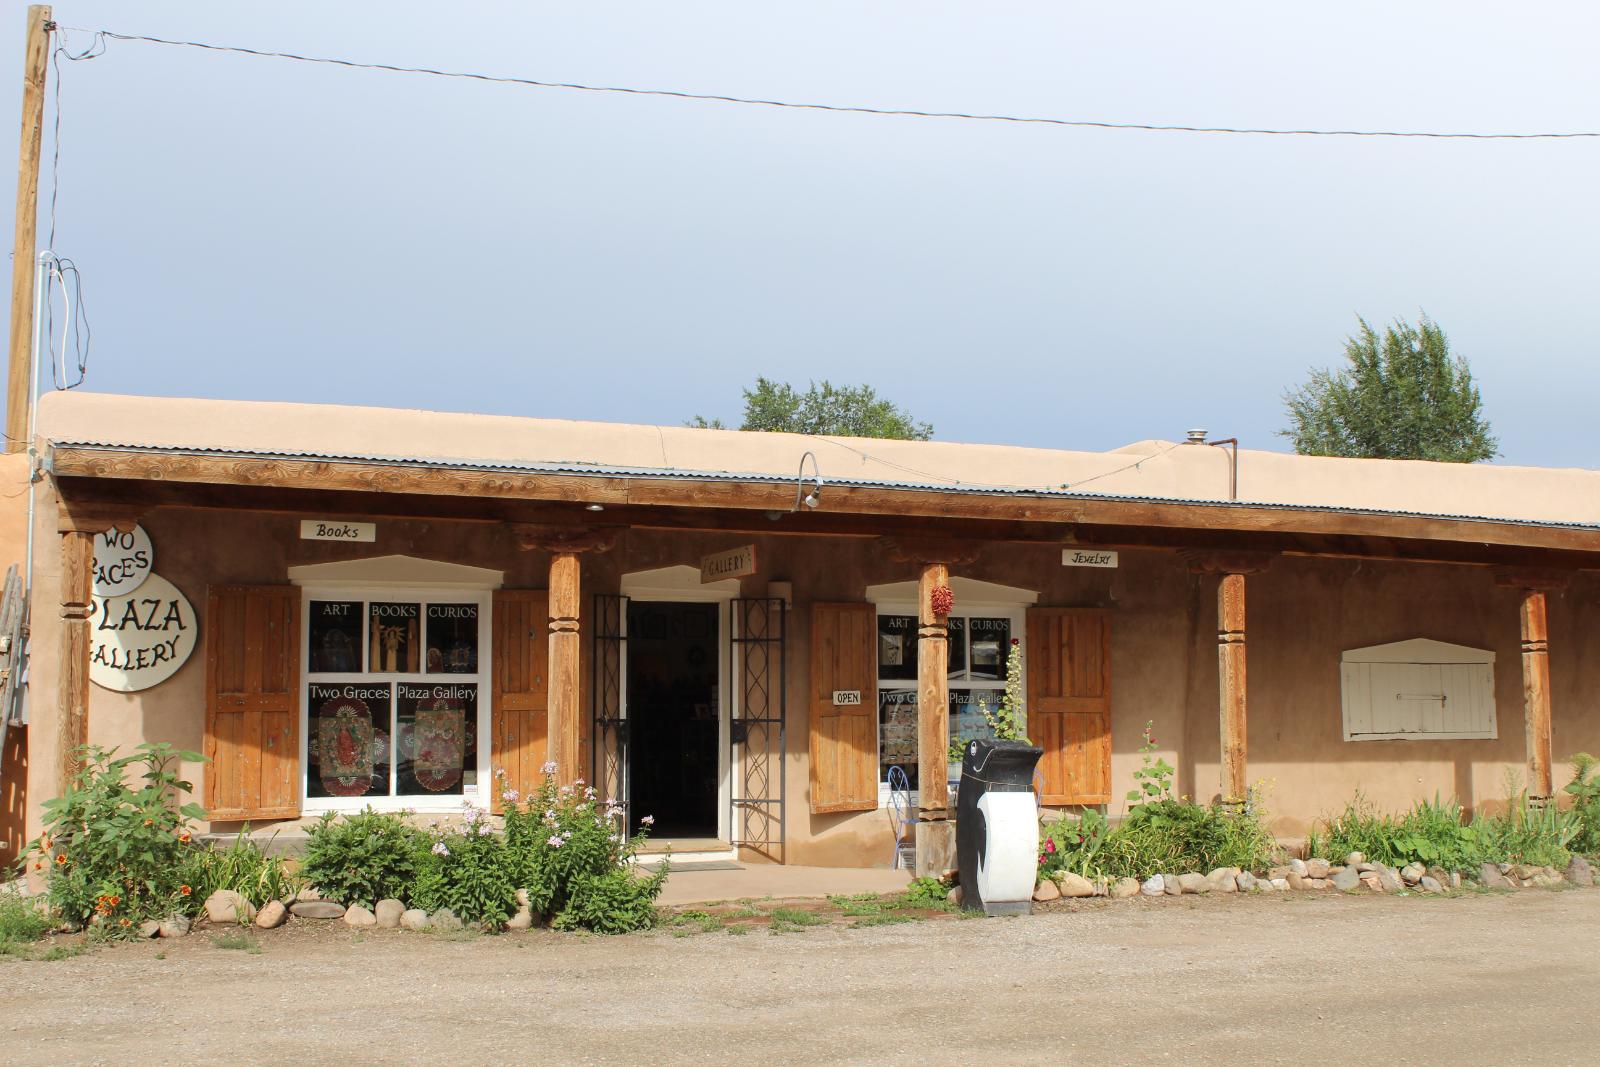
14. Taos – 65% Home Price Increase Since 2012
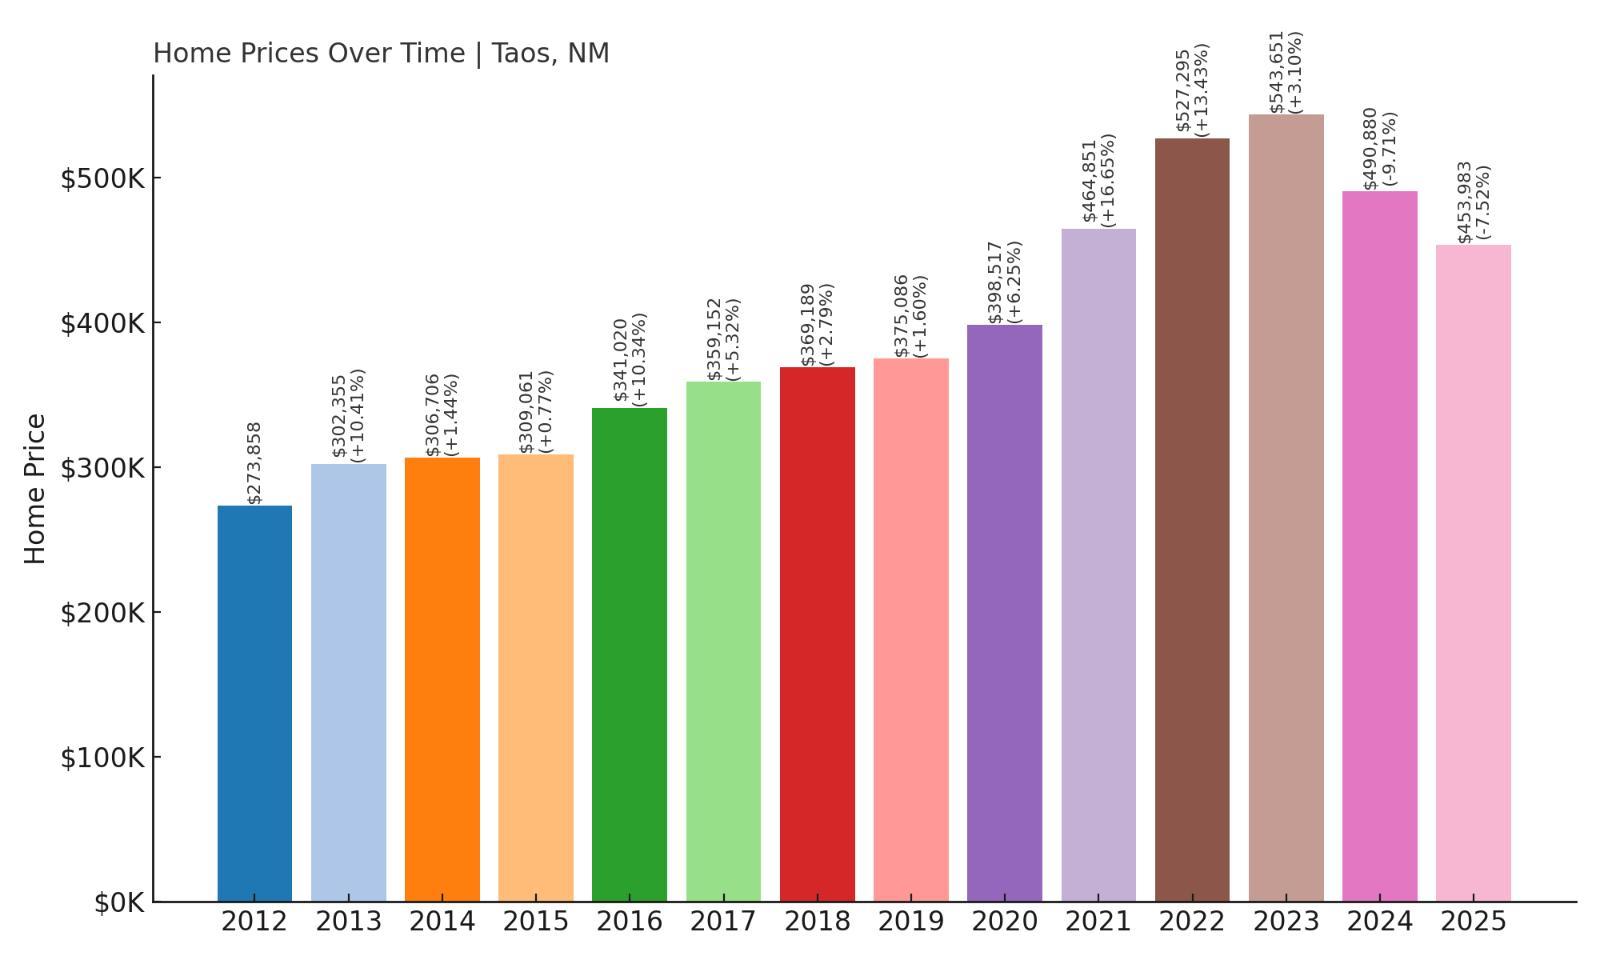
- 2010: N/A
- 2011: N/A
- 2012: $273,858
- 2013: $302,355 (+$28,497, +10.41% from previous year)
- 2014: $306,706 (+$4,351, +1.44% from previous year)
- 2015: $309,061 (+$2,355, +0.77% from previous year)
- 2016: $341,020 (+$31,959, +10.34% from previous year)
- 2017: $359,152 (+$18,132, +5.32% from previous year)
- 2018: $369,189 (+$10,037, +2.79% from previous year)
- 2019: $375,086 (+$5,897, +1.60% from previous year)
- 2020: $398,517 (+$23,431, +6.25% from previous year)
- 2021: $464,851 (+$66,335, +16.65% from previous year)
- 2022: $527,295 (+$62,443, +13.43% from previous year)
- 2023: $543,651 (+$16,356, +3.10% from previous year)
- 2024: $490,880 (-$52,771, -9.71% from previous year)
- 2025: $453,983 (-$36,897, -7.52% from previous year)
Home values in Taos have risen by 65% since 2012, with a high point in 2023 followed by two consecutive years of notable declines. The current median home price in 2025 stands at $453,983, reflecting both the long-term appeal and the short-term volatility of this famous mountain town.
Taos – Art, Altitude, and Price Corrections
Taos is one of the most recognized destinations in New Mexico, combining a rich cultural scene with dramatic mountain views and four-season recreation. It has long drawn artists, creatives, and high-end tourists, contributing to a real estate market that is both competitive and dynamic. Limited land for new construction and ongoing demand for vacation homes keep prices high relative to other parts of the state.
The declines in 2024 and 2025 may reflect a correction following rapid appreciation during the pandemic years. However, Taos’ fundamental appeal remains strong. Buyers are paying for location, amenities, and a lifestyle, not just square footage. With tourism rebounding and long-term demand steady, the town’s home values may well stabilize or rebound in the coming years, keeping it near the top of New Mexico’s price rankings.
13. Cedar Crest – 91% Home Price Increase Since 2012
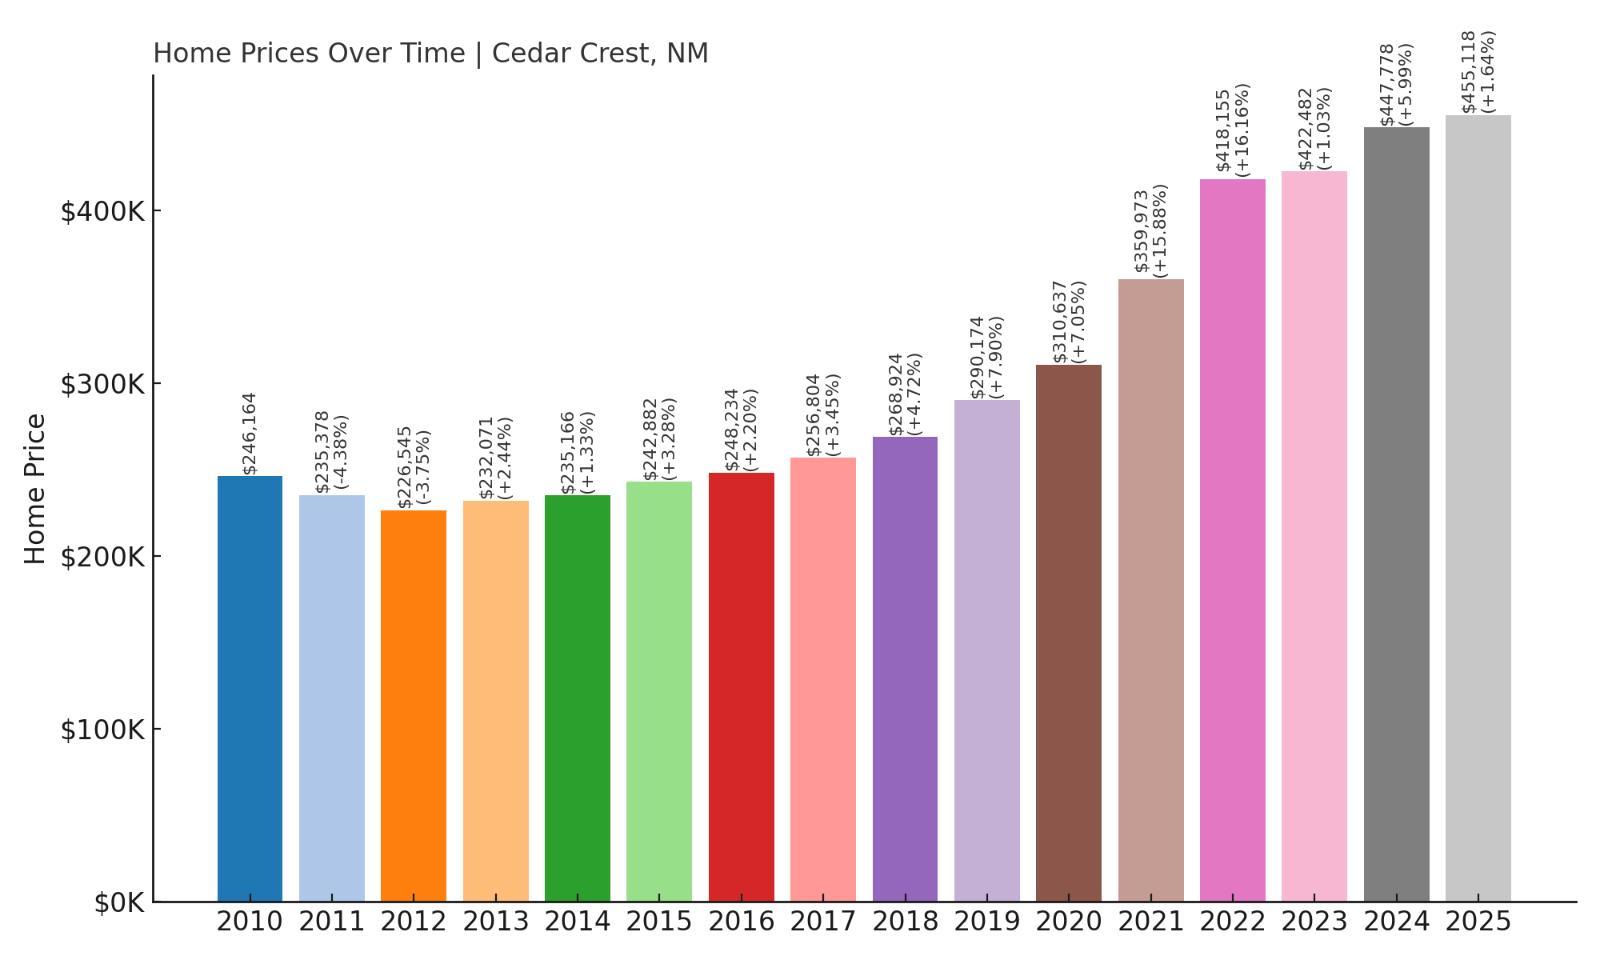
- 2010: $246,164
- 2011: $235,378 (-$10,786, -4.38% from previous year)
- 2012: $226,545 (-$8,833, -3.75% from previous year)
- 2013: $232,071 (+$5,525, +2.44% from previous year)
- 2014: $235,166 (+$3,095, +1.33% from previous year)
- 2015: $242,882 (+$7,717, +3.28% from previous year)
- 2016: $248,234 (+$5,352, +2.20% from previous year)
- 2017: $256,804 (+$8,570, +3.45% from previous year)
- 2018: $268,924 (+$12,120, +4.72% from previous year)
- 2019: $290,174 (+$21,250, +7.90% from previous year)
- 2020: $310,637 (+$20,462, +7.05% from previous year)
- 2021: $359,973 (+$49,336, +15.88% from previous year)
- 2022: $418,155 (+$58,182, +16.16% from previous year)
- 2023: $422,482 (+$4,328, +1.03% from previous year)
- 2024: $447,778 (+$25,296, +5.99% from previous year)
- 2025: $455,118 (+$7,340, +1.64% from previous year)
Cedar Crest home prices have risen by 91% since 2012, making this small community one of the most steadily appreciating markets in New Mexico. After a slow rebound from early 2010s price dips, growth gained momentum in 2019 and especially took off during the post-pandemic housing boom. With values now exceeding $455,000, Cedar Crest stands as a popular choice for buyers looking for a mix of nature, privacy, and access to Albuquerque, all within a short drive.
Cedar Crest – Mountain Views and Consistent Appreciation
Tucked into the eastern slope of the Sandia Mountains, Cedar Crest offers residents pine forests, open skies, and cooler temperatures than the desert floor below. It’s the kind of place that attracts buyers who want a home near hiking trails and mountain vistas but still need to commute into Albuquerque for work or services. The town benefits from its location along the scenic Turquoise Trail (NM-14), giving it a distinct mix of natural beauty and cultural flavor. As Albuquerque’s eastern suburbs have expanded, Cedar Crest has become more desirable to professionals, retirees, and second-home buyers, driving up property values across the board.
Unlike some resort-driven markets, Cedar Crest’s growth has been gradual and broad-based. Much of its housing stock consists of custom homes nestled into the foothills, many on large lots or acreage, which enhances both privacy and long-term value. Infrastructure improvements and broadband expansion have also made the area more practical for remote work, accelerating demand in recent years. Despite a small cooldown in 2023, the market regained strength in 2024, and 2025 saw further gains. For those seeking mountain living without extreme isolation, Cedar Crest continues to be one of the most solid bets in the state.
12. El Prado – 83% Home Price Increase Since 2012
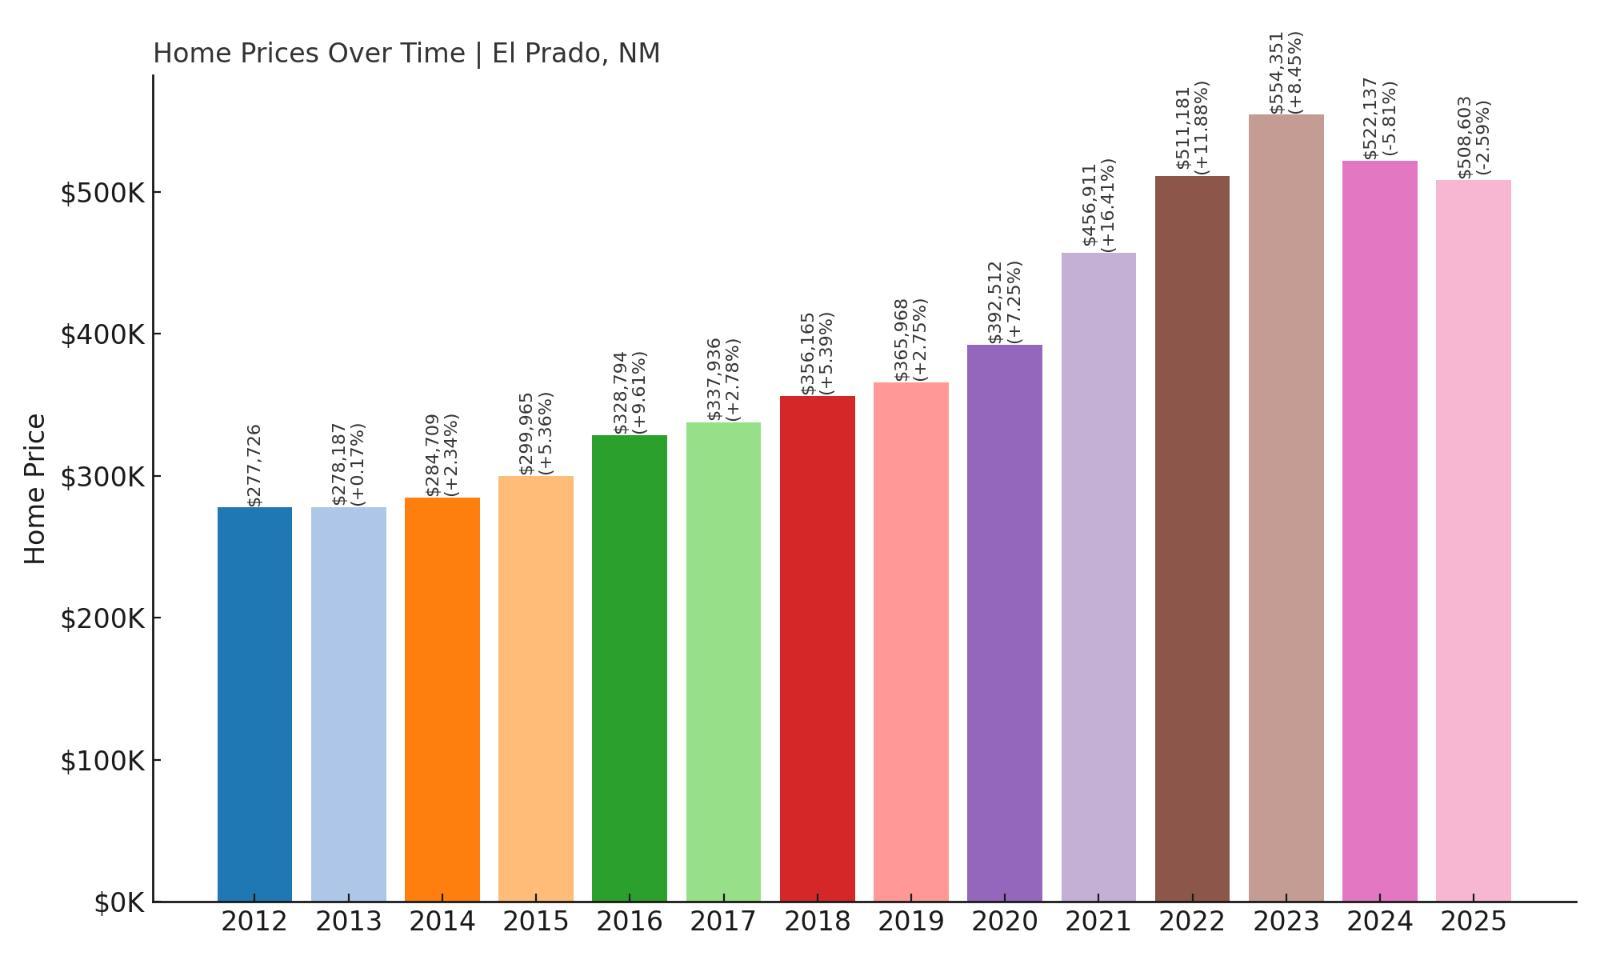
- 2010: N/A
- 2011: N/A
- 2012: $277,726
- 2013: $278,187 (+$461, +0.17% from previous year)
- 2014: $284,709 (+$6,523, +2.34% from previous year)
- 2015: $299,965 (+$15,256, +5.36% from previous year)
- 2016: $328,794 (+$28,829, +9.61% from previous year)
- 2017: $337,936 (+$9,142, +2.78% from previous year)
- 2018: $356,165 (+$18,229, +5.39% from previous year)
- 2019: $365,968 (+$9,803, +2.75% from previous year)
- 2020: $392,512 (+$26,544, +7.25% from previous year)
- 2021: $456,911 (+$64,399, +16.41% from previous year)
- 2022: $511,181 (+$54,270, +11.88% from previous year)
- 2023: $554,351 (+$43,170, +8.45% from previous year)
- 2024: $522,137 (-$32,213, -5.81% from previous year)
- 2025: $508,603 (-$13,534, -2.59% from previous year)
El Prado’s median home values have surged 83% since 2012, peaking in 2023 before slightly declining over the next two years. Even with a dip to $508,603 in 2025, prices remain high, reflecting the area’s persistent popularity with both full-time residents and second-home owners. The area’s scenic surroundings and close proximity to Taos make it an attractive choice for buyers who value both serenity and access to amenities.
El Prado – Taos Proximity Meets Rural Charm
Located just northwest of Taos, El Prado is an unincorporated community known for its wide-open views of the Sangre de Cristo Mountains, its artistic culture, and its close-knit feel. It’s the kind of place where you can see horses grazing in the distance while still being just a 10-minute drive from the galleries and restaurants of Taos Plaza. The real estate here includes a mix of adobe homes, off-grid properties, and luxury builds with sweeping views—making it a uniquely diverse housing market. Growth here has followed a pattern of steady increases, particularly in the years when Taos itself became too expensive or crowded for new buyers.
The recent price softening may reflect a broader trend of market correction across the state, but demand in El Prado is unlikely to vanish. With strong interest from out-of-state buyers and retirees, the area continues to appeal to those seeking a blend of creative energy, natural beauty, and small-community living. Additionally, the high rate of home appreciation in the 2020–2022 window—fueled by remote work and a desire for open space—left a lasting impact on the local market. Even after a modest decline, El Prado remains one of the most premium residential locations in Taos County.
11. Angel Fire – 102% Home Price Increase Since 2012
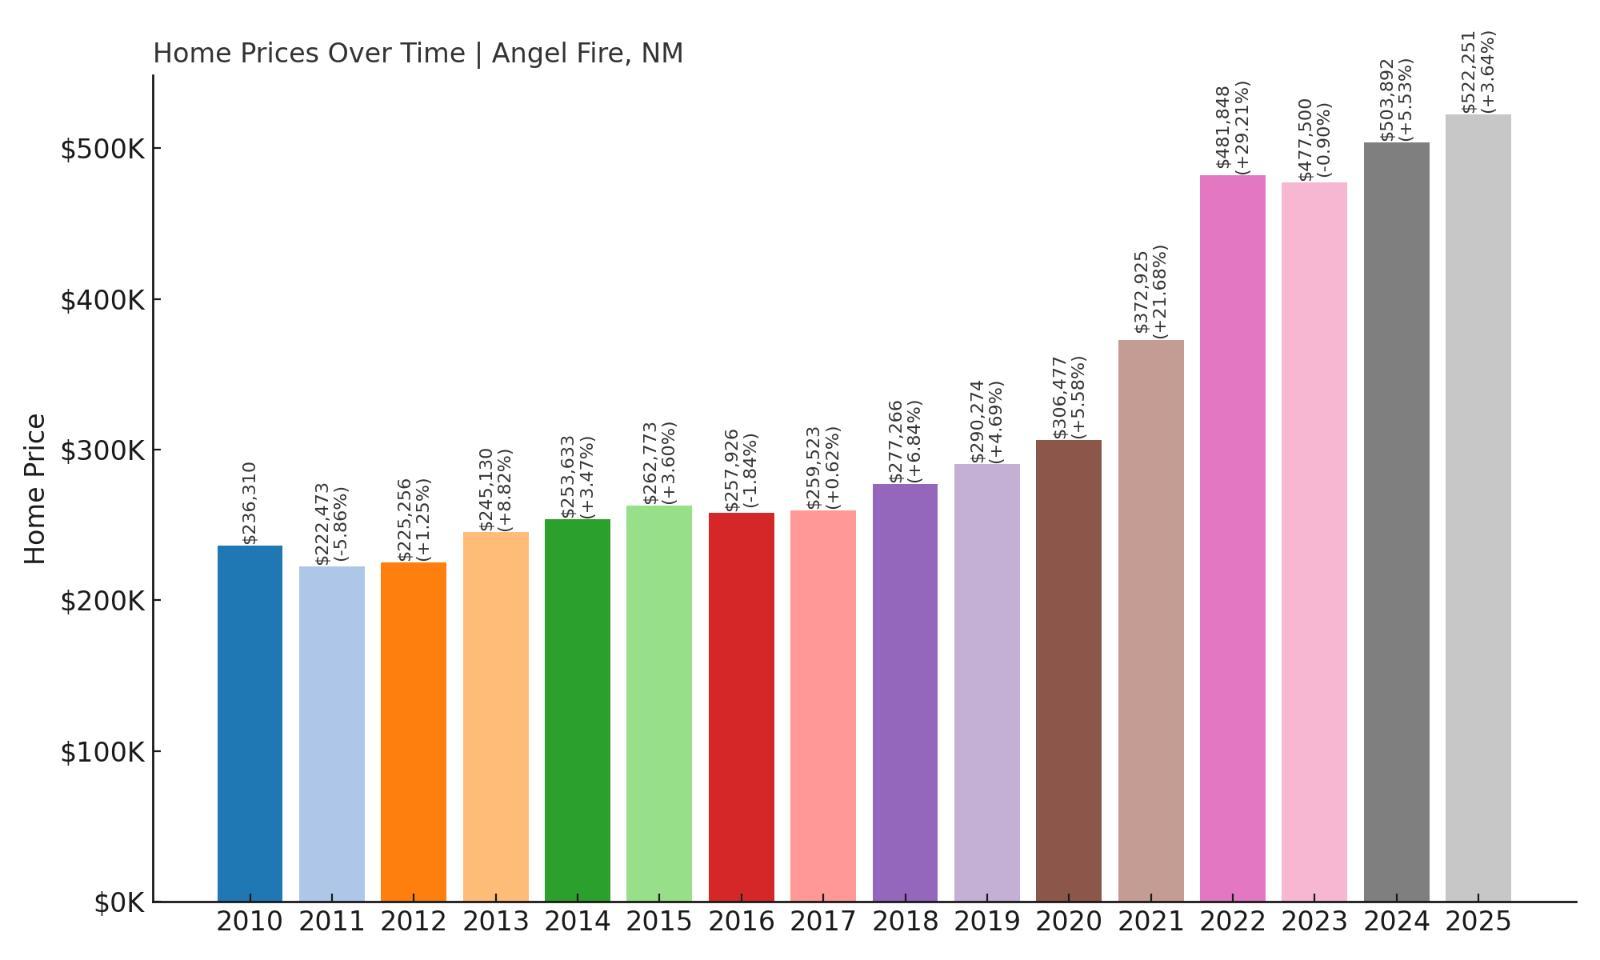
- 2010: $236,310
- 2011: $222,473 (-$13,837, -5.86% from previous year)
- 2012: $225,256 (+$2,783, +1.25% from previous year)
- 2013: $245,130 (+$19,875, +8.82% from previous year)
- 2014: $253,633 (+$8,502, +3.47% from previous year)
- 2015: $262,773 (+$9,140, +3.60% from previous year)
- 2016: $257,926 (-$4,847, -1.84% from previous year)
- 2017: $259,523 (+$1,597, +0.62% from previous year)
- 2018: $277,266 (+$17,743, +6.84% from previous year)
- 2019: $290,274 (+$13,008, +4.69% from previous year)
- 2020: $306,477 (+$16,204, +5.58% from previous year)
- 2021: $372,925 (+$66,448, +21.68% from previous year)
- 2022: $481,848 (+$108,923, +29.21% from previous year)
- 2023: $477,500 (-$4,348, -0.90% from previous year)
- 2024: $503,892 (+$26,393, +5.53% from previous year)
- 2025: $522,251 (+$18,358, +3.64% from previous year)
Since 2012, Angel Fire’s home prices have more than doubled, climbing from $225,256 to $522,251 in 2025—a dramatic 102% increase. While the town saw a slight dip in 2023, that was quickly offset by two consecutive years of recovery. The real estate market here continues to be influenced by its dual identity as both a resort destination and a residential mountain community.
Angel Fire – Year-Round Resort Driving Price Climb
Angel Fire is best known for its ski resort, but the appeal goes well beyond winter sports. The town has become a four-season destination with activities ranging from mountain biking and ziplining in the summer to snowboarding and skiing in winter. This consistent tourist draw has helped establish a reliable base of interest among second-home buyers, vacation rental investors, and families looking for cabin-style escapes from urban life. That broad demand helps explain the rapid price increase, especially during the pandemic era when remote work made mountain towns far more attractive.
With limited buildable land and a high percentage of seasonal properties, Angel Fire’s market tends to be tight, which drives prices up quickly when demand surges. The burst in prices from 2021 to 2022 saw an eye-popping 29% annual increase, suggesting heightened competition and investor activity. While growth has slowed slightly in recent years, it remains positive—underscoring that Angel Fire’s housing market isn’t just a trend, but a strong niche anchored by tourism and long-term interest in mountain living. As more buyers prioritize lifestyle and access to nature, this resort town is likely to remain in high demand.
10. Sandia Park – 91% Home Price Increase Since 2012
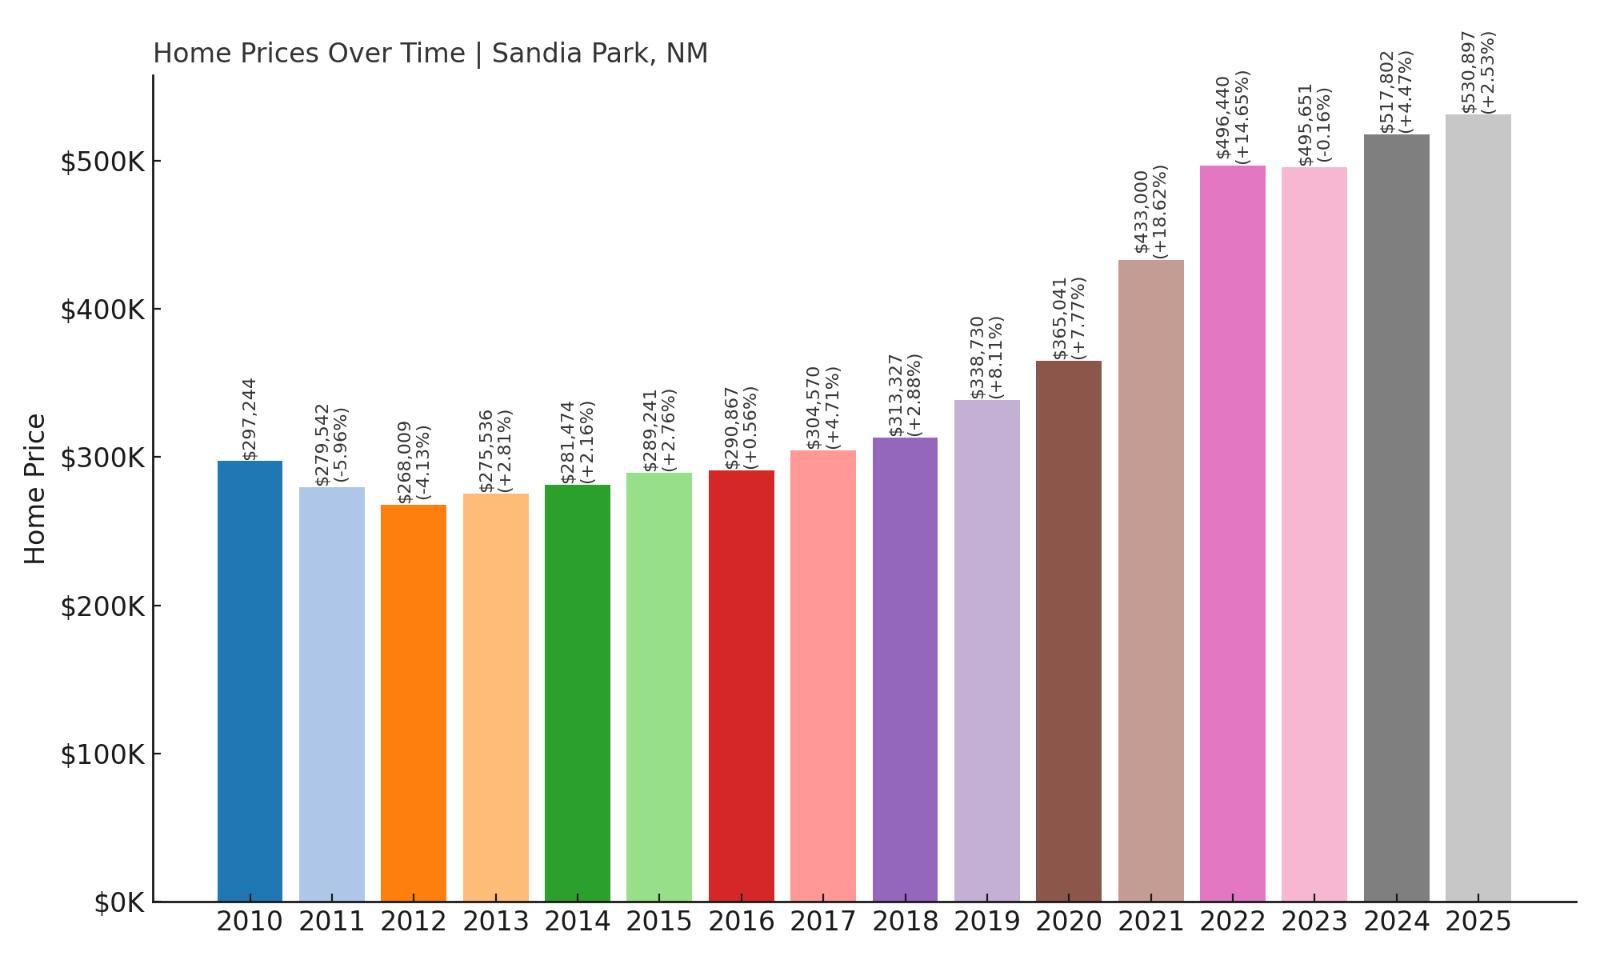
- 2010: $297,244
- 2011: $279,542 (-$17,702, -5.96% from previous year)
- 2012: $268,009 (-$11,533, -4.13% from previous year)
- 2013: $275,536 (+$7,526, +2.81% from previous year)
- 2014: $281,474 (+$5,938, +2.16% from previous year)
- 2015: $289,241 (+$7,767, +2.76% from previous year)
- 2016: $290,867 (+$1,626, +0.56% from previous year)
- 2017: $304,570 (+$13,704, +4.71% from previous year)
- 2018: $313,327 (+$8,757, +2.88% from previous year)
- 2019: $338,730 (+$25,403, +8.11% from previous year)
- 2020: $365,041 (+$26,311, +7.77% from previous year)
- 2021: $433,000 (+$67,959, +18.62% from previous year)
- 2022: $496,440 (+$63,440, +14.65% from previous year)
- 2023: $495,651 (-$789, -0.16% from previous year)
- 2024: $517,802 (+$22,151, +4.47% from previous year)
- 2025: $530,897 (+$13,095, +2.53% from previous year)
Sandia Park home prices have increased by 91% since 2012, with values now sitting at $530,897 in 2025. The market here has been shaped by consistent mid-decade growth and significant acceleration in the early 2020s. A brief pause in 2023 did little to derail the upward momentum, as prices rebounded in 2024 and continued climbing in 2025. This trend points to ongoing demand for this secluded yet accessible mountain region.
Sandia Park – Private Living in the Mountains Near the City
Sandia Park lies along the eastern slopes of the Sandia Mountains, offering elevated living—both literally and figuratively. Residents are drawn to the area’s dense pine forests, winding mountain roads, and quiet subdivisions that feel far removed from city life, even though Albuquerque is only about 30 minutes away. Homes here are often custom-built and spaced apart on large, wooded lots, appealing to those who want tranquility, starry skies, and access to some of New Mexico’s best hiking and biking trails. The neighborhood’s proximity to the Sandia Crest Scenic Byway and the popular Tinkertown Museum adds to its allure, especially for families and artists looking for inspiration in nature.
What sets Sandia Park apart from other mountain communities is the level of privacy and space it offers without sacrificing access to modern conveniences. Reliable utilities, fiber internet expansion, and a growing interest in rural luxury have all helped drive home prices up steadily. Buyers here tend to be serious long-term residents or high-end remote workers, rather than short-term investors, which helps keep market dynamics relatively stable. The strong growth from 2020 to 2022—highlighted by a nearly 19% leap in a single year—demonstrates the town’s resilience and rising status as one of New Mexico’s most desirable high-altitude residential markets. As more buyers seek to balance serenity and connectivity, Sandia Park continues to deliver.
9. Alto – 72% Home Price Increase Since 2012
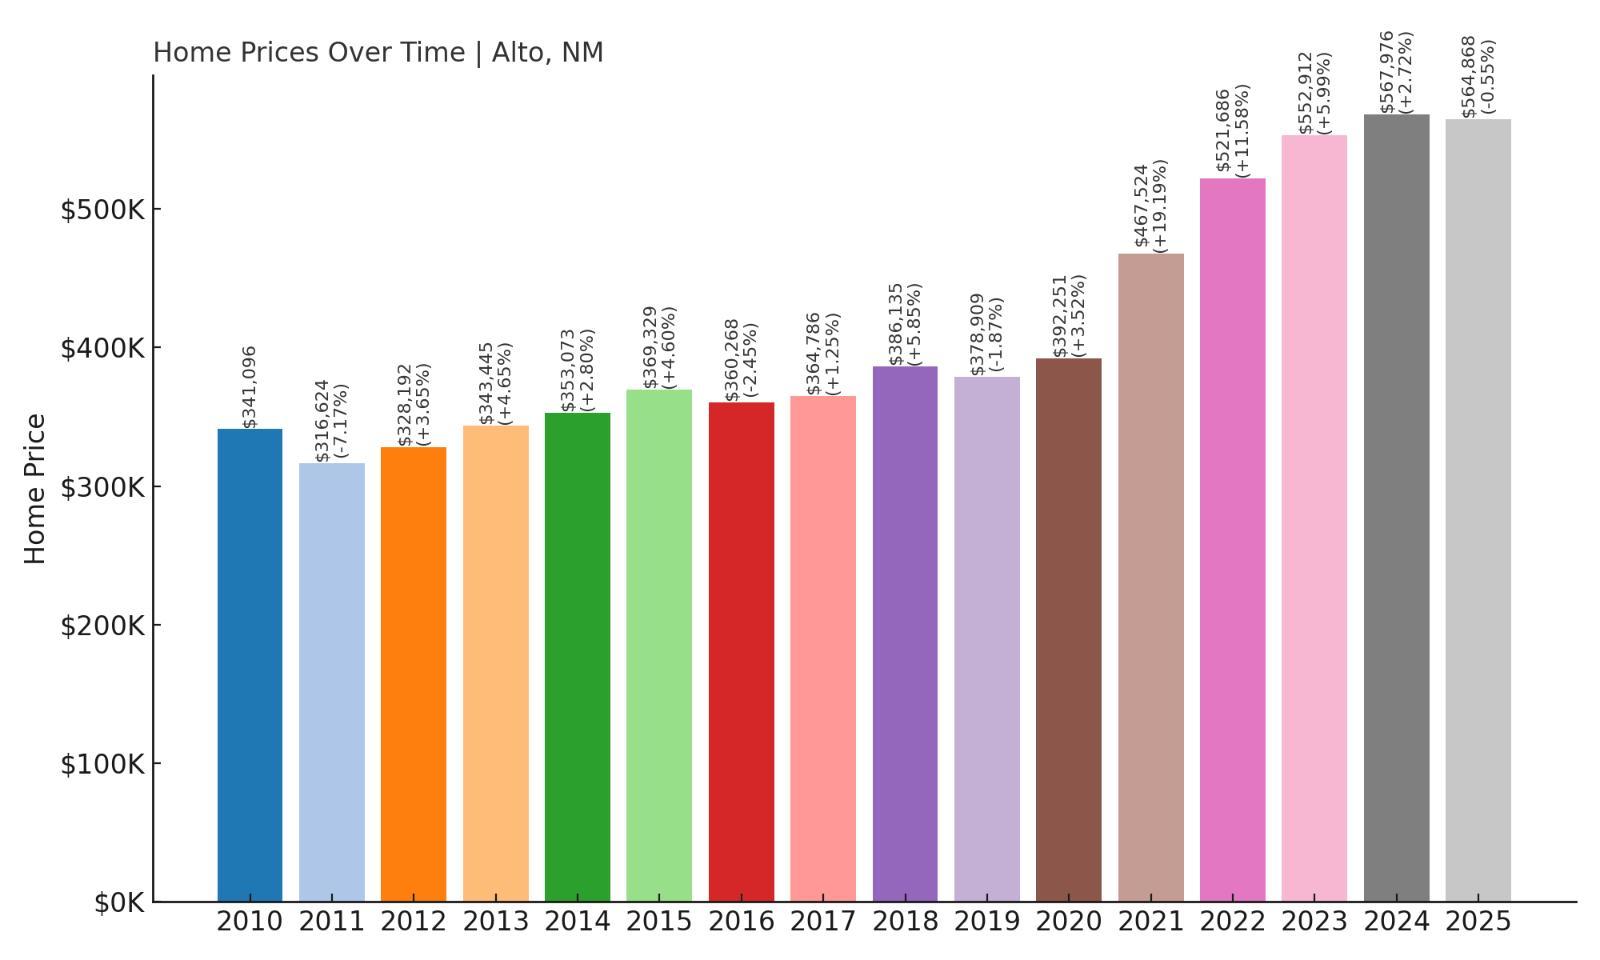
- 2010: $341,096
- 2011: $316,624 (-$24,473, -7.17% from previous year)
- 2012: $328,192 (+$11,568, +3.65% from previous year)
- 2013: $343,445 (+$15,253, +4.65% from previous year)
- 2014: $353,073 (+$9,628, +2.80% from previous year)
- 2015: $369,329 (+$16,256, +4.60% from previous year)
- 2016: $360,268 (-$9,062, -2.45% from previous year)
- 2017: $364,786 (+$4,518, +1.25% from previous year)
- 2018: $386,135 (+$21,349, +5.85% from previous year)
- 2019: $378,909 (-$7,226, -1.87% from previous year)
- 2020: $392,251 (+$13,342, +3.52% from previous year)
- 2021: $467,524 (+$75,273, +19.19% from previous year)
- 2022: $521,686 (+$54,162, +11.58% from previous year)
- 2023: $552,912 (+$31,226, +5.99% from previous year)
- 2024: $567,976 (+$15,064, +2.72% from previous year)
- 2025: $564,868 (-$3,108, -0.55% from previous year)
Alto’s home values have climbed 72% since 2012, reaching $564,868 in 2025. After a massive gain in 2021, the pace of growth slowed, but prices continued to edge upward through 2024 before showing a minor dip in 2025. Even so, the overall trend remains strong, with Alto holding its place among New Mexico’s most expensive housing markets.
Alto – Golf, Forest, and the Quiet Edge of Ruidoso
Alto sits just north of the resort town of Ruidoso and is known for its elevated terrain, quiet roads, and the famed Alto Lakes Golf & Country Club. This private, gated community serves as a major draw for affluent homebuyers seeking high-altitude luxury, privacy, and recreation. The area offers easy access to the Lincoln National Forest, skiing at Ski Apache, and the entertainment and shopping options in nearby Ruidoso. Most homes in Alto are large, often custom-built properties that cater to buyers looking for full-time residence or premium vacation homes. The scenic drives, cooler summer temperatures, and abundant wildlife give the area a sense of calm that’s hard to find elsewhere.
Alto’s real estate market is influenced by both local demand and out-of-state buyers, particularly those from Texas and Arizona who are drawn to the area’s natural beauty and relative affordability compared to similar mountain towns in Colorado. Price trends over the last decade show a pattern of stable growth, punctuated by a significant jump during the pandemic era when lifestyle-focused buying spiked. The 19% increase in 2021 is one of the largest single-year leaps among New Mexico towns, underscoring Alto’s appeal during a period of shifting buyer preferences. Although 2025 saw a slight price drop, Alto remains firmly in the top tier of the state’s housing markets and is likely to continue attracting buyers looking for luxury in a laid-back setting.
8. Taos Ski Valley – 4% Home Price Increase

Since 2024
- 2010: N/A
- 2011: N/A
- 2012: N/A
- 2013: N/A
- 2014: N/A
- 2015: N/A
- 2016: N/A
- 2017: N/A
- 2018: N/A
- 2019: N/A
- 2020: N/A
- 2021: N/A
- 2022: N/A
- 2023: N/A
- 2024: $540,956
- 2025: $565,125 (+$24,169, +4.47% from previous year)
Taos Ski Valley recorded a modest 4.47% rise in home values from 2024 to 2025, reaching an average price of $565,125. Although public data is limited to the past two years, this small mountain resort village has long been a premium destination for wealthy buyers and serious outdoor enthusiasts. Its presence this high on the list confirms that luxury alpine real estate in New Mexico commands a steep price tag, even without a long public data trail.
Taos Ski Valley – High Altitude, High Prices, and Limited Inventory
At over 9,000 feet in elevation, Taos Ski Valley is one of the highest-elevation municipalities in the U.S. and certainly one of the most exclusive in New Mexico. This remote resort town is built into the Sangre de Cristo Mountains and is home to world-class skiing, rugged terrain, and a tightly controlled development footprint. Property here is limited in supply and often passes between private hands with minimal listing time. The housing inventory mostly consists of high-end chalets, luxury condos, and custom-built alpine homes designed for year-round comfort in extreme weather. For buyers, it’s not just about square footage—it’s about access to pristine powder and unspoiled wilderness.
Prices in Taos Ski Valley reflect more than just shelter—they reflect lifestyle and status. With space at a premium and stringent building codes in place to preserve the area’s character, the real estate market remains competitive even in years when broader housing trends cool off. The slight but steady appreciation in 2025 signals sustained demand from affluent buyers seeking ski-in, ski-out convenience in a setting that rivals Colorado resorts in quality but offers a quieter, more exclusive feel. Taos Ski Valley is not for the casual home shopper—it’s for buyers who know exactly what they want and are willing to pay a premium to get it.
7. Santa Fe – 110% Home Price Increase Since 2012
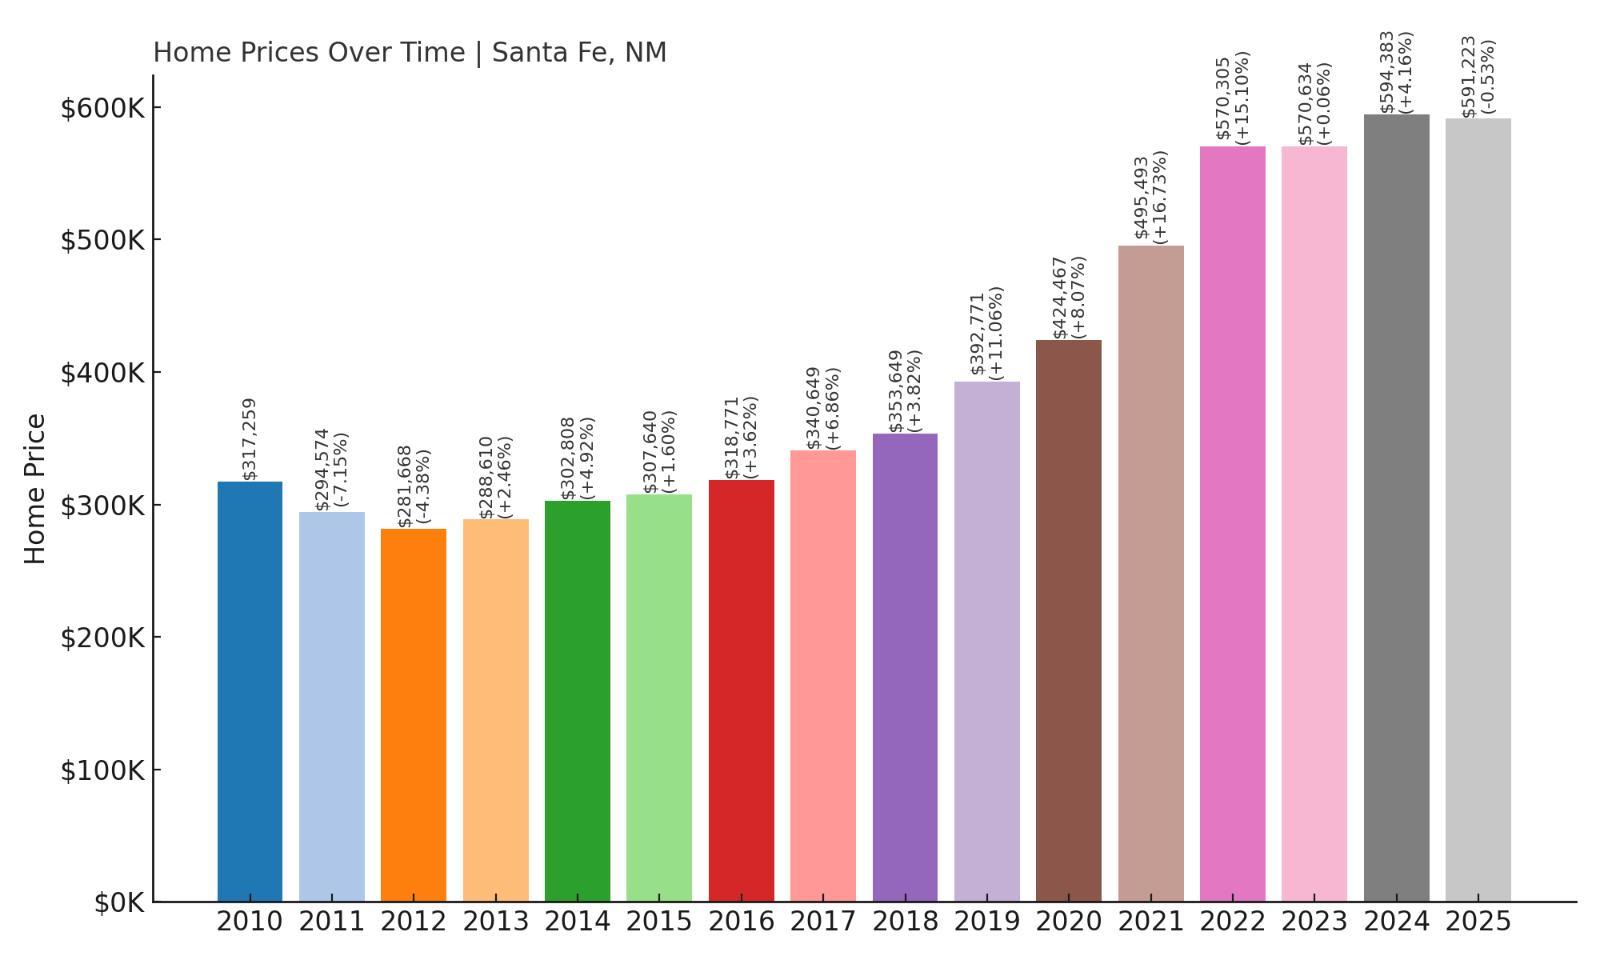
- 2010: $317,259
- 2011: $294,574 (-$22,685, -7.15% from previous year)
- 2012: $281,668 (-$12,905, -4.38% from previous year)
- 2013: $288,610 (+$6,942, +2.46% from previous year)
- 2014: $302,808 (+$14,198, +4.92% from previous year)
- 2015: $307,640 (+$4,832, +1.60% from previous year)
- 2016: $318,771 (+$11,131, +3.62% from previous year)
- 2017: $340,649 (+$21,878, +6.86% from previous year)
- 2018: $353,649 (+$13,000, +3.82% from previous year)
- 2019: $392,771 (+$39,122, +11.06% from previous year)
- 2020: $424,467 (+$31,696, +8.07% from previous year)
- 2021: $495,493 (+$71,027, +16.73% from previous year)
- 2022: $570,305 (+$74,812, +15.10% from previous year)
- 2023: $570,634 (+$329, +0.06% from previous year)
- 2024: $594,383 (+$23,749, +4.16% from previous year)
- 2025: $591,223 (-$3,160, -0.53% from previous year)
Home values in Santa Fe have more than doubled since 2012, rising from $281,668 to $591,223—an increase of 110%. Most of this growth occurred steadily over the decade, with rapid acceleration in the early 2020s. Despite a minor dip in 2025, the capital city continues to be one of the most sought-after and highest-priced housing markets in New Mexico.
Santa Fe – Historic Capital With a Red-Hot Real Estate Market
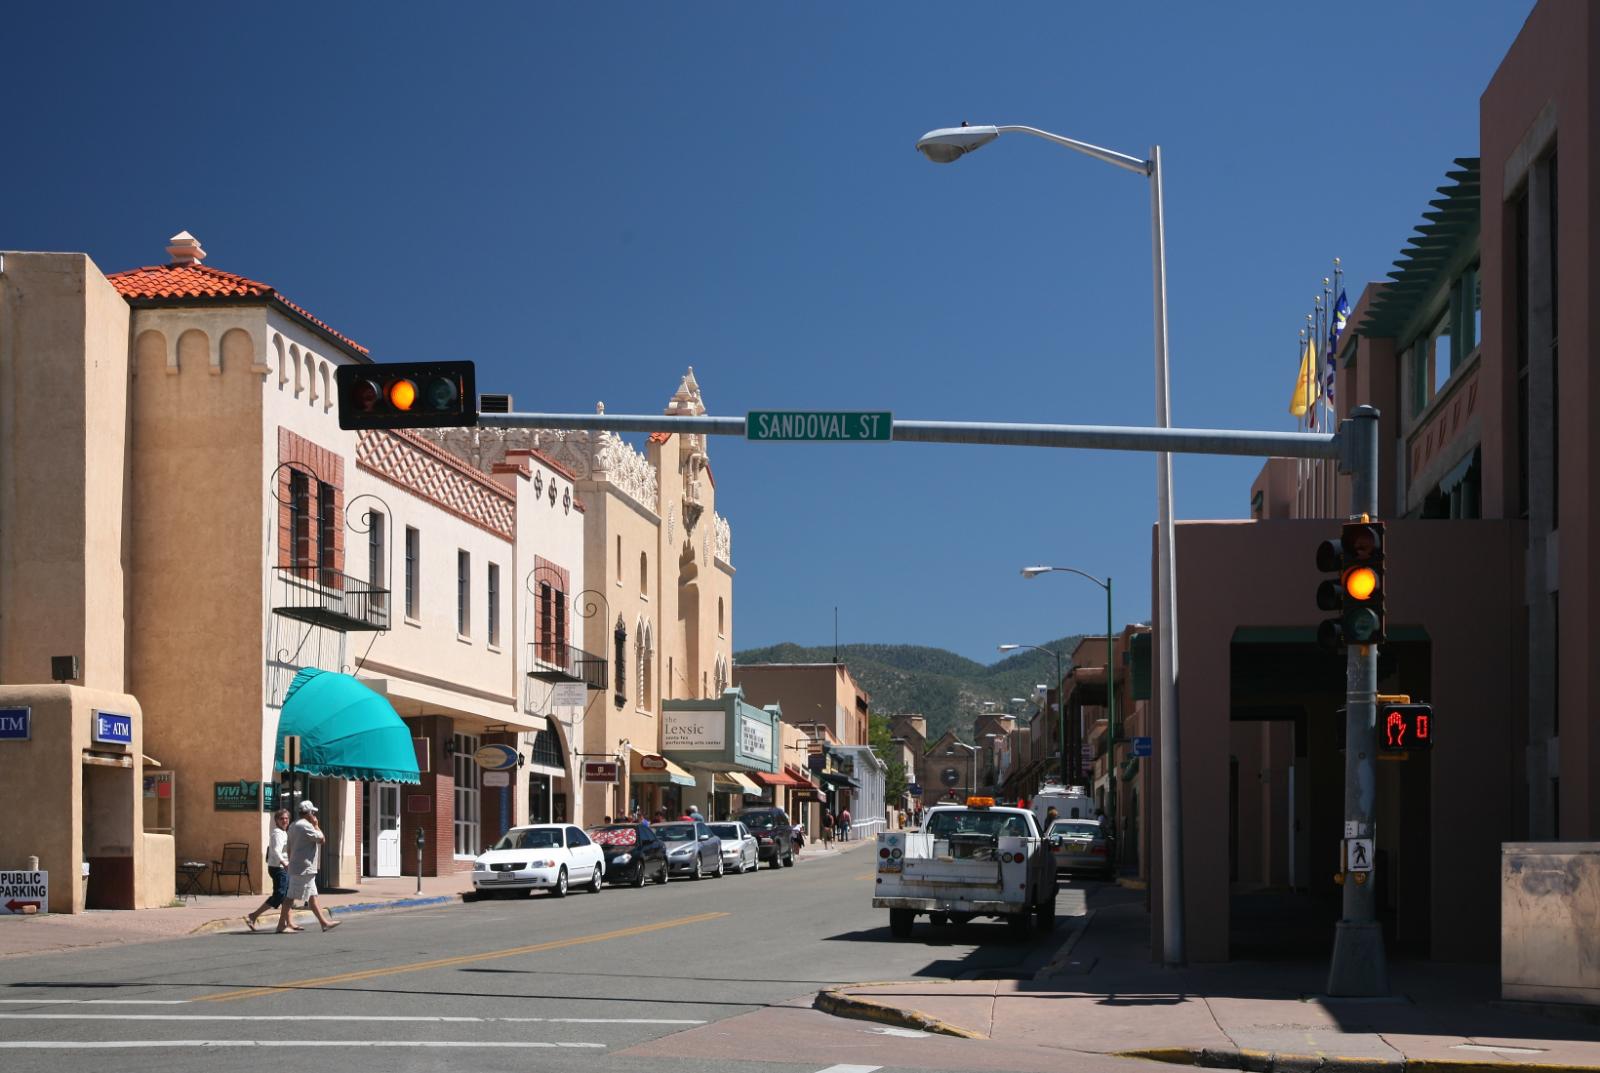
Santa Fe is unlike any other city in the state—or the country. Known for its centuries-old adobe architecture, vibrant arts scene, and high-desert setting, Santa Fe is a magnet for culture seekers, retirees, and high-income professionals alike. The city’s UNESCO-recognized heritage, strong tourism sector, and high-end amenities give it a cosmopolitan feel with a distinctly Southwestern flair. From Canyon Road’s galleries to the Georgia O’Keeffe Museum, Santa Fe has built a reputation as a place where creativity and history intersect, and that cultural cachet translates directly into real estate demand.
Santa Fe’s housing market benefits from both local interest and a large share of out-of-state buyers, particularly from California, Colorado, and the East Coast. During the pandemic, remote workers and early retirees flooded the market, driving a 16% price spike in 2021 alone. That momentum carried into 2022 and 2023, making Santa Fe one of the most competitive markets in the Southwest. The modest price correction in 2025 doesn’t diminish its long-term trajectory—inventory remains tight, and zoning restrictions around the historic district limit new construction. As long as Santa Fe continues to combine natural beauty, cultural depth, and livability, its real estate market is expected to remain strong.
6. Los Alamos – 125% Home Price Increase Since 2012
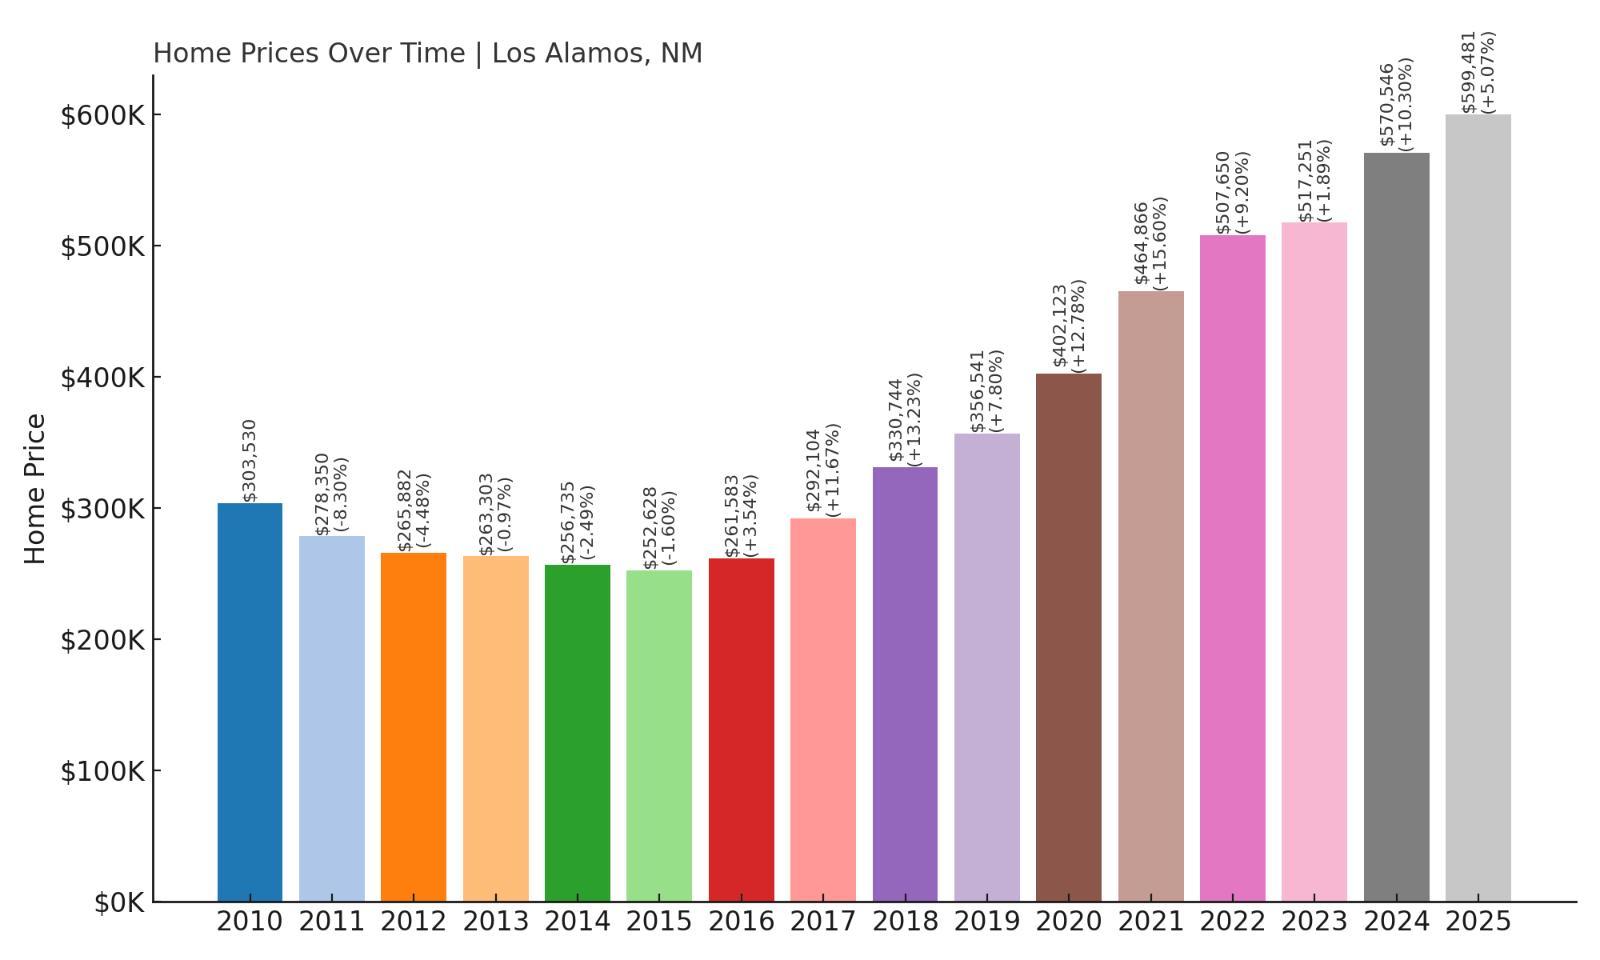
- 2010: $303,530
- 2011: $278,350 (-$25,180, -8.30% from previous year)
- 2012: $265,882 (-$12,468, -4.48% from previous year)
- 2013: $263,303 (-$2,578, -0.97% from previous year)
- 2014: $256,735 (-$6,568, -2.49% from previous year)
- 2015: $252,628 (-$4,107, -1.60% from previous year)
- 2016: $261,583 (+$8,955, +3.54% from previous year)
- 2017: $292,104 (+$30,521, +11.67% from previous year)
- 2018: $330,744 (+$38,640, +13.23% from previous year)
- 2019: $356,541 (+$25,797, +7.80% from previous year)
- 2020: $402,123 (+$45,582, +12.78% from previous year)
- 2021: $464,866 (+$62,743, +15.60% from previous year)
- 2022: $507,650 (+$42,783, +9.20% from previous year)
- 2023: $517,251 (+$9,601, +1.89% from previous year)
- 2024: $570,546 (+$53,295, +10.30% from previous year)
- 2025: $599,481 (+$28,935, +5.07% from previous year)
Los Alamos has seen a staggering 125% increase in home prices since 2012, rising from $265,882 to $599,481 in 2025. Home values here have climbed steadily for more than a decade, with especially sharp increases between 2017 and 2022. Even with some moderation in recent years, the town remains one of the most expensive markets in New Mexico.
Los Alamos – Innovation, Education, and Expensive Homes
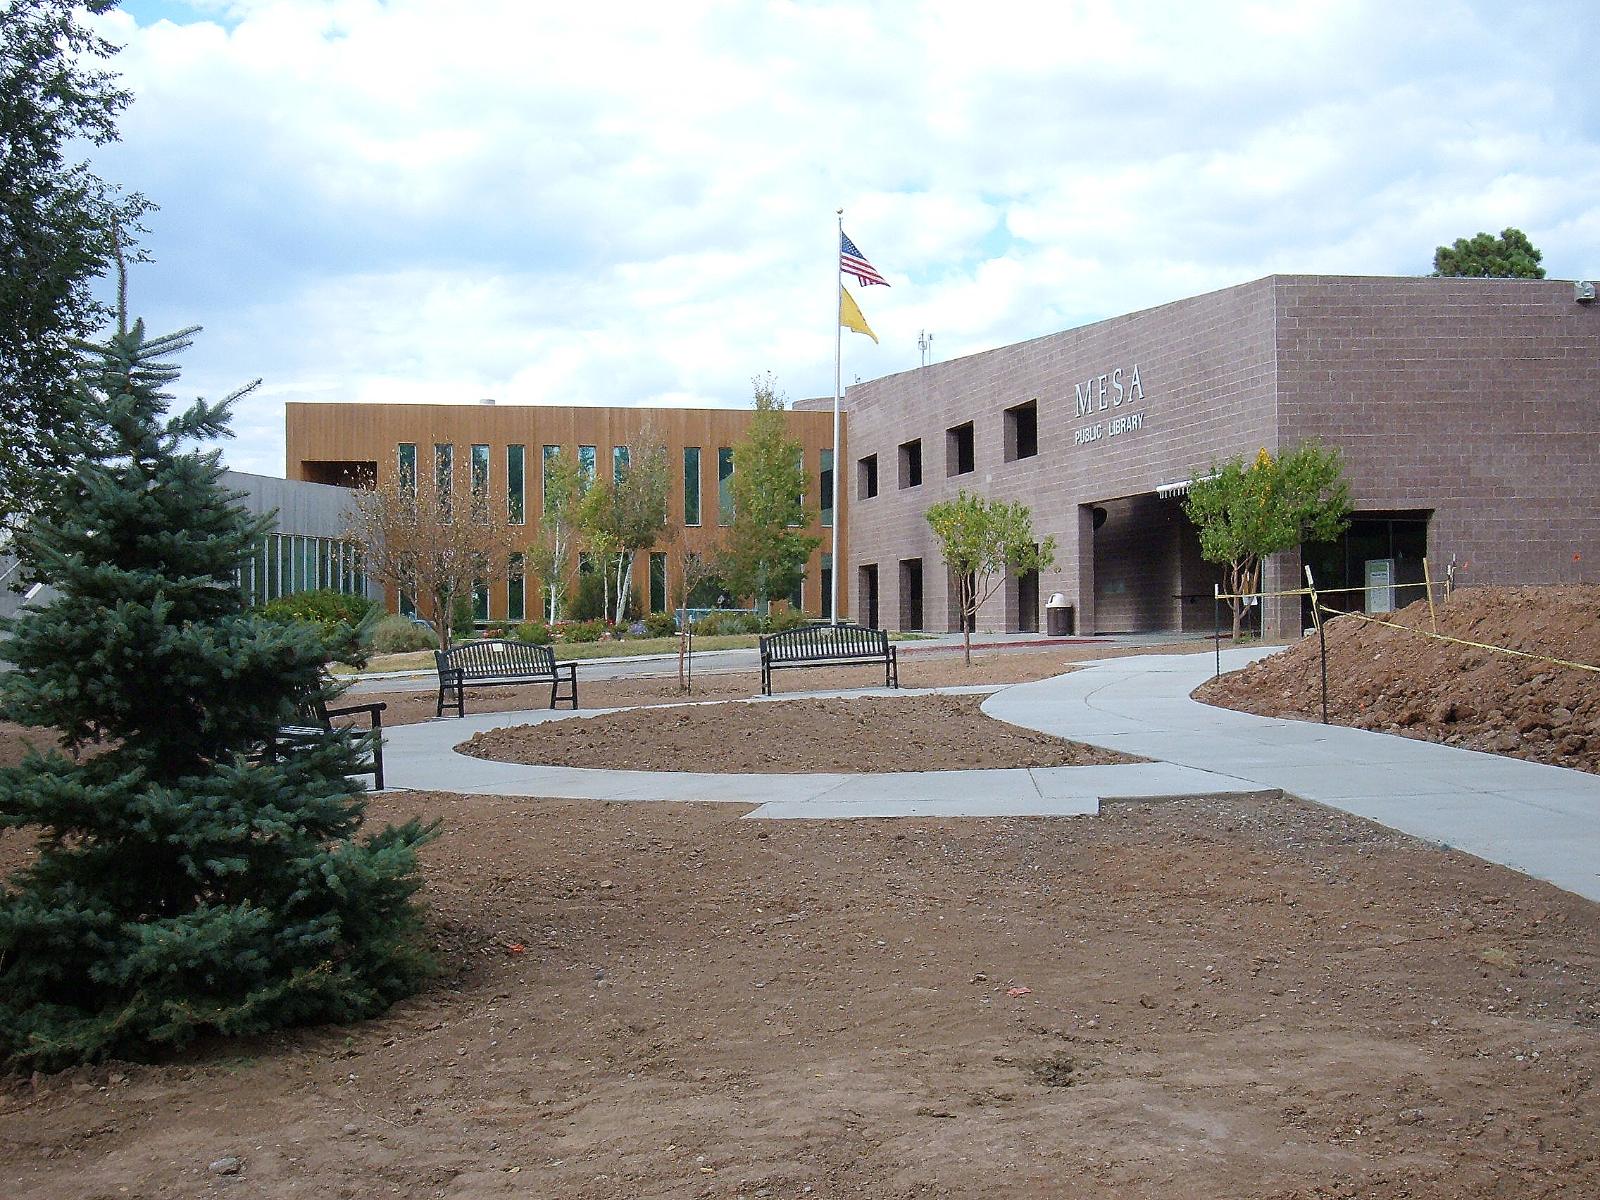
Home to the renowned Los Alamos National Laboratory, this town is synonymous with scientific excellence and high-paying jobs. As one of the best-educated cities in the country, Los Alamos boasts a unique population of engineers, researchers, and scientists who support a strong local economy. The town offers highly rated public schools, low crime, and an abundance of open space, which appeals to families and professionals alike. Demand for housing here is deeply tied to the lab, and the consistent flow of well-compensated workers keeps home prices high.
Despite its small size, Los Alamos has a disproportionately competitive housing market. Limited land, mountainous terrain, and cautious planning policies constrain supply, which contributes to high property values. During the pandemic, the town saw a huge spike in demand as remote-friendly professionals flocked to locations with economic stability and quality of life. Even now, with prices topping $599K, inventory remains tight, and homes are often snapped up quickly. The growth pattern here is both data-driven and demand-based—proof that in New Mexico, strong local economies can push small towns into big-league pricing territory.
5. Arroyo Seco – 2.5% Home Price Increase Since 2024
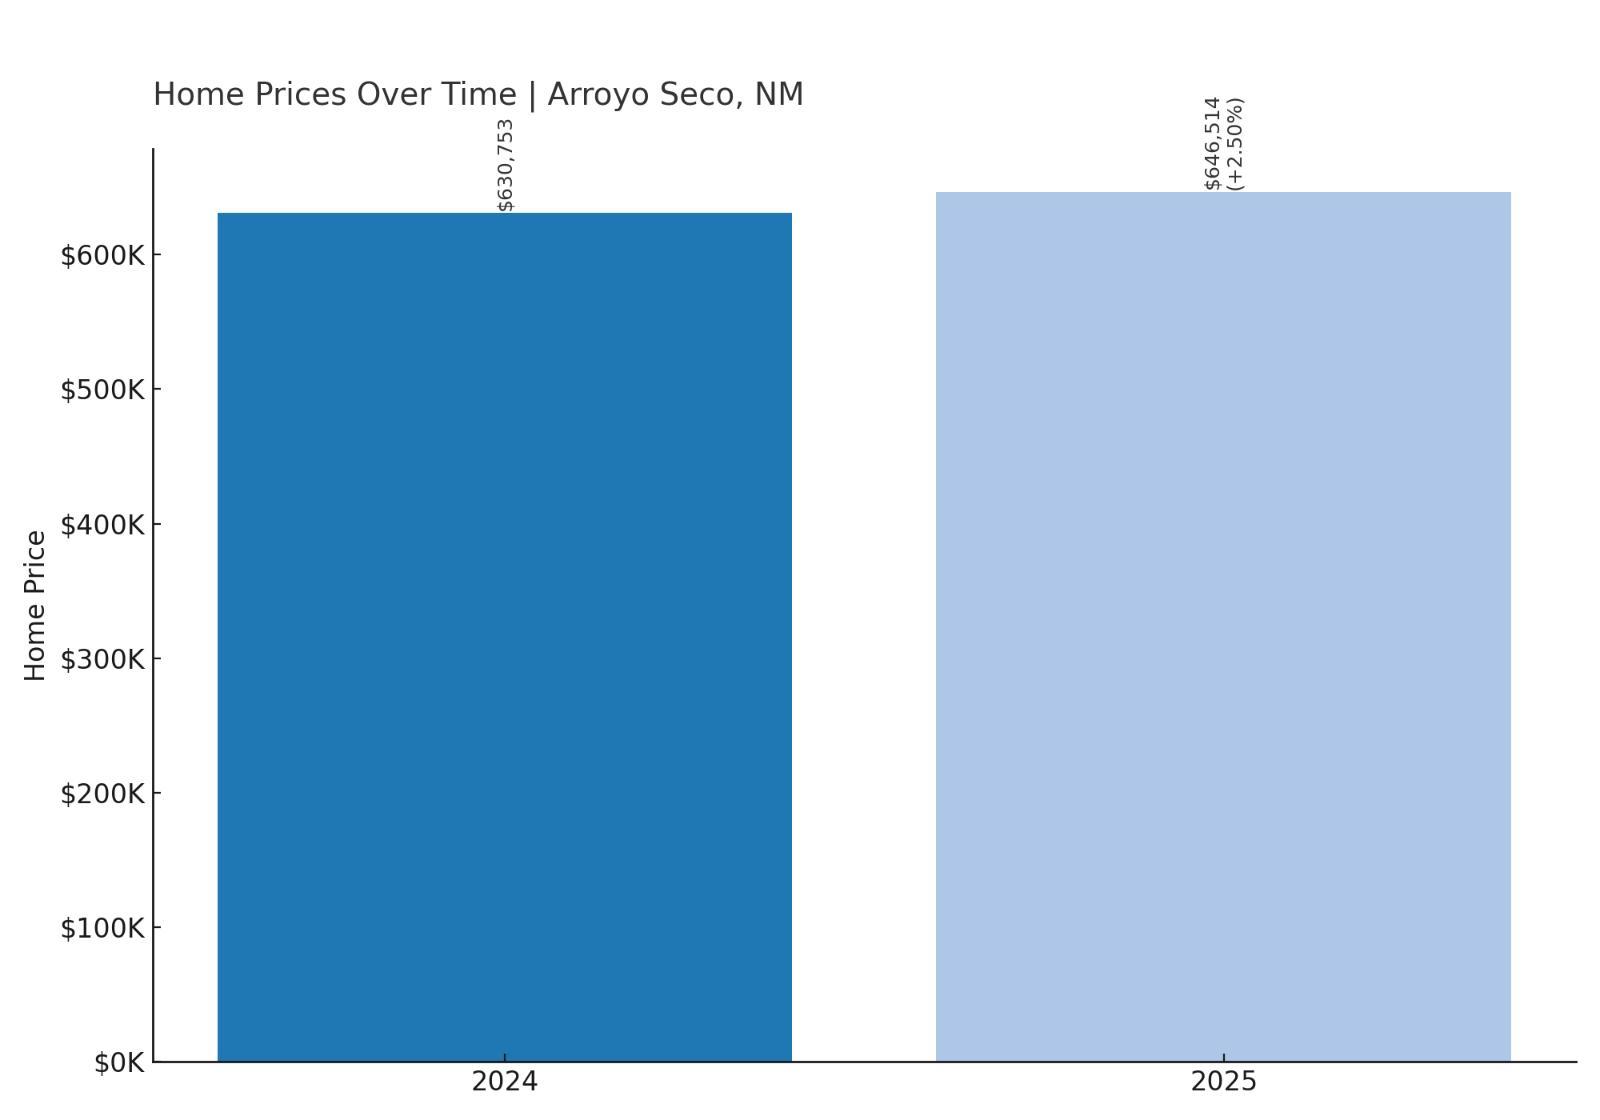
- 2010: N/A
- 2011: N/A
- 2012: N/A
- 2013: N/A
- 2014: N/A
- 2015: N/A
- 2016: N/A
- 2017: N/A
- 2018: N/A
- 2019: N/A
- 2020: N/A
- 2021: N/A
- 2022: N/A
- 2023: N/A
- 2024: $630,753
- 2025: $646,514 (+$15,761, +2.50% from previous year)
Arroyo Seco posted a 2.5% gain in average home prices between 2024 and 2025, climbing to $646,514. Though data is limited, this northern New Mexico village consistently ranks among the state’s most expensive locales. Its allure comes from its close proximity to Taos, breathtaking scenery, and status as a peaceful enclave for artists, vacationers, and high-net-worth homeowners. Even without long-term public price history, its placement near the top of the list is no surprise to anyone familiar with the region.
Arroyo Seco – Scenic Seclusion Just Outside Taos
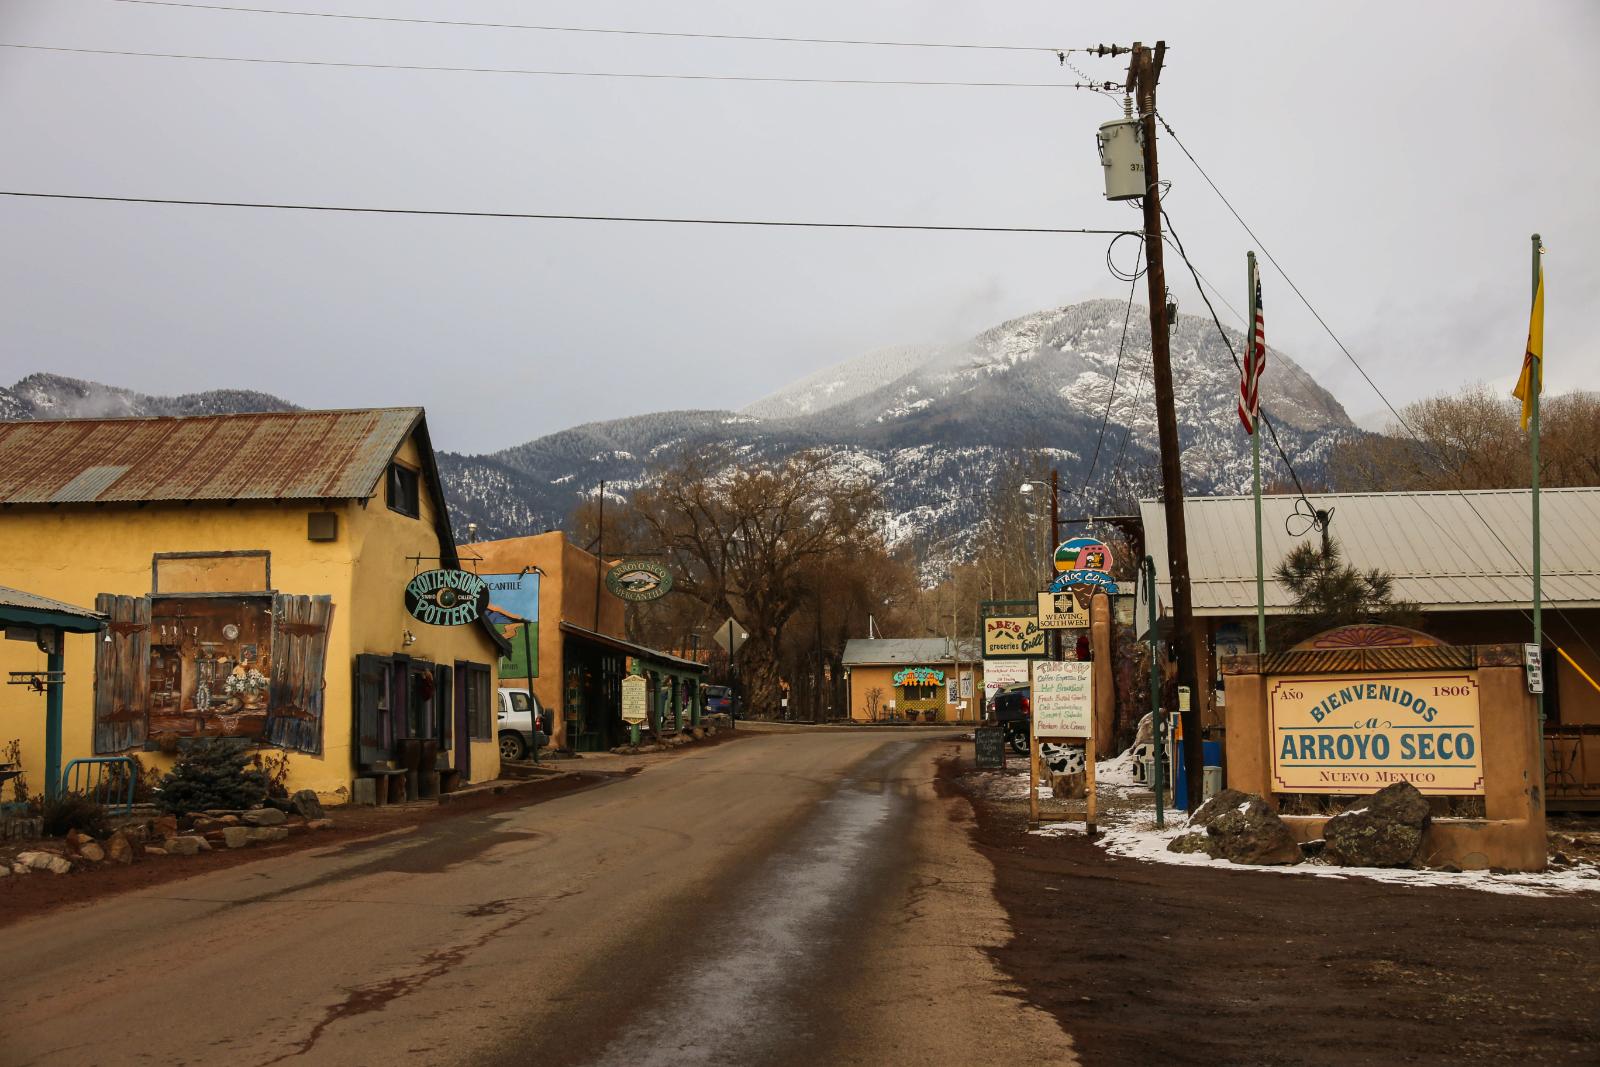
Arroyo Seco sits about halfway between the town of Taos and the Taos Ski Valley, nestled beneath the soaring peaks of the Sangre de Cristo Mountains. It’s a tiny, picturesque community known for its adobe architecture, organic markets, and stunning views. The area’s limited housing stock, paired with strict development controls, creates a naturally constrained real estate market. Many homes in Arroyo Seco are custom-built or restored historic properties, which only adds to their value. This isn’t a place where neighborhoods spring up overnight—buyers often wait years for a specific type of home or parcel to become available, leading to price resilience even when broader markets waver.
The village’s charm is rooted in its tranquility, cultural richness, and proximity to both town and mountain recreation. Residents enjoy easy access to hiking trails, art studios, gourmet cafes, and ski slopes—all within a 15-minute drive. It’s a favorite among buyers looking to escape urban density without giving up sophistication. Because of this, Arroyo Seco continues to draw interest from affluent transplants, seasonal visitors, and remote workers. The modest but meaningful price growth in 2025 suggests that demand remains healthy and steady, reinforcing the town’s status as one of New Mexico’s most desirable—and least replaceable—places to call home.
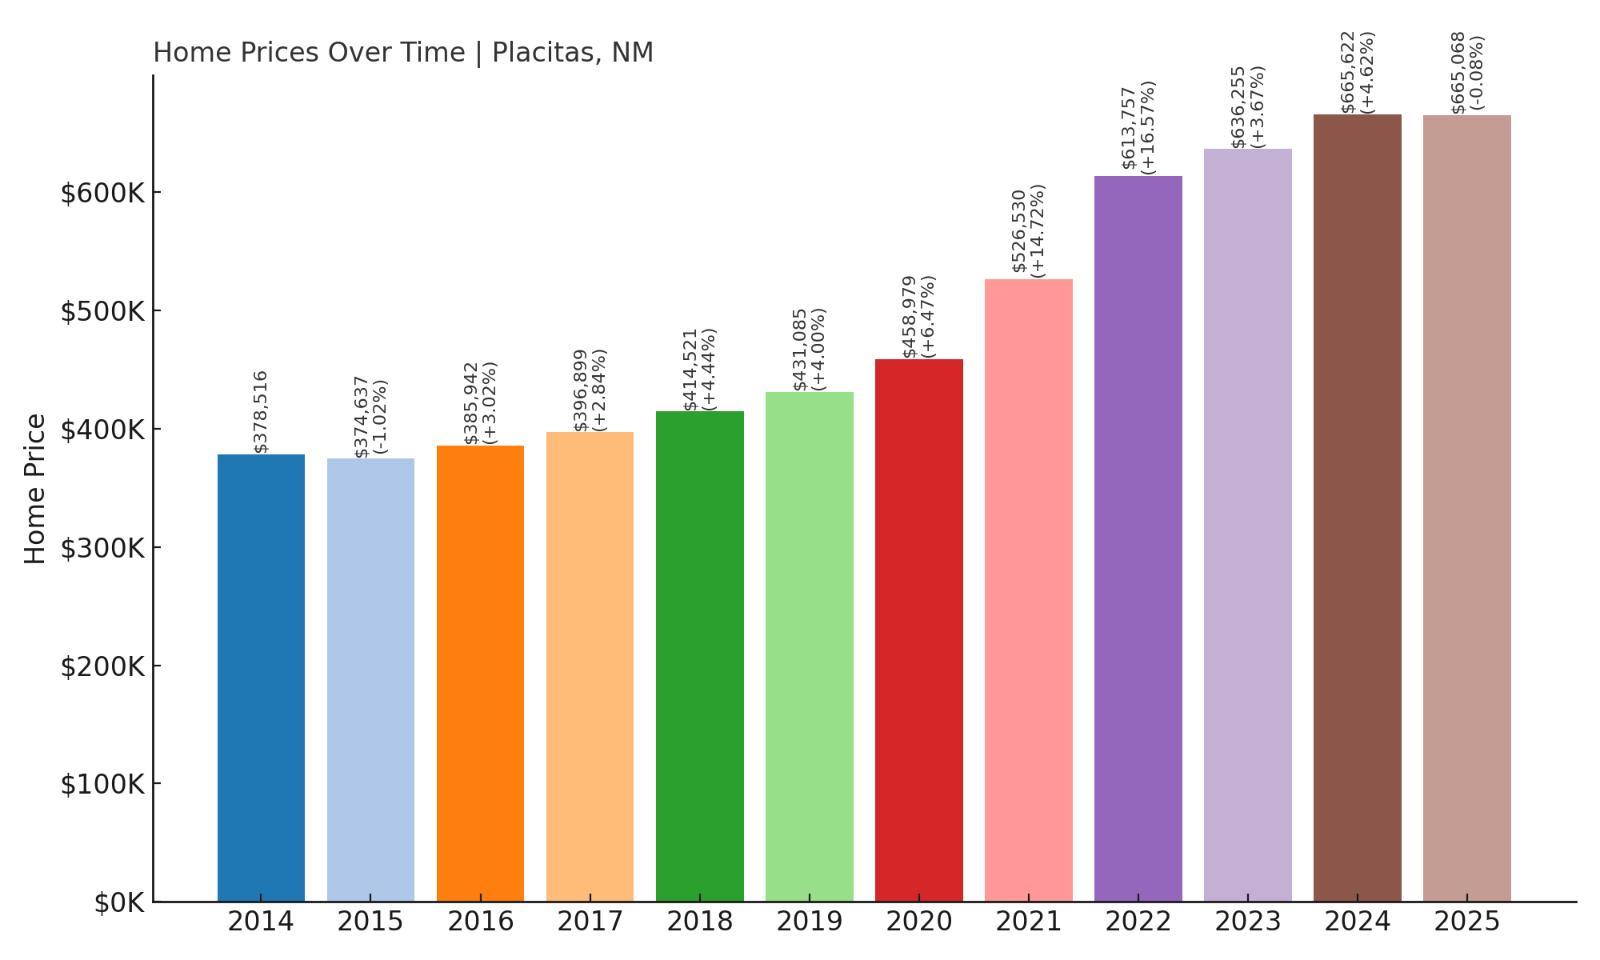
4. Placitas – 75% Home Price Increase Since 2014
- 2010: N/A
- 2011: N/A
- 2012: N/A
- 2013: N/A
- 2014: $378,516
- 2015: $374,637 (-$3,880, -1.02% from previous year)
- 2016: $385,942 (+$11,305, +3.02% from previous year)
- 2017: $396,899 (+$10,957, +2.84% from previous year)
- 2018: $414,521 (+$17,623, +4.44% from previous year)
- 2019: $431,085 (+$16,563, +4.00% from previous year)
- 2020: $458,979 (+$27,894, +6.47% from previous year)
- 2021: $526,530 (+$67,551, +14.72% from previous year)
- 2022: $613,757 (+$87,227, +16.57% from previous year)
- 2023: $636,255 (+$22,498, +3.67% from previous year)
- 2024: $665,622 (+$29,367, +4.62% from previous year)
- 2025: $665,068 (-$553, -0.08% from previous year)
Placitas home values have risen an impressive 75% since 2014, topping out at $665,068 in 2025. Though the market showed signs of plateauing this year—with a negligible decline of $553—the long-term trajectory remains steeply upward. Price growth has been particularly strong since 2020, as buyers increasingly looked to Placitas for luxury homes with dramatic desert backdrops and proximity to Albuquerque without the hustle.
Placitas – Upscale Desert Living With Big Views
Placitas sits just northeast of Albuquerque, tucked into the foothills of the Sandia Mountains. Known for its sweeping desert landscapes, dark night skies, and spacious custom homes, the community has become one of the premier places in New Mexico for upscale suburban living. Placitas offers a striking contrast to the city—homes here are typically built on large lots, often with passive solar design, adobe features, and floor-to-ceiling windows that showcase the rugged terrain and mountain vistas. The area has long attracted professionals, artists, and retirees seeking quiet, scenic surroundings with a short commute to metro amenities.
What makes Placitas stand out is its combination of seclusion and convenience. The community is about 25 minutes from Albuquerque and just 45 minutes from Santa Fe, placing it at a unique crossroads between urban access and rural serenity. Homebuyers here prioritize quality of life, and that’s reflected in the steady stream of new custom builds and sustainable designs that have defined Placitas over the past decade. The burst in pricing from 2020 to 2022—when values climbed nearly 30% in just two years—illustrates the sharp rise in demand. Even though prices dipped ever so slightly in 2025, Placitas remains one of the most coveted destinations for those seeking natural beauty and high-end living in New Mexico.
3. Los Ranchos de Albuquerque – 104% Home Price Increase Since 2012
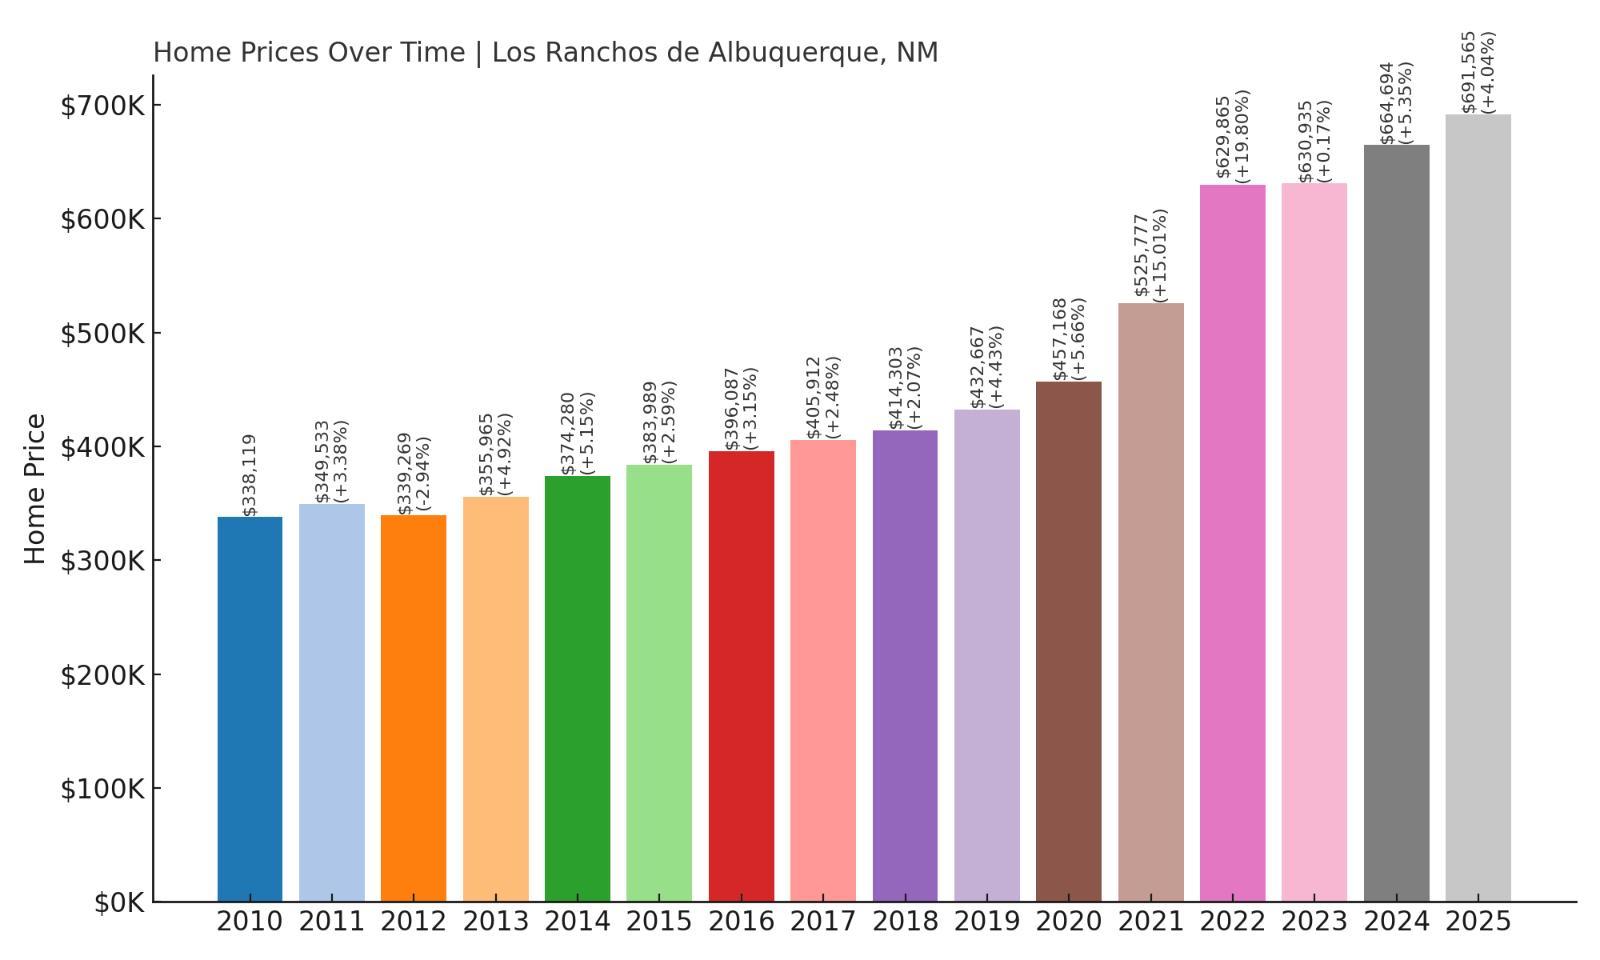
- 2010: $338,119
- 2011: $349,533 (+$11,414, +3.38% from previous year)
- 2012: $339,269 (-$10,265, -2.94% from previous year)
- 2013: $355,965 (+$16,697, +4.92% from previous year)
- 2014: $374,280 (+$18,315, +5.15% from previous year)
- 2015: $383,989 (+$9,709, +2.59% from previous year)
- 2016: $396,087 (+$12,098, +3.15% from previous year)
- 2017: $405,912 (+$9,825, +2.48% from previous year)
- 2018: $414,303 (+$8,390, +2.07% from previous year)
- 2019: $432,667 (+$18,364, +4.43% from previous year)
- 2020: $457,168 (+$24,501, +5.66% from previous year)
- 2021: $525,777 (+$68,609, +15.01% from previous year)
- 2022: $629,865 (+$104,088, +19.80% from previous year)
- 2023: $630,935 (+$1,070, +0.17% from previous year)
- 2024: $664,694 (+$33,759, +5.35% from previous year)
- 2025: $691,565 (+$26,871, +4.04% from previous year)
Los Ranchos de Albuquerque has seen a 104% increase in home values since 2012, with prices hitting $691,565 in 2025. The growth trajectory here has been gradual yet powerful, accelerated by major gains in 2021 and 2022. Unlike many other towns, Los Ranchos didn’t experience a significant drop after the boom years—instead, prices have continued climbing with only modest slowdowns.
Los Ranchos de Albuquerque – Luxury, Space, and River Valley Living
Los Ranchos de Albuquerque is an enclave of affluence tucked into the North Valley of Albuquerque. Known for its large estate homes, tree-lined roads, and proximity to the Rio Grande, it offers a rural feel with immediate access to city amenities. The community places a premium on privacy, with many properties hidden behind adobe walls or set far back on multi-acre lots. It’s also home to some of the area’s most coveted farmland and vineyards, giving it an agrarian charm that blends seamlessly with luxury living. For buyers seeking both tranquility and prestige, Los Ranchos continues to deliver.
The town’s steady price growth reflects its enduring appeal across market cycles. While other neighborhoods may experience booms and busts, Los Ranchos enjoys a deep bench of affluent, long-term residents who are unlikely to sell quickly, which limits inventory. The 20% spike in 2022, followed by continued growth into 2025, shows that high-end buyers view Los Ranchos as a safe and desirable investment. With strong schools, cultural amenities, and a uniquely peaceful setting near the Rio Grande bosque, it’s no surprise this village remains one of the most expensive places to live in all of New Mexico.
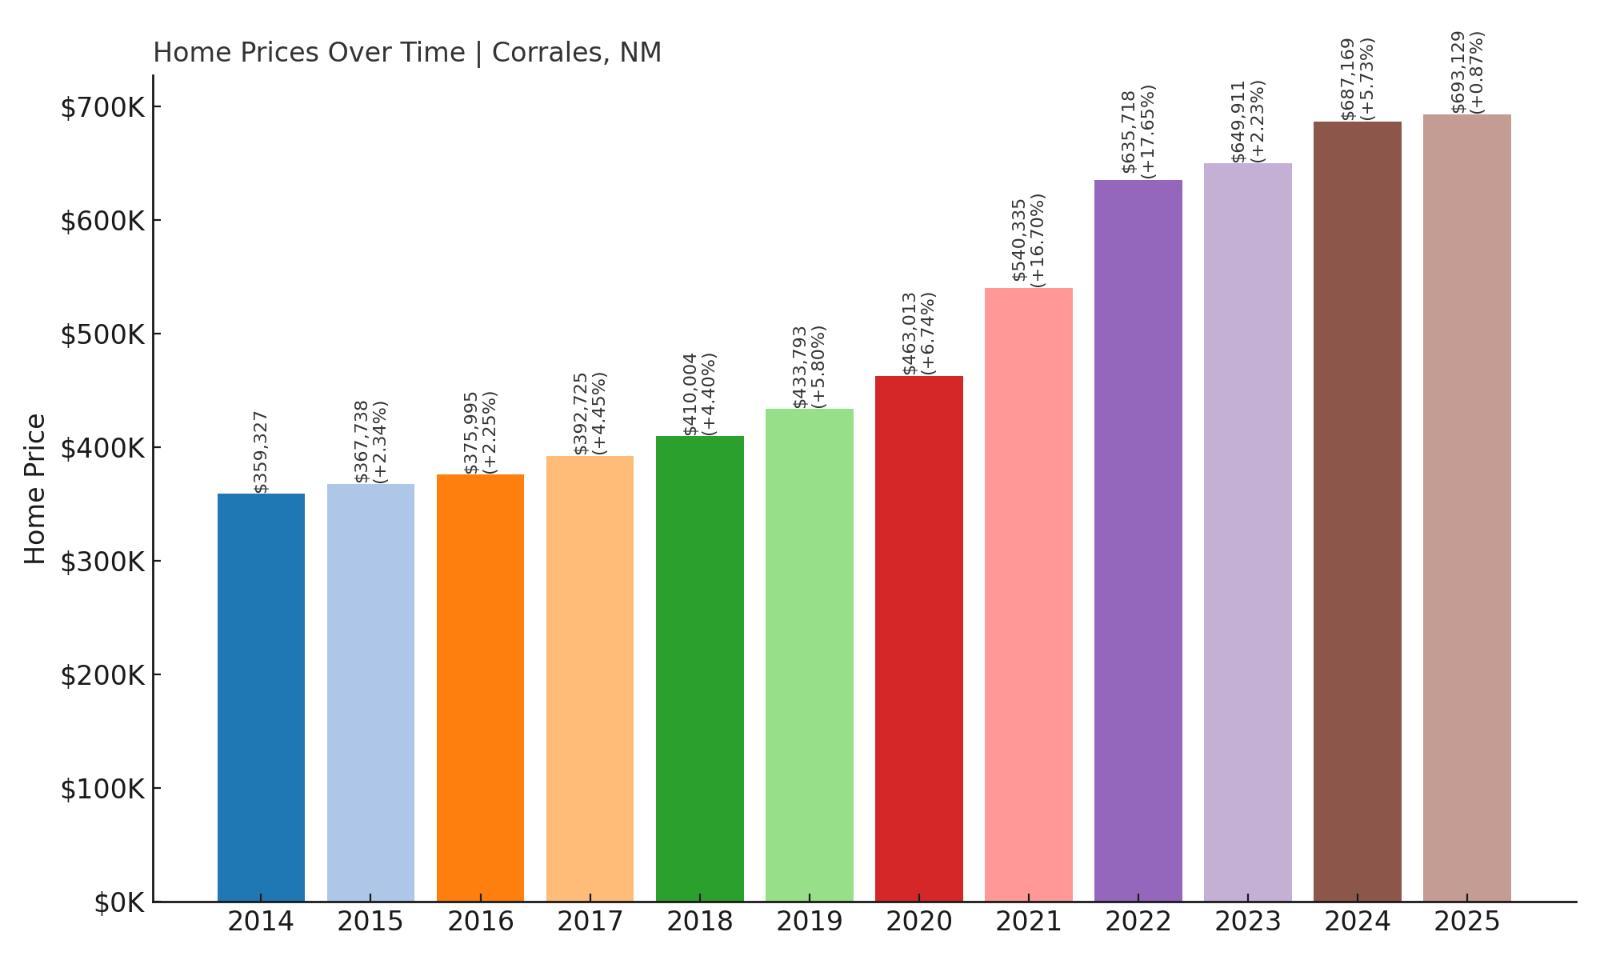
2. Corrales – 93% Home Price Increase Since 2014
- 2010: N/A
- 2011: N/A
- 2012: N/A
- 2013: N/A
- 2014: $359,327
- 2015: $367,738 (+$8,411, +2.34% from previous year)
- 2016: $375,995 (+$8,257, +2.25% from previous year)
- 2017: $392,725 (+$16,729, +4.45% from previous year)
- 2018: $410,004 (+$17,279, +4.40% from previous year)
- 2019: $433,793 (+$23,789, +5.80% from previous year)
- 2020: $463,013 (+$29,220, +6.74% from previous year)
- 2021: $540,335 (+$77,323, +16.70% from previous year)
- 2022: $635,718 (+$95,382, +17.65% from previous year)
- 2023: $649,911 (+$14,193, +2.23% from previous year)
- 2024: $687,169 (+$37,258, +5.73% from previous year)
- 2025: $693,129 (+$5,960, +0.87% from previous year)
Home prices in Corrales have jumped 93% since 2014, rising from $359,327 to $693,129 in 2025. The sharpest increases came in the early 2020s, with gains of over 16% and 17% in back-to-back years. While the market has stabilized recently, Corrales continues to attract high-end buyers who are drawn to its rural charm, artistic culture, and close proximity to Albuquerque.
Corrales – Art, Acreage, and Affluent Appeal
Corrales is a village with a personality all its own. Located just west of Albuquerque along the Rio Grande, it’s a place where horses outnumber stoplights and where local galleries, vineyards, and farm-to-table eateries dot the landscape. Known for its rural zoning and devotion to preserving agricultural character, Corrales offers an alternative to suburban sprawl. Many homes here sit on one-acre lots or larger, with architecture ranging from classic adobe to modern custom designs. Buyers are typically drawn to the tranquility, views, and creative community—not to mention the unbeatable access to nature trails and river walks just minutes from their doorstep.
Real estate in Corrales has remained hot due to constrained inventory and sustained demand from buyers seeking space, privacy, and a unique village atmosphere. The 2020–2022 surge saw prices leap by nearly 35% in two years, largely driven by pandemic-era preferences for larger homes and more land. Even as appreciation has slowed, the market remains strong, with prices inching upward in both 2024 and 2025. With its reputation as one of the most livable and scenic towns in the state, Corrales isn’t just a place to buy a home—it’s a place to stay for the long haul.
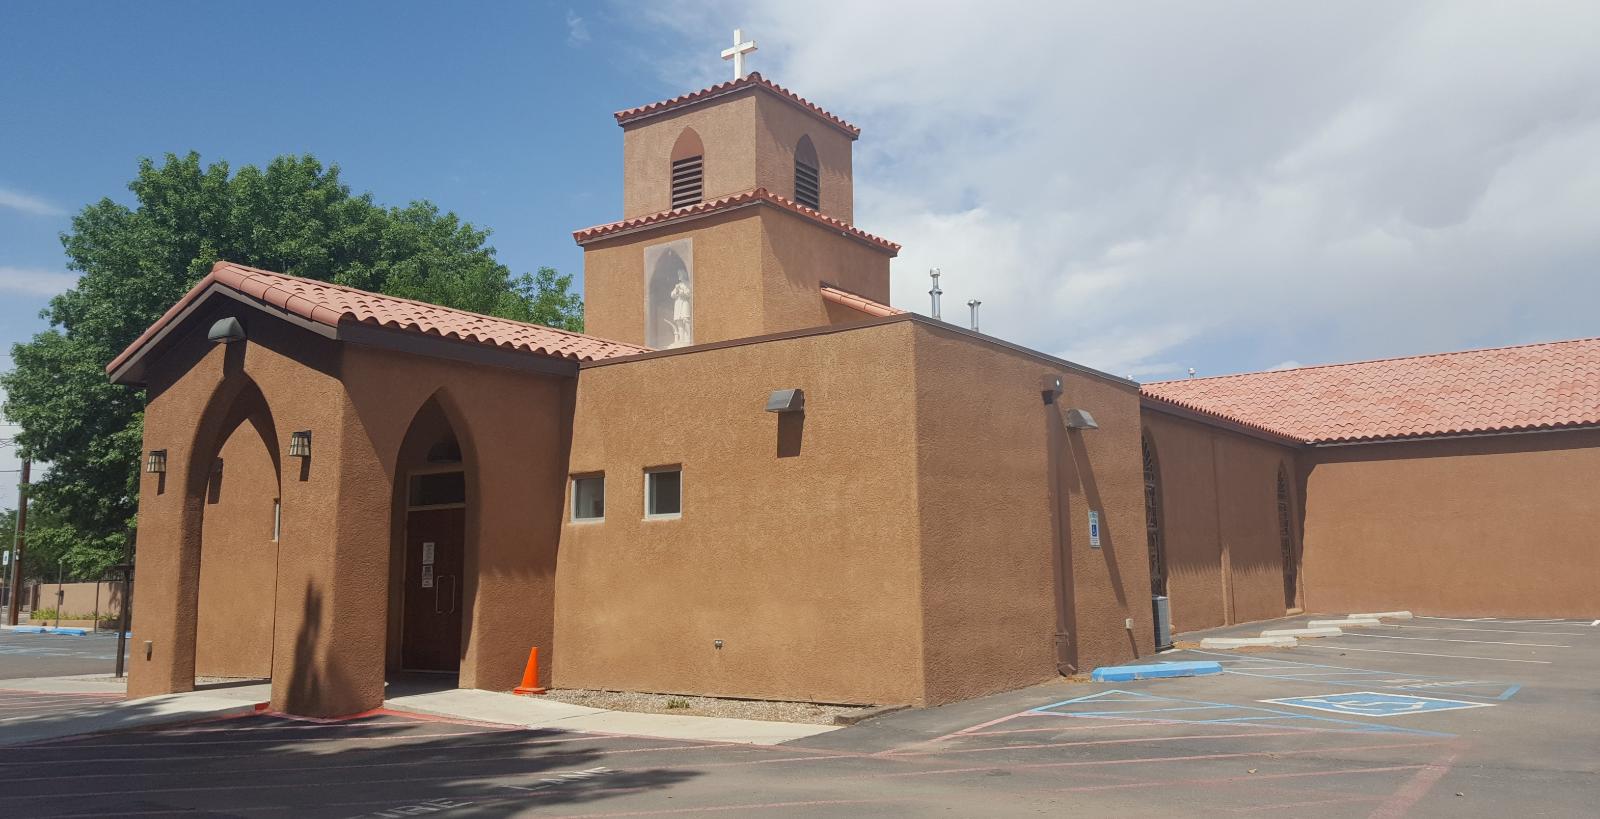
1. Lamy – 101% Home Price Increase Since 2012
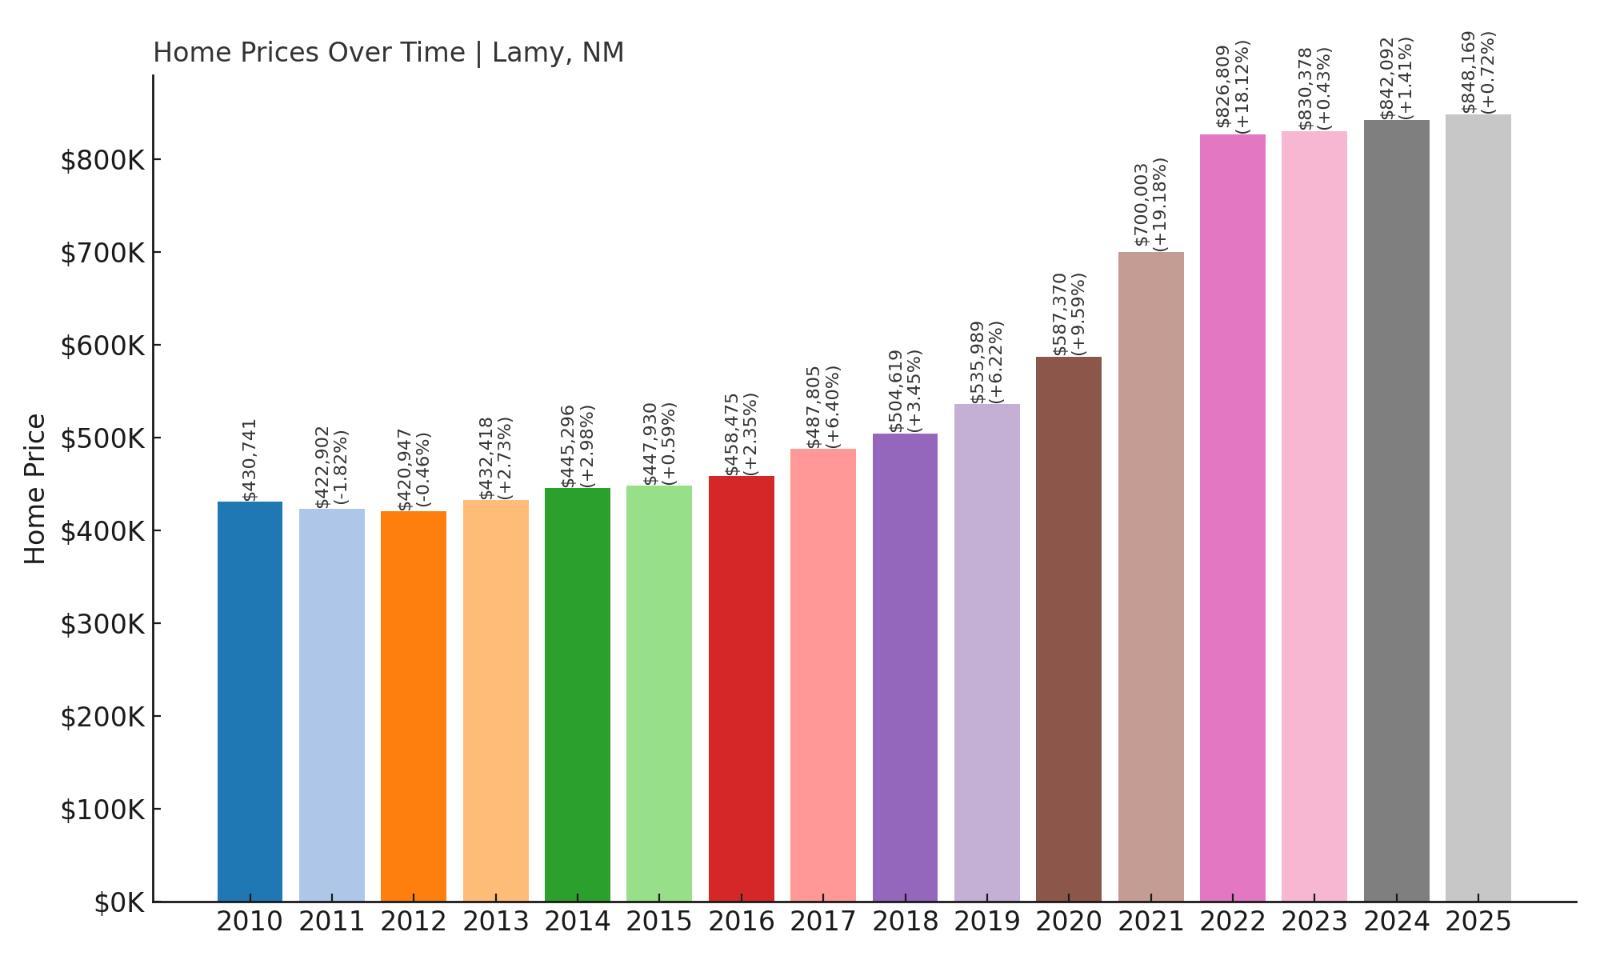
- 2010: $430,741
- 2011: $422,902 (-$7,839, -1.82% from previous year)
- 2012: $420,947 (-$1,955, -0.46% from previous year)
- 2013: $432,418 (+$11,471, +2.73% from previous year)
- 2014: $445,296 (+$12,878, +2.98% from previous year)
- 2015: $447,930 (+$2,634, +0.59% from previous year)
- 2016: $458,475 (+$10,545, +2.35% from previous year)
- 2017: $487,805 (+$29,330, +6.40% from previous year)
- 2018: $504,619 (+$16,814, +3.45% from previous year)
- 2019: $535,989 (+$31,370, +6.22% from previous year)
- 2020: $587,370 (+$51,381, +9.59% from previous year)
- 2021: $700,003 (+$112,633, +19.18% from previous year)
- 2022: $826,809 (+$126,806, +18.12% from previous year)
- 2023: $830,378 (+$3,570, +0.43% from previous year)
- 2024: $842,092 (+$11,713, +1.41% from previous year)
- 2025: $848,169 (+$6,077, +0.72% from previous year)
Lamy tops the list with a 101% price increase since 2012, making it the most expensive housing market in New Mexico with an average home value of $848,169 in 2025. This historic village has consistently outperformed, thanks to high demand and extremely limited supply. With values soaring through the 2020s and continuing to rise modestly in 2025, Lamy has solidified its place as a premier destination for buyers seeking prestige and peace.
Lamy – Historic Railway Village Turned Elite Retreat
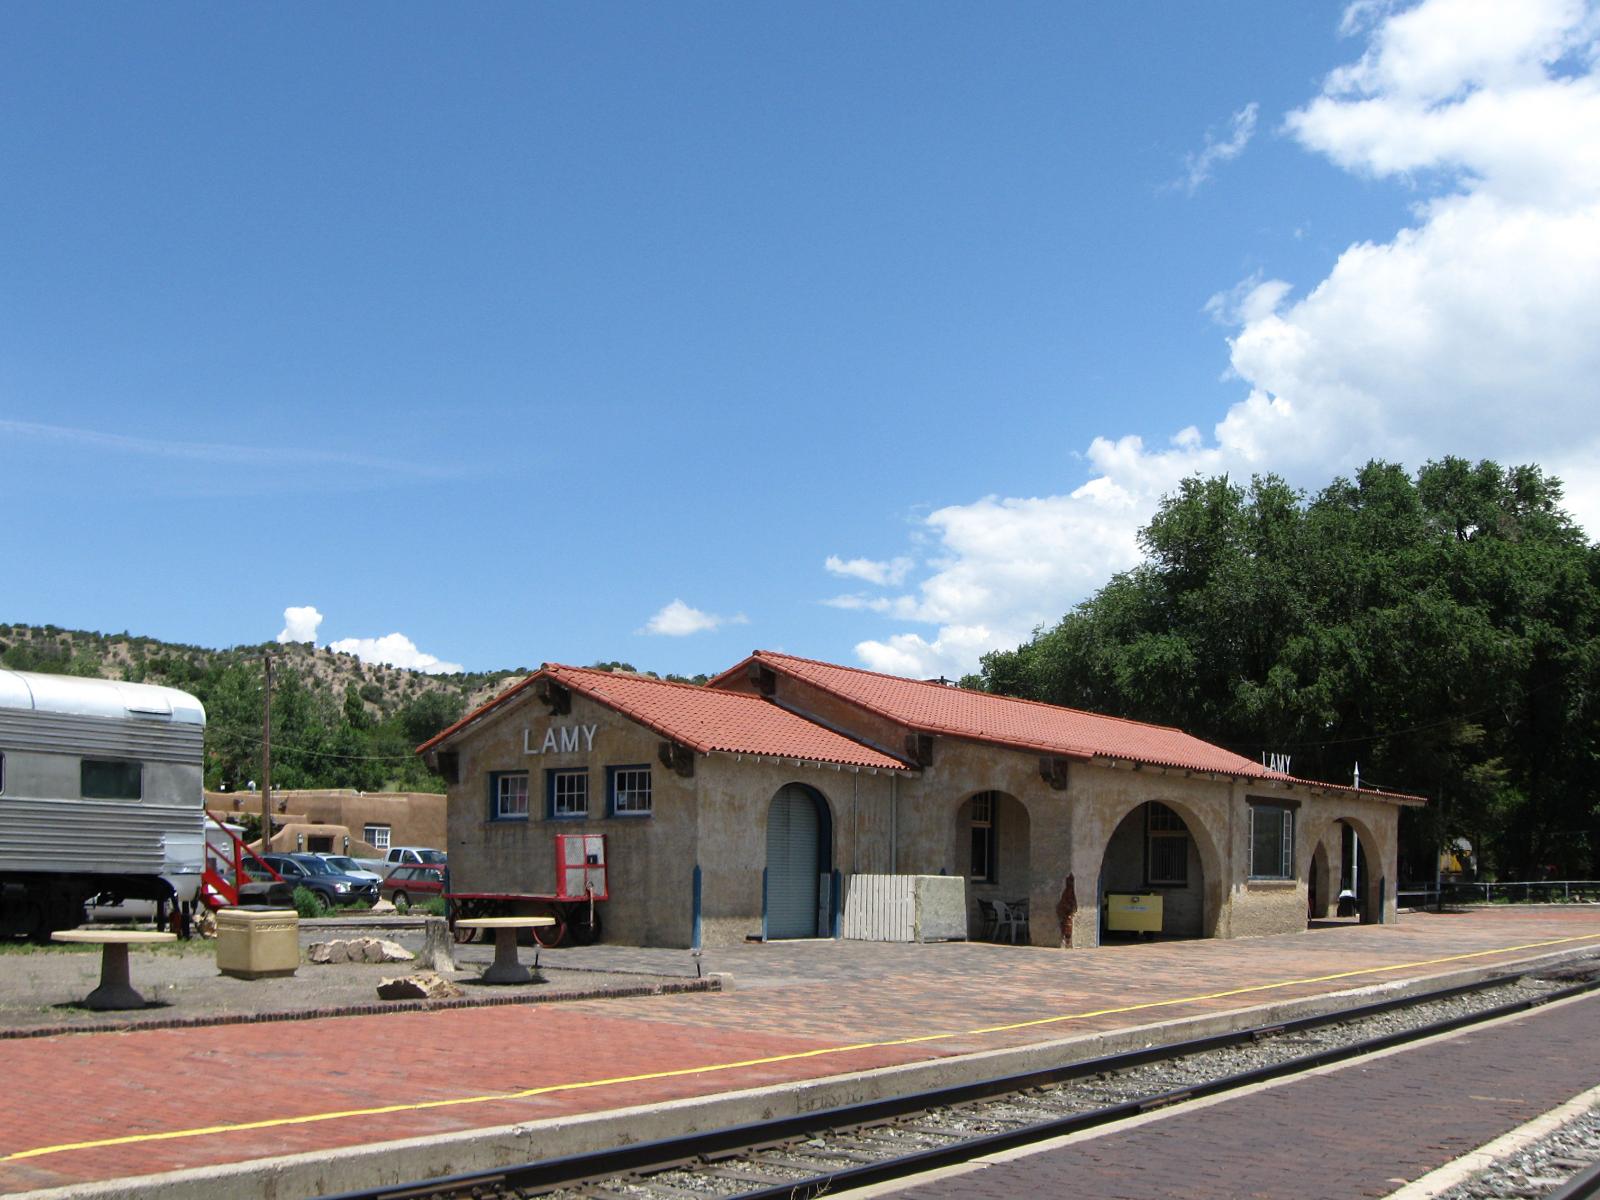
Lamy may be small, but its reputation looms large. Situated about 20 minutes southeast of Santa Fe, this village was once a bustling railway hub and now functions as a quiet haven for creatives, intellectuals, and remote professionals seeking wide-open spaces. The town’s historic train depot, once the main gateway to Santa Fe, still hosts occasional tourist lines—but today, the real attraction is the privacy and beauty of the land itself. With homes often nestled on multi-acre lots and designed to maximize views of the surrounding mesas and mountains, Lamy offers a high-desert experience that feels worlds away from nearby cities.
Housing stock in Lamy is incredibly limited, with few new developments and a strong emphasis on preserving the area’s rural character. This scarcity, combined with growing interest from high-income buyers, has fueled rapid appreciation—especially from 2020 to 2022, when prices rose by more than $239,000 in just two years. Even now, price increases remain positive, reflecting continued demand despite broader market slowdowns. For those who can afford it, Lamy represents not just a place to live, but a statement of lifestyle: quiet, refined, and rooted in the timeless New Mexican landscape.